
Beige Book and ADP Employment Release Key Data, U.S. Markets Mixed
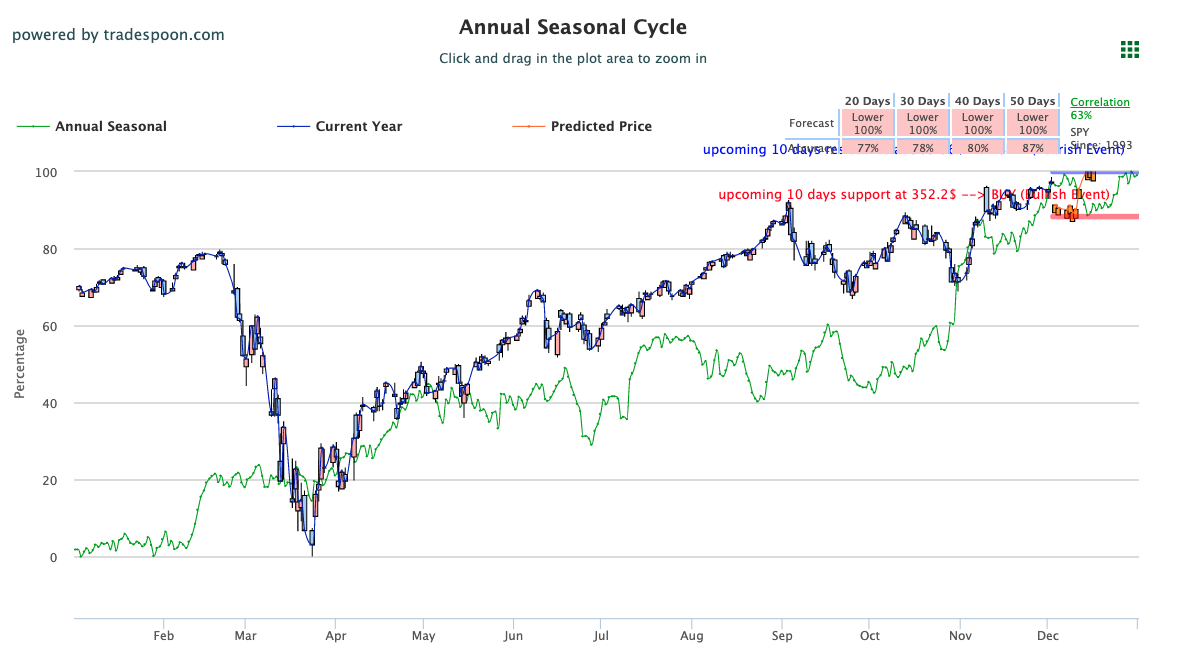
Until an additional breakout is sustained, our models are projecting the SPY to trade between the $340-$360 levels. With growing momentum regarding additional fiscal stimuli, as a bipartisan effort makes its way through Congress, major U.S. indices turned higher alongside higher Treasury yields. Only the Nasdaq closed in the red, down 0.05%, while the S&P and Dow saw shares higher ahead of and after the latest release of the U.S. Beige Book.
While most of the economy saw moderate economic growth, four Federal Reserve districts reported “little or no growth,” which broke from the recent trend of all twelve districts seeing some growth. Businesses are reportedly looking ahead towards the first quarter of 2021 with concern regarding a slowdown in activity, labor supply, amongst other issues. Still, the Beige Book featured several highlights including homebuilding and manufacturing data. Also released today was the latest ADP Employment report which noted a slowdown in hiring but and an increase in private-sector jobs.
We are seeing strong rotation from growth to value stocks and believe the SPY is on its way to retest its recent highs. With the market prone to further corrections, the next level of support is set at $350. We will continue monitoring VIX levels, as the market can overshoot support and resistance levels when VIX is trading near the $25 level. We encourage all market commentary readers to maintain clearly defined stop-levels for all positions. For reference, the SPY Seasonal Chart is shown below:
Key U.S. Economic Reports/Events This Week
- ADP Employment Report (November) – Wednesday
- Beige Book – Wednesday
- Weekly Jobless Claims (11/28) – Thursday
- Markit Services PMI (November) – Thursday
- ISM Services Index (November) – Thursday
- Unemployment Rate (November) – Friday
- Average Hourly Earnings (November) – Friday
- Trade Deficit (October) – Friday
- Factory Orders (October) – Friday
(Want free training resources? Check our our training section for videos and tips!)
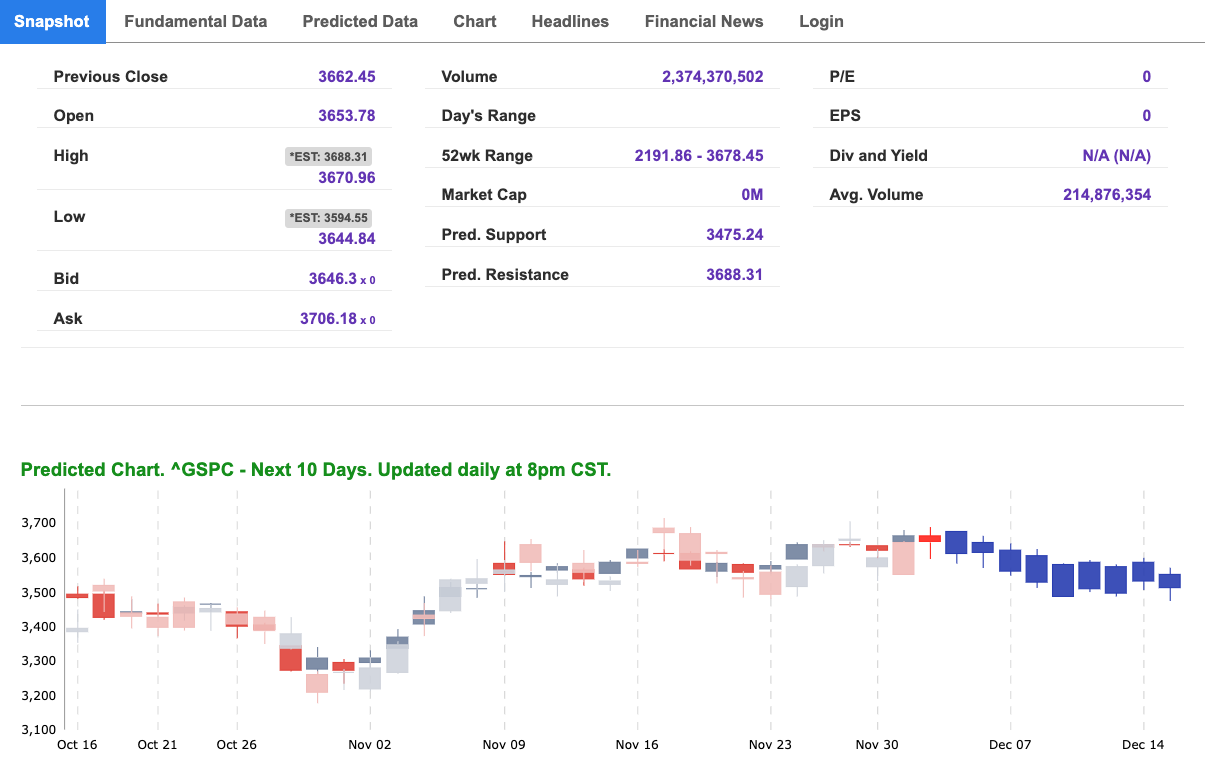
For reference, the S&P 10-Day Forecast is shown below:
Using the “^GSPC” symbol to analyze the S&P 500 our 10-day prediction window shows a near-term mixed outlook. Prediction data is uploaded after the market closes at 6 p.m. CST. Today’s data is based on market signals from the previous trading session.
Vlad’s Portfolio Lifetime Membership!
DO AS I DO… AS I DO IT WATCH LIVE AS I WORK THE MARKETS! TRY IT NOW RISK-FREE!
Click Here to Sign Up
Thursday Morning Featured Symbol
Our featured symbol for Thursday is Freeport-McMoRan Inc (FCX). F is showing a steady vector in our Stock Forecast Toolbox’s 10-day forecast.
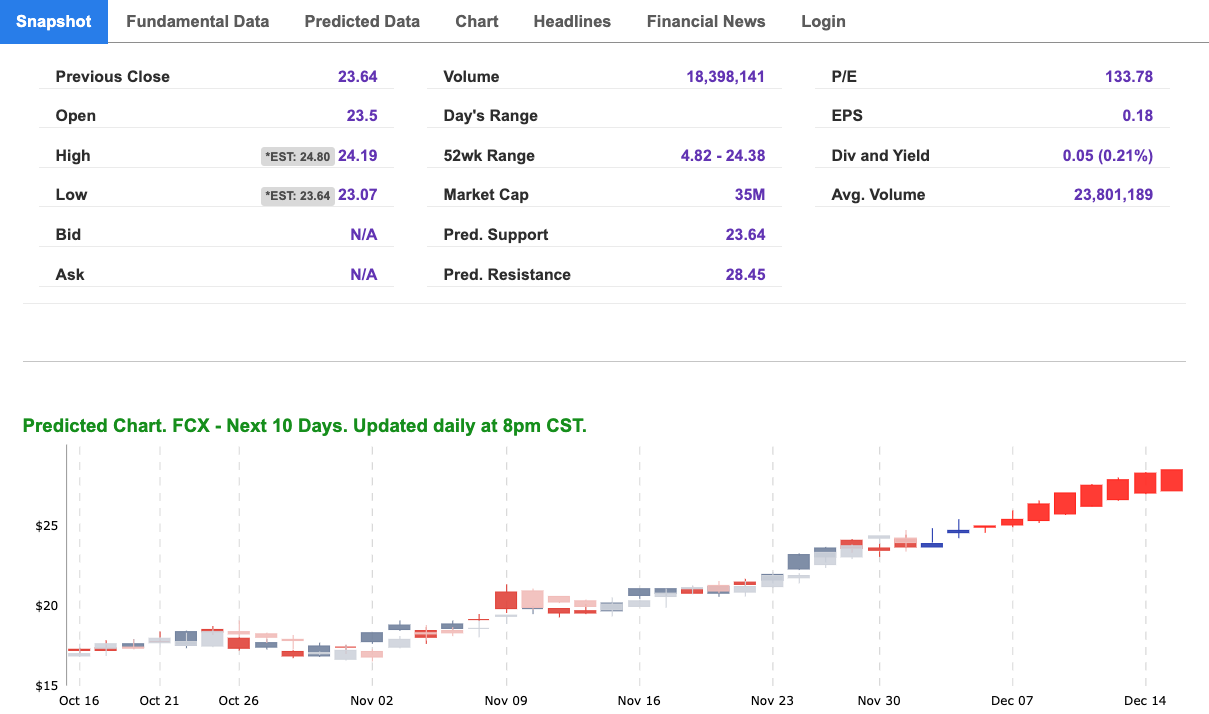
The stock is trading at $24.08 with a vector of +0.26% at the time of publication.
10-Day Prediction data is uploaded after the market close at 6 p.m., CST. Today’s data is based on market signals from the previous trading session.
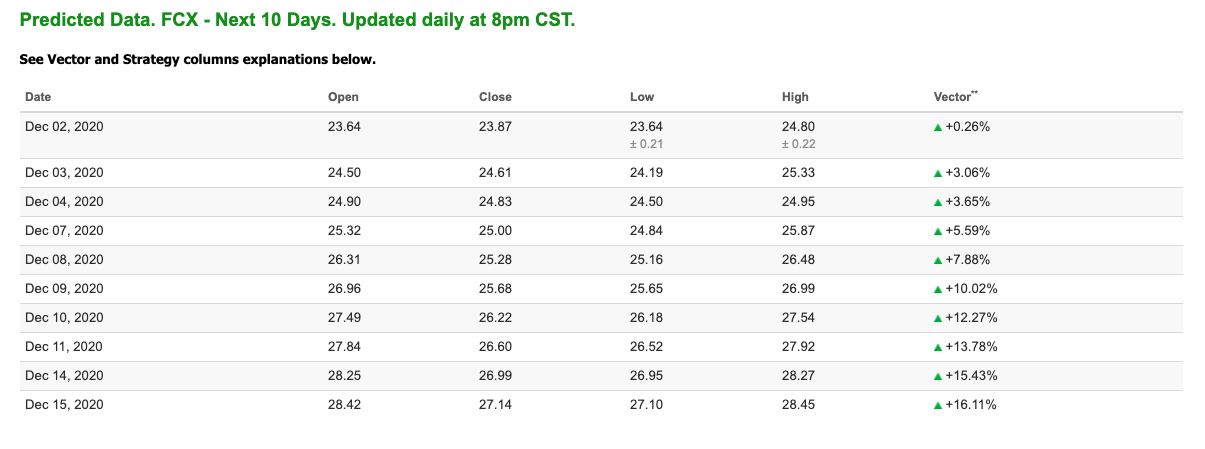
Note: The Vector column calculates the change of the Forecasted Average Price for the next trading session relative to the average of actual prices for the last trading session. The column shows the expected average price movement “Up or Down”, in percent. Trend traders should trade along the predicted direction of the Vector. The higher the value of the Vector the higher its momentum.
*Please note: At the time of publication Vlad Karpel does have a position in the featured symbol, FCX. Our featured symbol is part of your free subscription service. It is not included in any paid Tradespoon subscription service. Vlad Karpel only trades his money in paid subscription services. If you are a paid subscriber, please review your Premium Member Picks, ActiveTrader, or MonthlyTrader recommendations. If you are interested in receiving Vlad’s picks, please click here.
Oil
West Texas Intermediate for Crude Oil delivery (CL.1) is priced at $44.96 per barrel, up 0.92% at the time of publication.
Looking at USO, a crude oil tracker, our 10-day prediction model shows mixed signals. The fund is trading at $31.37 at the time of publication. Prediction data is uploaded after the market close at 6 p.m., CST. Today’s data is based on market signals from the previous trading session.
Gold
The price for the Gold Continuous Contract (GC00) is up 0.85% at $1834.30 at the time of publication.
Using SPDR GOLD TRUST (GLD) as a tracker in our Stock Forecast Tool, the 10-day prediction window shows mixed signals. The gold proxy is trading at $169.51, at the time of publication. Vector signals show +0.40% for today. Prediction data is uploaded after the market close at 6 p.m., CST. Today’s data is based on market signals from the previous trading session.
Treasuries
The yield on the 10-year Treasury note is up, at 0.886% at the time of publication.
The yield on the 30-year Treasury note is up, at 1.624% at the time of publication.
Using the iShares 20+ Year Treasury Bond ETF (TLT) as a proxy for bond prices in our Stock Forecast Tool, we see mixed signals in our 10-day prediction window. Prediction data is uploaded after the market close at 6 p.m., CST. Today’s data is based on market signals from the previous trading session.
Volatility
The CBOE Volatility Index (^VIX) is $21.25 at the time of publication, and our 10-day prediction window shows mixed signals. Prediction data is uploaded after the market close at 6 p.m., CST. Today’s data is based on market signals from the previous trading session. 