

No Rate Hikes in 2019
Ahead of earnings season, major U.S. indices surprised investors yesterday by closing higher following the release of the March FOMC meeting minutes, after trending down for most of the day.
TODAY’S MARKETS SEEMED HAMPERED BY GLOBAL UNCERTAINTY
Today, indices return to negative territory and are trading slightly lower. Yesterday’s rebound was likely sparked by the confirmation within the policy update that there will likely be no interest rate hikes in 2019 while today’s markets seemed hampered by global uncertainty, both in China and the EU. Although the U.K. received an extension from the EU, a general lack of what steps will come next and recent ECB comments seem to be weighing on investors. This combined with earnings season. China-U.S. trade talks seemed to have stalled as little news on this issue has been made public since last week’s meeting in the White House.
(Want free training resources? Check our our training section for videos and tips!)
TOMORROW THREE MAJOR BANKS REPORTING Q1 EARNINGS
Look for earnings season to fully kickoff tomorrow with three major banks reporting Q1 earnings, leading to next week’s steady stream of earnings reports. The market remains above its 200-day moving average and on track to retest 52 weeks high for the SPY at $294. For reference, the SPY Seasonal Chart is shown below:

2019 WILL MOST LIKELY NOT FACE AN INTEREST RATE HIKE
With the latest FOMC minutes, investors and traders alike were reassured 2019 will most likely not face an interest rate hike, as compared to the four we saw in 2018. Troubling global economic sentiment coupled with the mostly steady U.S. market conditions we have seen in 2019 helped the Feds arrive at this decision though few have not completely ruled out a hike closer to year’s end. For now the focus is on the big earnings season.
(Want free training resources? Check our our training section for videos and tips!)
BREXIT EXTENSION WAS GRANTED BY THE EUROPEAN UNION THROUGH OCTOBER OF THIS YEAR
Over in the U.K, a Brexit extension was granted by the European Union through October of this year. Recent efforts to expedite or make any progress in divorce deal negotiation have fallen flat in Parliament but many are optimistic the latest extension could provide sufficient time for a more widely-agreed-upon plan. Globally, Asian markets closed lower today while European markets rose slightly, apart from the U.K. which finished lower. Still, the U.K. pound was able to receive a slight boost from the granted extension.
THIS WEEK EARNINGS DATA INTO FULL FOCUS
Employment data today revealed a dip in unemployment, reaching its lowest number in nearly 50 years. Following several key economic reports this week, earnings data will now come into full focus. Tomorrow JPMorgan Chase, Wells Fargo, and PNC Financial will report earnings while yesterday’s Delta Airline earnings pushed assets of the airline up. Next week we will see earnings season reports from Citigroup, Goldman Sachs, Charles Schwab, Bank of America, and Morgan Stanley.
NEXT WEEK’S BANKING DATA, WILL CERTAINLY HAVE ITS IMPACT ON THE MARKET
Overall, the financial sector has been outpacing the market this year and tomorrow’s, as well as next week’s banking data, will certainly have its impact on the market. Other notable first-quarter earnings next week include Netflix, PepsiCo, Philip Morris, and many more.
(Want free training resources? Check our our training section for videos and tips!)

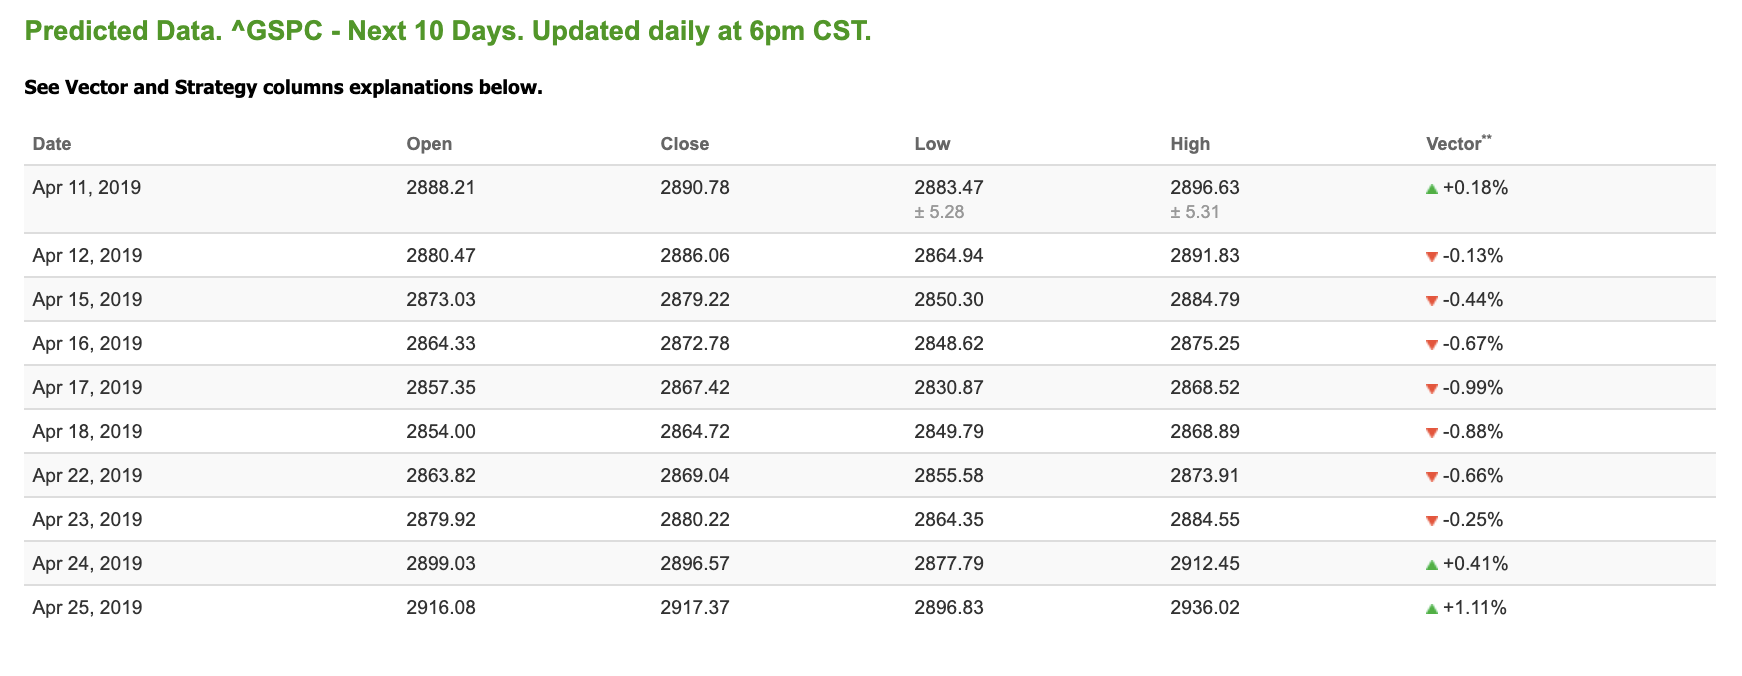
Using the “^GSPC” symbol to analyze the S&P 500, our 10-day prediction window shows mixed signals. Today’s vector figure of +0.18% moves to -0.88% in five trading sessions. The predicted close for tomorrow is $2886.06 ahead of earnings season. Prediction data is uploaded after the market close at 6 p.m., CST. Today’s data is based on market signals from the previous trading session.
(Want free training resources? Check our our training section for videos and tips!)
Brand Spanking New!
Introducing WeeklyTrader for the Self-Directed Investor
You can have this AI-powered system
behind your portfolio today!
PUT VLAD’S ALGORITHMS TO WORK FOR YOU AND BANK TRIPLE-DIGIT GAINS OVER AND OVER AGAIN.
IT JUST TAKES 15 MINUTES A WEEK TO SET UP YOUR PORTFOLIO AND KICK BACK WHILE YOU ENJOY A 75% WIN RATE.
AND, YOU CAN JOIN THOUSANDS OF TRADERS JUST LIKE YOU THAT ARE BEATING THE MARKET – USING THIS SIMPLE AND STRAIGHTFORWARD SYSTEM.
IF YOU’RE READY TO ENJOY THE FREEDOM THAT COMES FROM THIS ELITE TRADING SYSTEM AND LOCK IN A 50% DISCOUNT ON YOUR CHARTER MEMBERSHIP, JUST CLICK HERE TO GET STARTED.
YES! Click Here To Start
HIGHLIGHT OF A RECENT WINNING TRADE
On March 29th, our ActiveTrader service produced a bullish recommendation for Xerox Corp (XRX). ActiveTrader is included in all paid Tradespoon membership plans and is designed for day trading.
Trade Breakdown
XRX entered its forecasted Strategy B Entry 1 price range $32.01 (± 0.16) in its second hour of trading and passed through its Target price $32.33 in the first hour of trading the following trading day. The Stop Loss price was set at $31.69.

FRIDAY MORNING FEATURED STOCK
*Please note: Our featured stock is part of your free subscription service. It is not included in any paid Tradespoon subscription service. Vlad Karpel only trades his own personal money in paid subscription services. If you are a paid subscriber, please review your Premium Member Picks, ActiveTrader or MonthlyTrader recommendations. If you are interested in receiving Vlad’s personal picks, please click here.

Our featured stock for Friday is H&R Block Inc (HRB). HRB is showing a confident vector trend in our Stock Forecast Toolbox’s 10-day forecast. This stock is assigned a Model Grade of (B) indicating it ranks in the top 25th percentile for accuracy for predicted support and resistance, relative to our entire data universe.
The stock is trading at $25.33 at the time of publication, up 1.00% from the open with a +0.35% vector figure.
Prediction data is uploaded after market close at 6 p.m., CST. Today’s data is based on market signals from the previous trading session.

Note: The Vector column calculates the change of the Forecasted Average Price for the next trading session relative to the average of actual prices for the last trading session. The column shows expected average price movement “Up or Down”, in percent. Trend traders should trade along the predicted direction of the Vector. The higher the value of the Vector the higher its momentum.
OIL
West Texas Intermediate for May delivery (CLK9) is priced at $63.50 per barrel, down 1.73% from the open, at the time of publication.
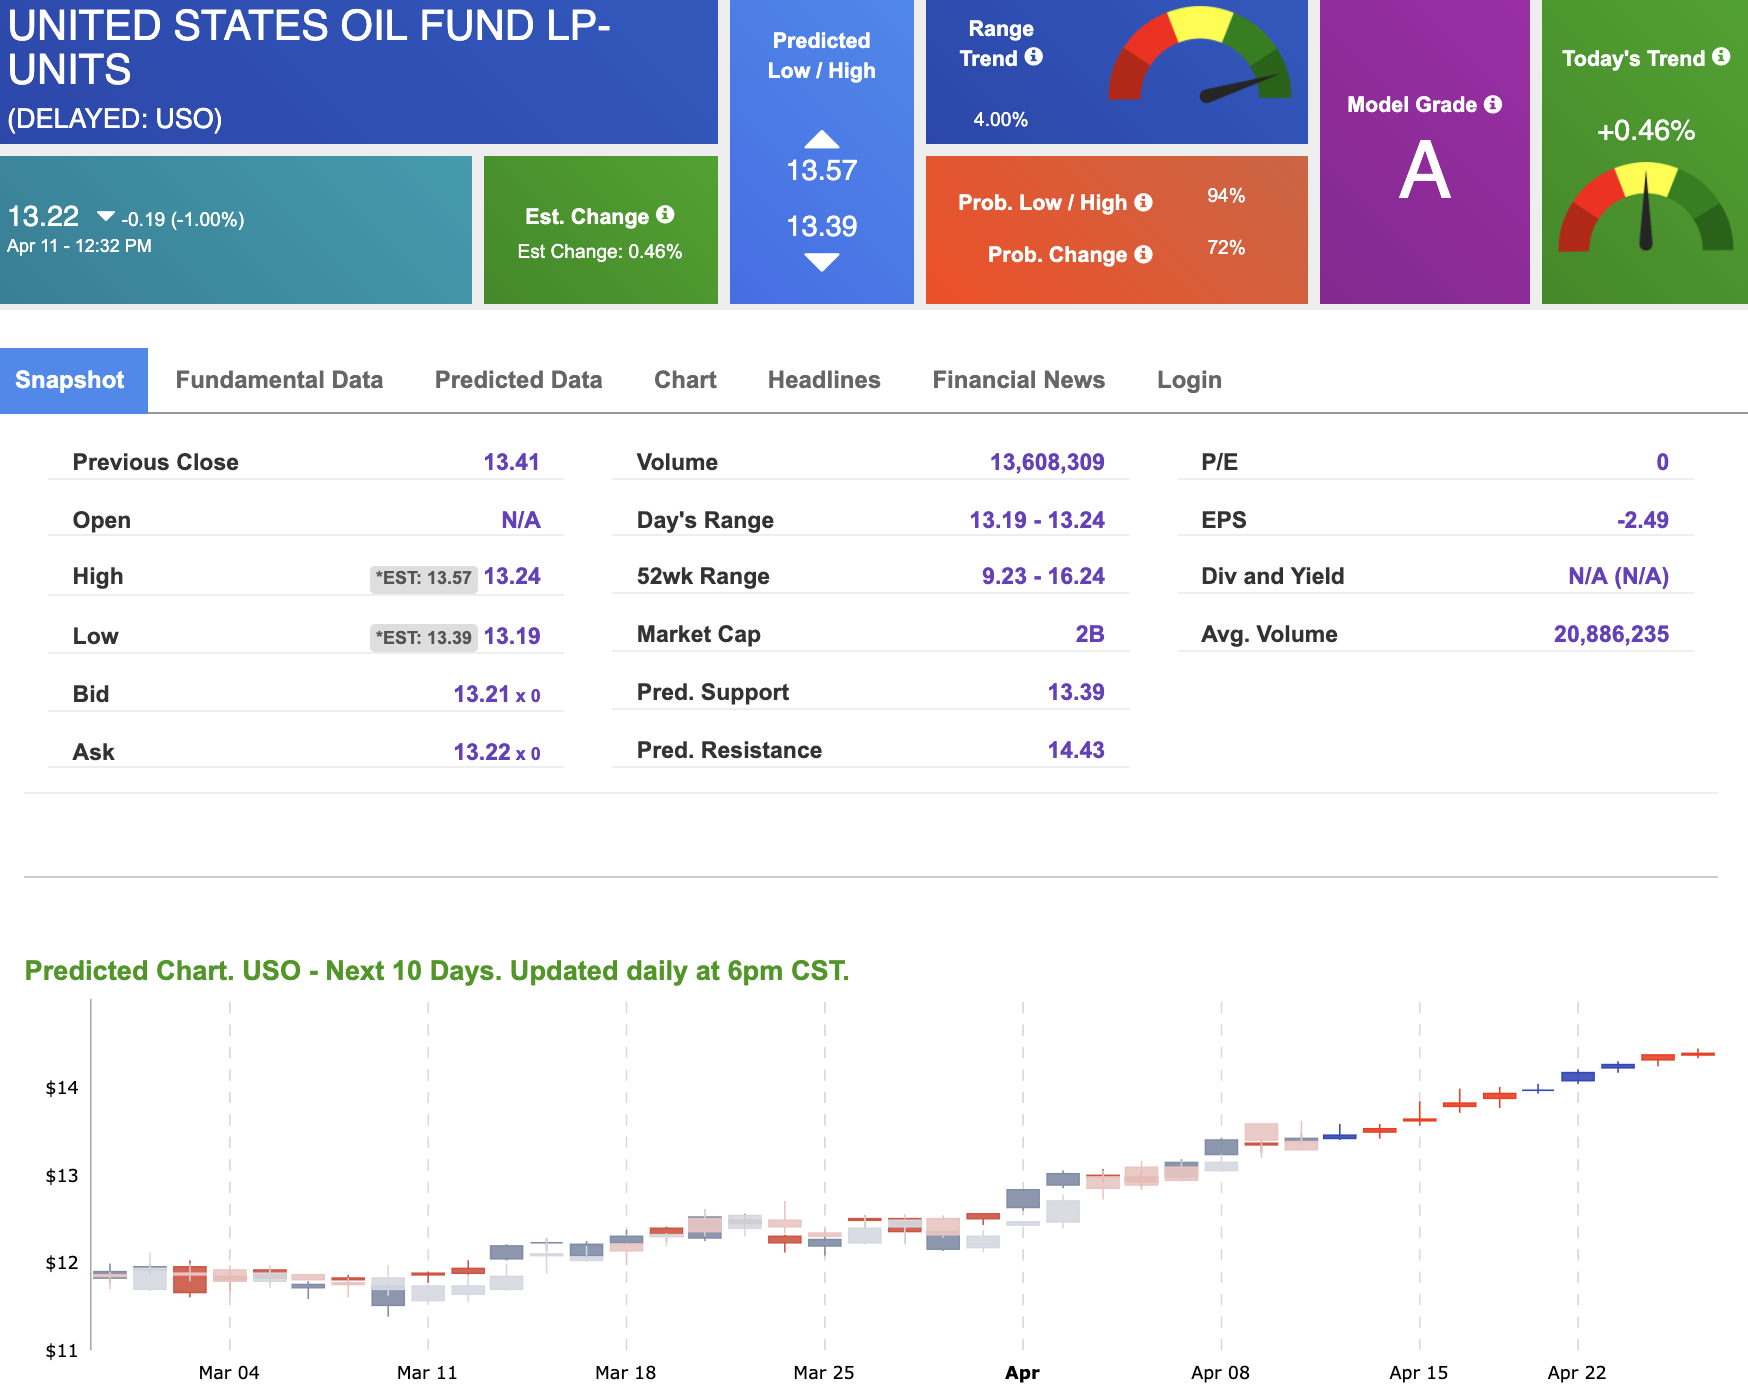
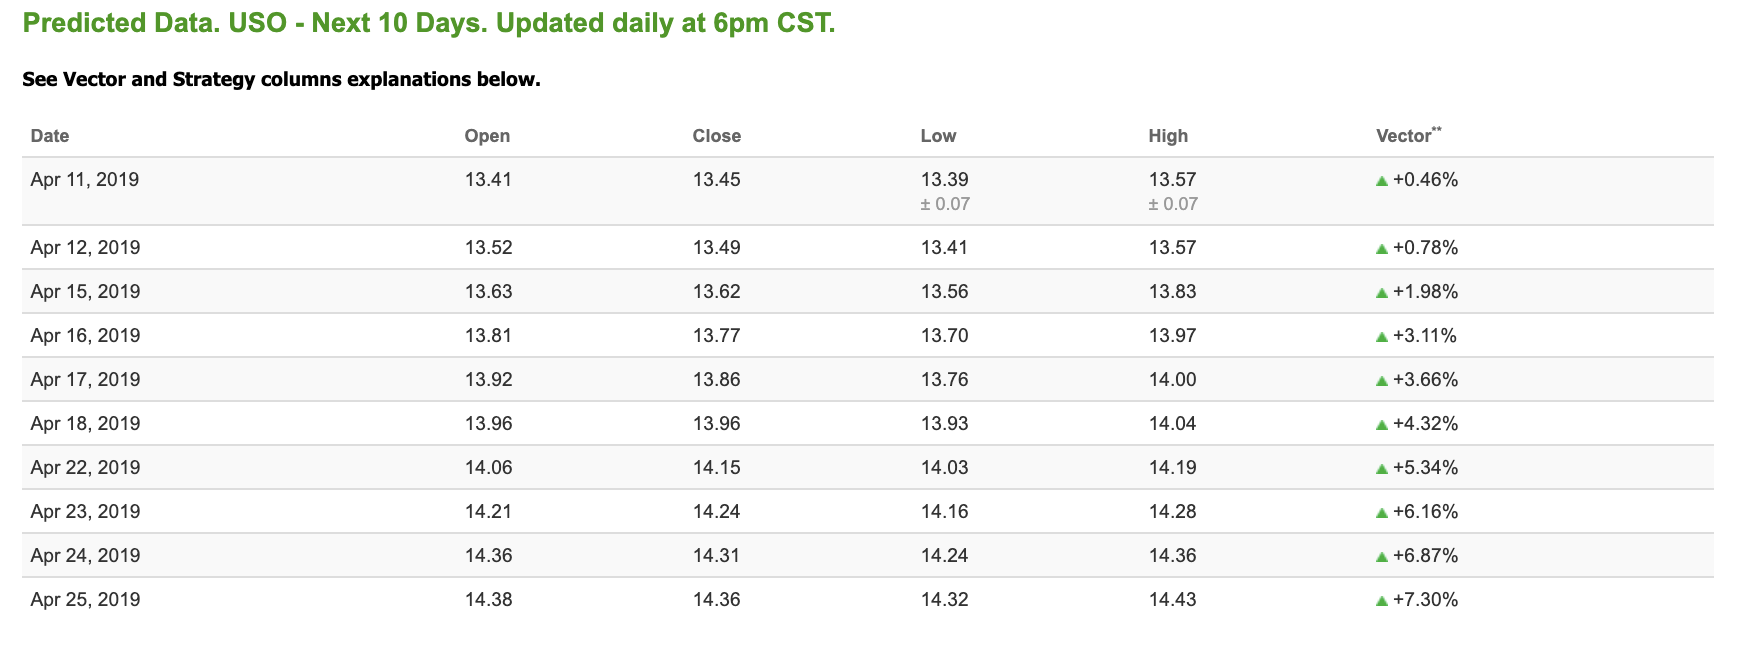
Looking at USO, a crude oil tracker, our 10-day prediction model shows positive signals. The fund is trading at $13.22 at the time of publication, down 1.00% from the open. Vector figures show +0.46% today, which turns +4.32% in five trading sessions. Prediction data is uploaded after market close at 6 p.m., CST. Today’s data is based on market signals from the previous trading session.
GOLD
The price for June gold (GCM9) is down 1.53% at $1,293.80 at the time of publication.
Using SPDR GOLD TRUST (GLD) as a tracker in our Stock Forecast Tool, the 10-day prediction window shows mostly mixed signals. The gold proxy is trading at $122.15, down 1.00% at the time of publication. Vector signals show +0.30% for today. Prediction data is uploaded after market close at 6 p.m., CST. Today’s data is based on market signals from the previous trading session.


TREASURIES
The yield on the 10-year Treasury note is up 1.48% at 2.51% at the time of publication. The yield on the 30-year Treasury note is up 1.18% at 2.93% at the time of publication.
Using the iShares 20+ Year Treasury Bond ETF (TLT) as a proxy for bond prices in our Stock Forecast Tool, we see negative signals in our 10-day prediction window. Today’s vector of -0.18% moves to -1.05% in three sessions. Prediction data is uploaded after market close at 6 p.m., CST. Today’s data is based on market signals from the previous trading session.


VOLATILITY
The CBOE Volatility Index (^VIX) is down 0.83% at $13.19 at the time of publication, and our 10-day prediction window shows mixed signals. The predicted close for tomorrow is $13.51 with a vector of +2.31%. Prediction data is uploaded after market close at 6 p.m., CST. Today’s data is based on market signals from the previous trading session.