Earnings Season End is Near, Overbought Market Looks for Direction
U.S. assets were under early morning pressure from further tension building between China and the U.S., with more tariffs looking more likely with each day, however, assets have since rebounded to edge higher behind strong energy and financial sectors. The market is overbought, consider hedging. With earnings season is winding down investors and traders alike will need another stimulus to take market above 52 week high. HSBC, Etsy, Marriott, Zillow, Tyson, amongst others, will report today; while Disney, Emerson, and Snap report tomorrow.

With all three major U.S. indices up at the moment, trade war tensions seemed to have eased off U.S stocks. On Friday, China declared another $60 billion in tariffs on U.S. goods while Trump responded over the weekend, signaling more tariffs are likely to come and that the tariffs have been “working big time.” Weaker than expected labor numbers stunted movement on Friday as the end of earnings season neared and trade tension regained focus. Another heavy week of earnings will certainly continue to provide plenty of economic data to stimulate markets but with earnings season closer to its end than beginning investors, again, will continue to look elsewhere for market direction and stimuli. Today’s survey on U.S consumer expectations from July is one example of such data.
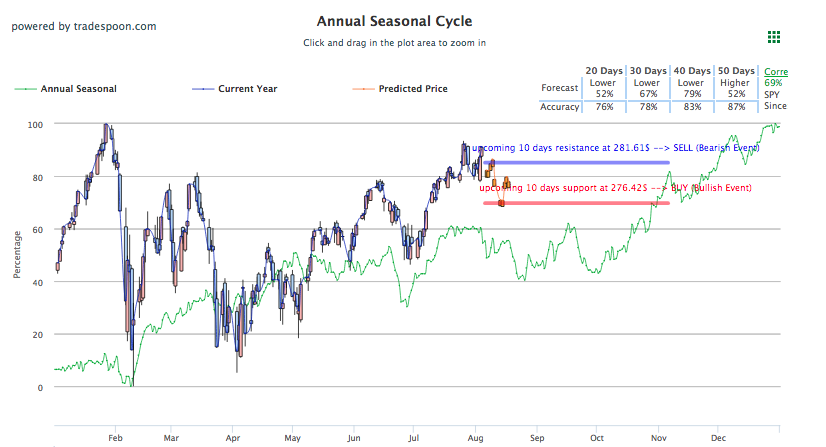
Tyson, Cardinal Health, and SeaWorld all rode successful earnings calls to higher shares while shares of Pain Therapeutics Inc. plummeted after the FDA rejected its non-opioid drug. Overall, U.S. assets have been on the move up today, looking towards a strong finish to start the week. 50 Day moving averages should be monitored alongside Seasonal Charts, shown above, to locate prominent entry and exit positions. Globally, European markets traded slightly higher while Asian markets struggled.
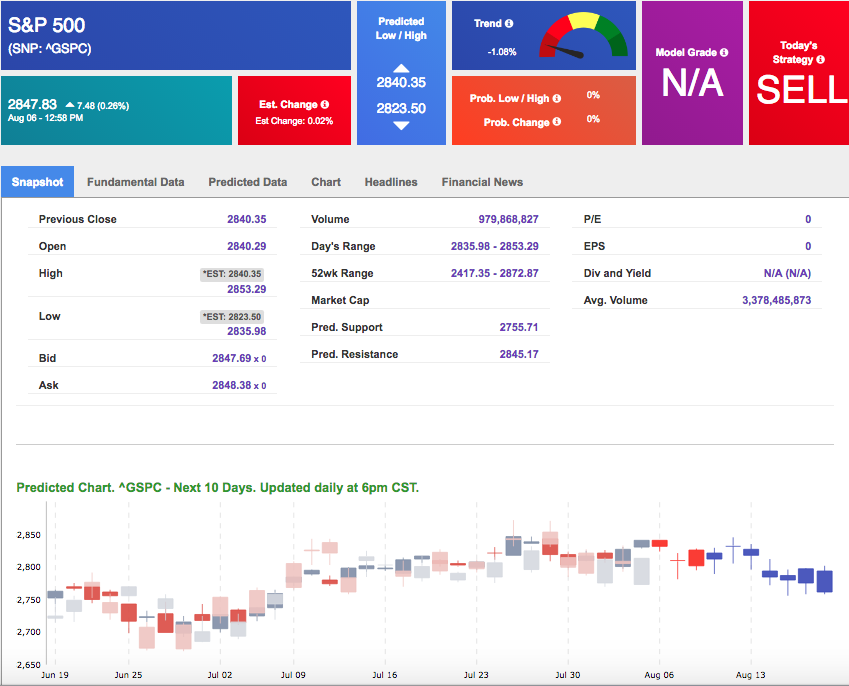
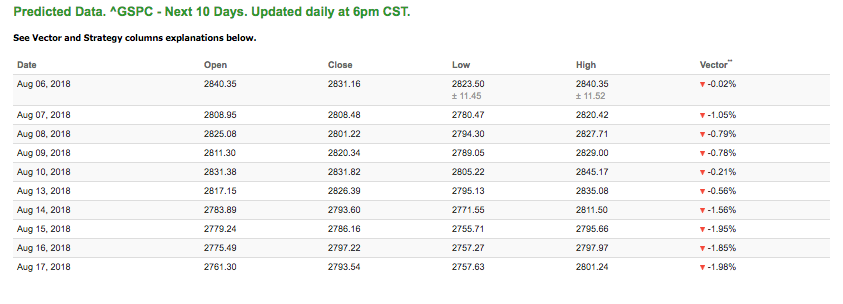
Using the ^GSPC symbol to analyze the S&P 500, our 10-day prediction window shows negative signals. Today’s vector figure of -0.02% moves to -1.05% in tomorrow. The predicted close for tomorrow is 2,808.48. Prediction data is uploaded after market close at 6 p.m., CST. Today’s data is based on market signals from the previous trading session.
Highlight of a Recent Winning Trade
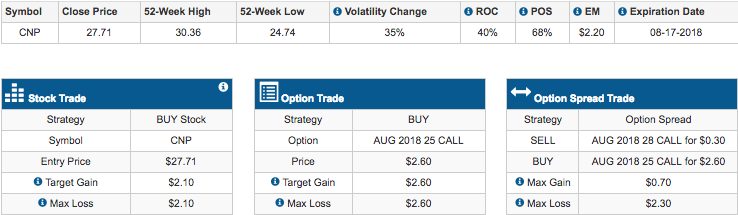
On July 2nd, our Premium Picks opened a recommendation for CenterPoint Energy(CNP), closing position on July 26. Premium Picks are only included in Premium membership plans and are designed for swing-trading, holding positions from seven to thirty days.

Trade Breakdown
Tuesday Morning Featured Stock
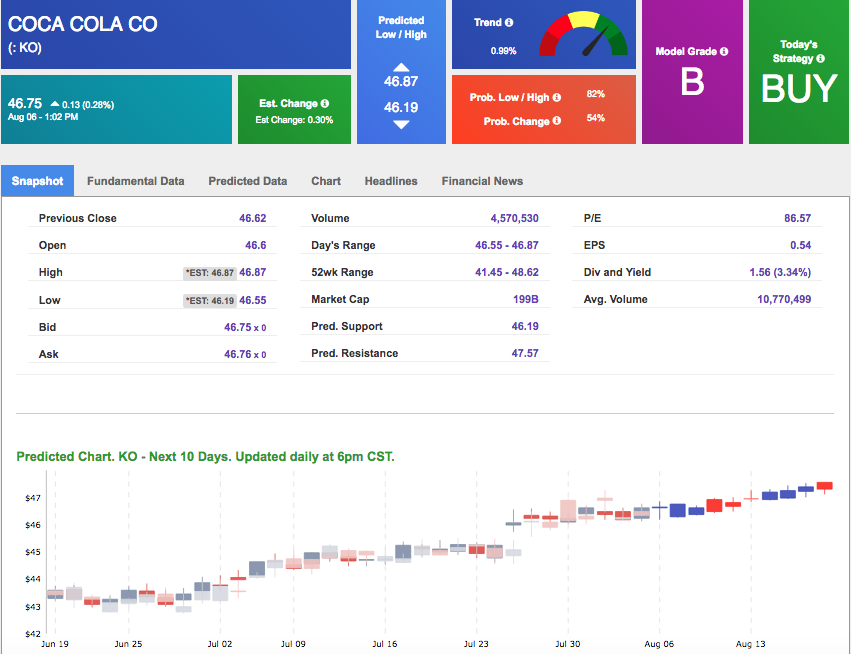
Our featured stock for Tuesday is Coca Cola Co (KO). KO is showing a confident uptrend in our Stock Forecast Toolbox’s 10-day forecast. This stock is assigned a Model Grade of (B) indicating it ranks in the top 25th percentile for accuracy for predicted support and resistance, relative to our entire data universe. Our 10-day prediction model shows positive vector figure reaching +1.22% in five trading sessions. Our benchmark for vector figures is +1.00%.
Note: Our featured stock is part of your free subscription service. It is not included in any paid Tradespoon subscription service. Vlad Karpel only trades his own personal money in paid subscription services. If you are a paid subscriber, please review your Premium Member Picks, ActiveTrader or ActiveInvestor recommendations. If you are interested in receiving Vlad’s personal picks, please click here.

The stock is trading at $46.78 at the time of publication, up 0.33% from the open with a +0.30% vector figure.
Tuesday’s prediction shows an open price of $46.28, a low of $46.26 and a high of 46.75.
The predicted close for tomorrow is $46.74. Vector figures stay positive tomorrow and drive upward throughout the 10-day forecast. This is a good signal for trading opportunities because we use vectors as a primary factor in determining price movements for stocks and ETF.
Prediction data is uploaded after market close at 6 p.m., CST. Today’s data is based on market signals from the previous trading session.
Note: The Vector column calculates the change of the Forecasted Average Price for next trading session relative to the average of actual prices for last trading session. The column shows expected average price movement “Up or Down”, in percent. Trend traders should trade along the predicted direction of the Vector. The higher the value of the Vector the higher its momentum.
Also, I want to introduce you to my Tradespoon Tools Service, a cutting-edge, transformational trading service for individual investors that puts the latest Artificial Intelligence at your fingertips while still leaving you in control.
Oil
West Texas Intermediate for September delivery (CLU8) is priced at $69.75 per barrel, up 1.85% from the open, at the time of publication. After crude output unexpectedly fell in July for Saudi Arabia, oil prices were on the move up today. This drop in output runs counter to OPEC’s recent decision to ramp up production.
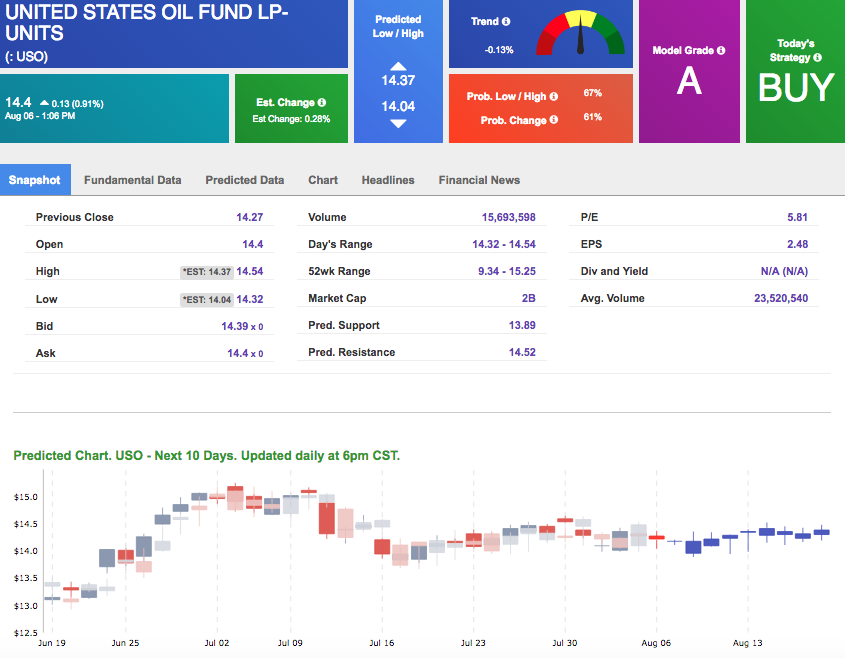
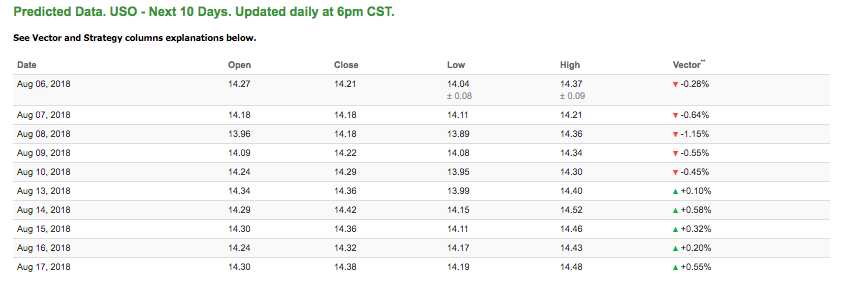
Looking at USO, a crude oil tracker, our 10-day prediction model mixed signals. The fund is trading at $14.4 at the time of publication, up 0.91% from the open. Vector figures show -0.28% today, which turns -1.15% in two trading sessions. Prediction data is uploaded after market close at 6 p.m., CST. Today’s data is based on market signals from the previous trading session.
Gold
Gold has hit a yearly low that continues its trend of trading lower these last few weeks, opposite of a strong dollar. Friday marked the fourth straight week gold has traded lower and this week is off to a similar start. The price for December gold (GCZ8) is down 0.45% at $1,217.20 at the time of publication.
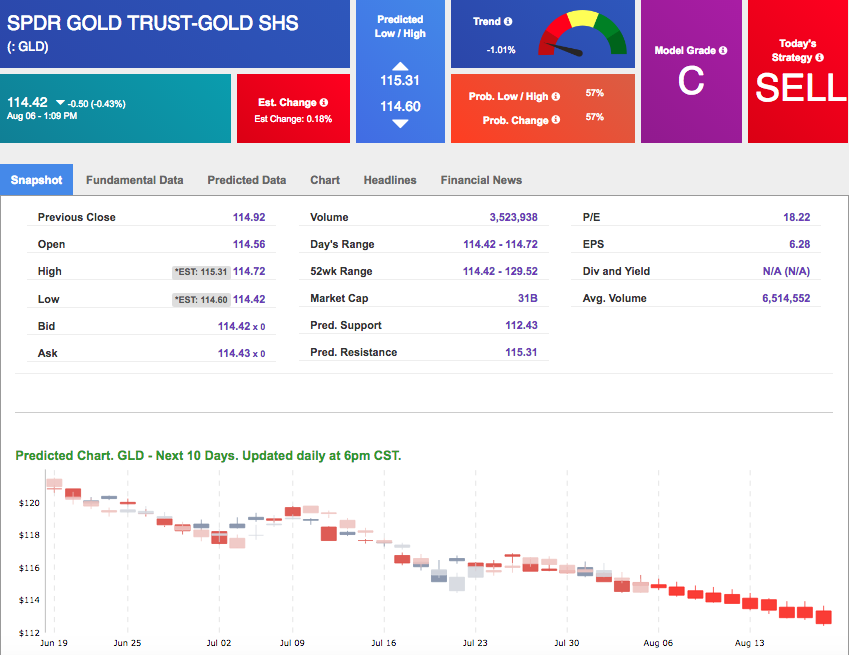
Using SPDR GOLD TRUST (GLD) as a tracker in our Stock Forecast Tool, the 10-day prediction window shows all negative signals. The gold proxy is trading at $114.42, down 0.43% at the time of publication. Vector signals show 0.18% for today. Prediction data is uploaded after market close at 6 p.m., CST. Today’s data is based on market signals from the previous trading session.

Treasuries
Yields on long-term bonds fell today as China tension continues to weigh on the treasury notes. Weaker than expected labor numbers also pushed yields lower on Friday, pushing the 10-year note just below the threatening 3.00% level. The yield on the 10-year Treasury note is down 0.44% at 2.94% at the time of publication. The yield on the 30-year Treasury note is down 0.35% at 3.08% at the time of publication.
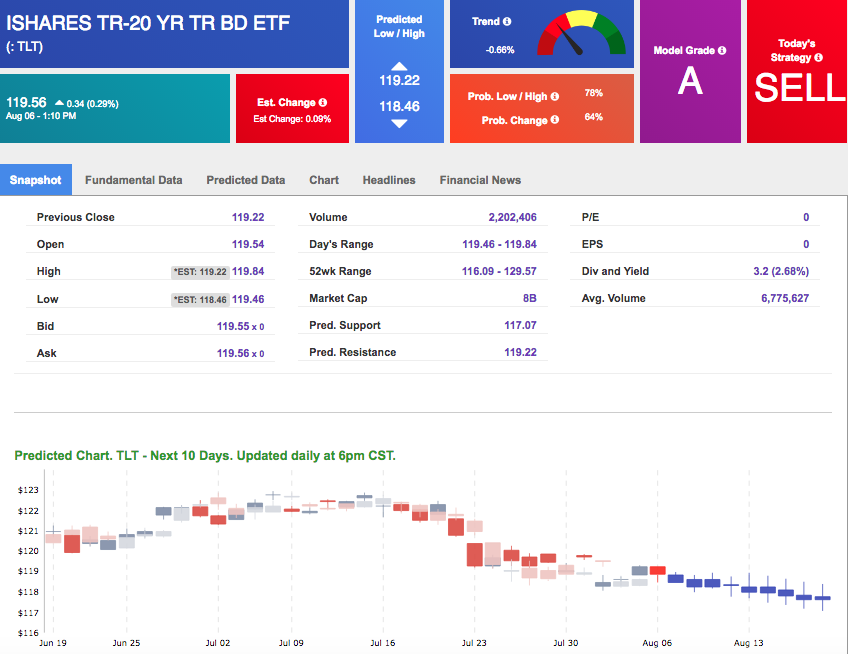
Using the iShares 20+ Year Treasury Bond ETF (TLT) as a proxy for bond prices in our Stock Forecast Tool, we see all negative signals in our 10-day prediction window. Today’s vector of -0.09% moves to -0.53% in two sessions. Prediction data is uploaded after market close at 6 p.m., CST. Today’s data is based on market signals from the previous trading session.

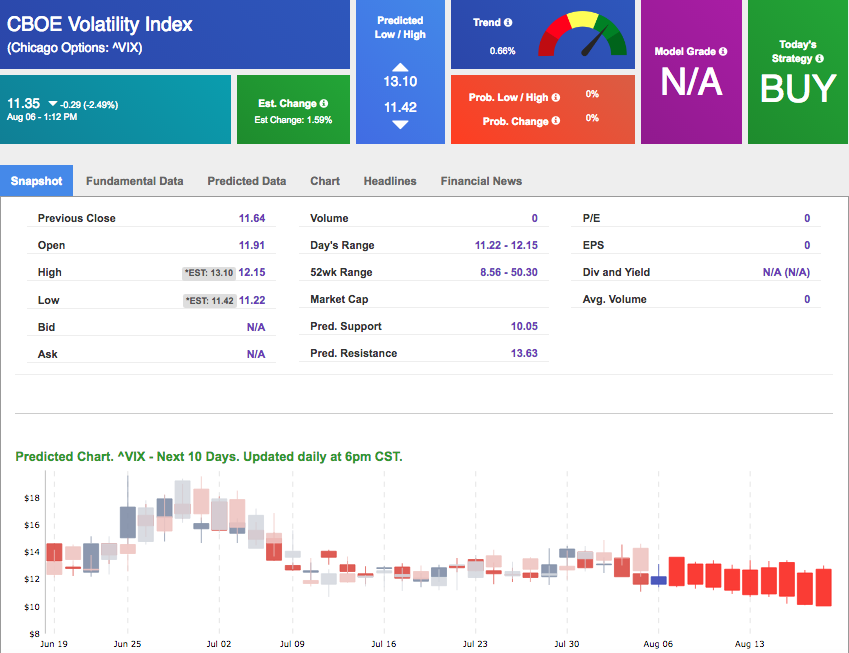
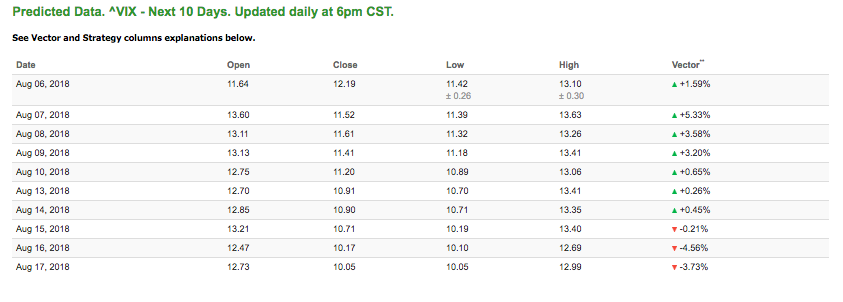
Volatility
The CBOE Volatility Index (^VIX) is down 2.49% at $11.35 at the time of publication, and our 10-day prediction window shows mixed signals. The predicted close for tomorrow is $11.52 with a vector of +5.33%. Prediction data is uploaded after market close at 6 p.m., CST. Today’s data is based on market signals from the previous trading session.