Major U.S. Indices Reach Intraday Records After Holiday-Weekend
All three major U.S. indices trading significantly higher
After the holiday weekend, markets held onto their gains with all three major U.S. indices trading significantly higher. Tech and finance shares booked sharp gains while global markets also saw impressive growth- as both European and Asian markets closed in the green. Earnings remain light this week with reports from Walgreens, Shaw Communications, Paychex, and Bed Bath Beyond Inc. due to release, while corporate earnings season officially kicks off next week with major banks releasing Q2 data. May Job Openings and Consumer Credit reports are also due this week.
Short-term traders could consider adding to positions when SPY near $293
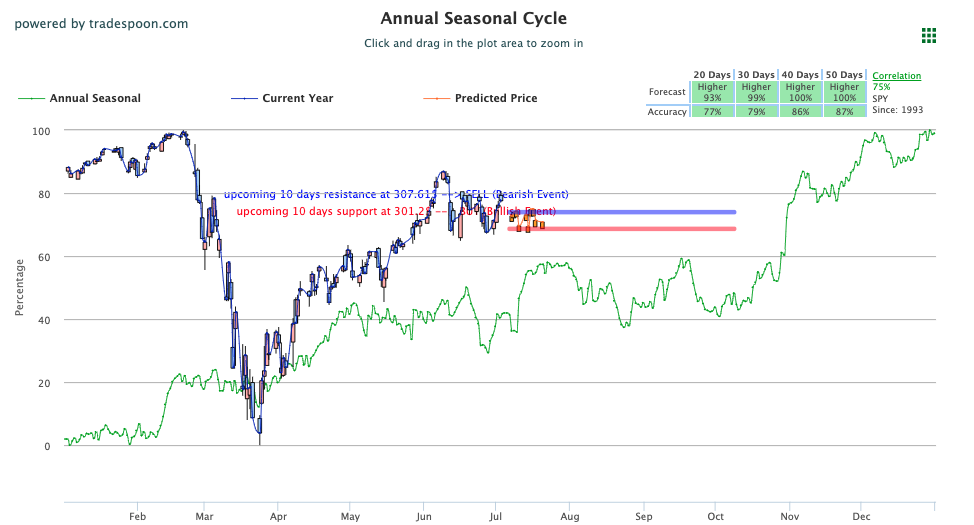
Until the market reaches $320 level for SPY, aggressive traders can consider adding to their positions as our models are projecting the SPY to trade between $270-$330 level. We still believe the market is overbought and we will continue monitoring VIX; the market can overshoot support and resistance levels when VIX is trading near $30 level and we will be buyers into any short-term corrections. Short-term traders could consider adding to positions when SPY near $293 and reducing exposure to the market at $320. Investors should consider hedging portfolios into the rallies and we encourage maintaining clearly defined stop-levels for all positions. For reference, the SPY Seasonal Chart is shown below:

Key U.S. Economic Reports/Events This Week
- Job Openings (May) – Tuesday
- Consumer Credit (May) – Wednesday
- Weekly Jobless Claims (7/4) – Thursday
- Wholesale Inventories (May) – Thursday
- Producer Price Index (June) – Friday
(Want free training resources? Check our our training section for videos and tips!)
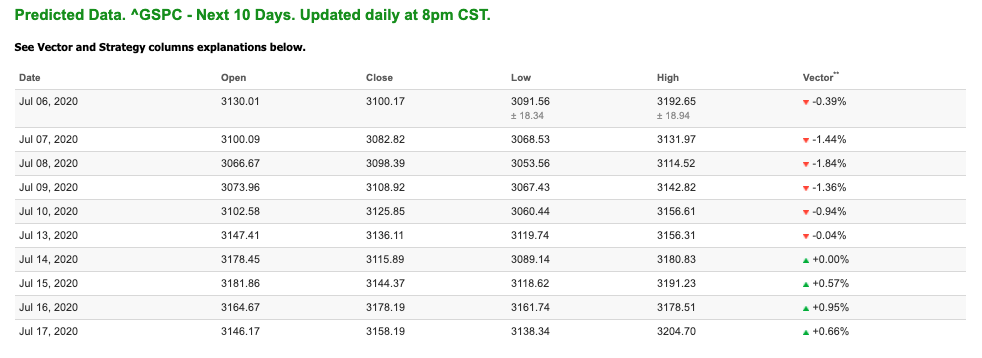
For reference, the S&P 10-Day Forecast is shown below:
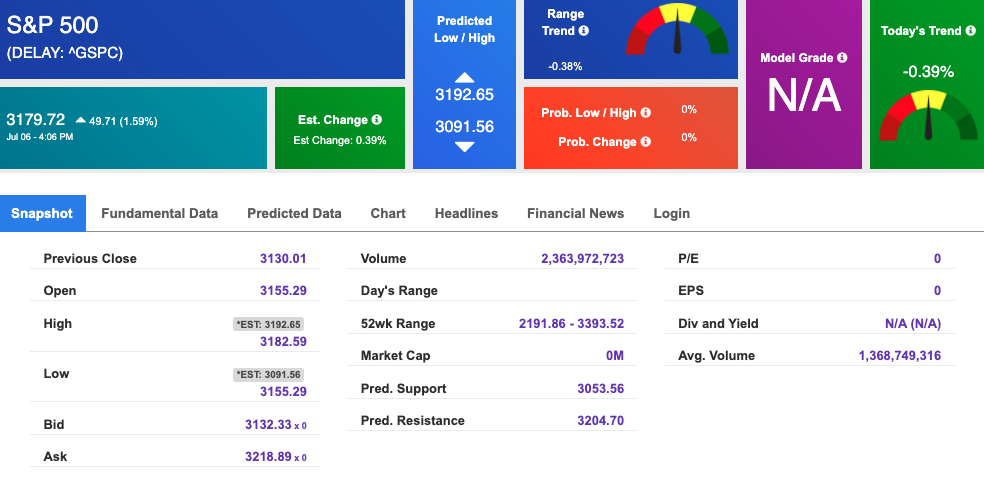
Using the “^GSPC” symbol to analyze the S&P 500 our 10-day prediction window shows a near-term mixed outlook. Prediction data is uploaded after the market closes at 6 p.m. CST. Today’s data is based on market signals from the previous trading session.
Vlad’s Portfolio Lifetime Membership!
DO AS I DO… AS I DO IT WATCH LIVE AS I WORK THE MARKETS! TRY IT NOW RISK-FREE!
Click Here to Sign Up
Tuesday Morning Featured Symbol
Our featured symbol for Tuesday is Adobe Systems Inc (ADBE). ADBE is showing a steady vector in our Stock Forecast Toolbox’s 10-day forecast. This stock is assigned a Model Grade of (B) indicating it ranks in the top 25th percentile for accuracy for current-day predicted support and resistance, relative to our entire data universe.
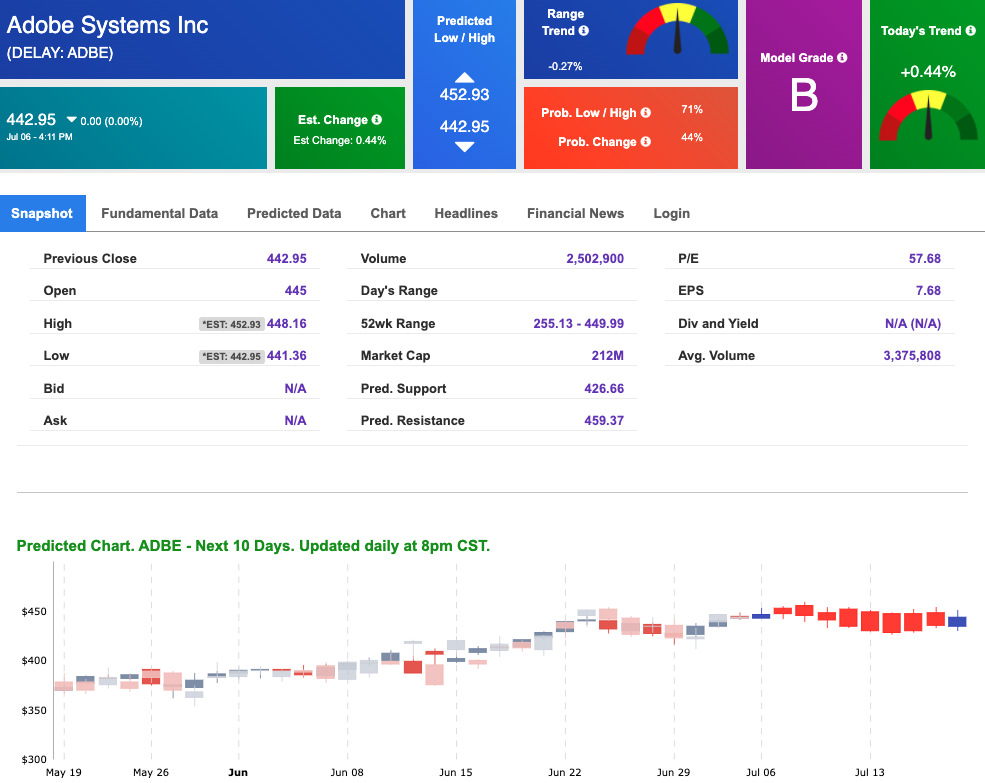
The stock is trading at $442.95, with a vector of +0.44% at the time of publication.
Prediction data is uploaded after the market close at 6 p.m., CST. Today’s data is based on market signals from the previous trading session.
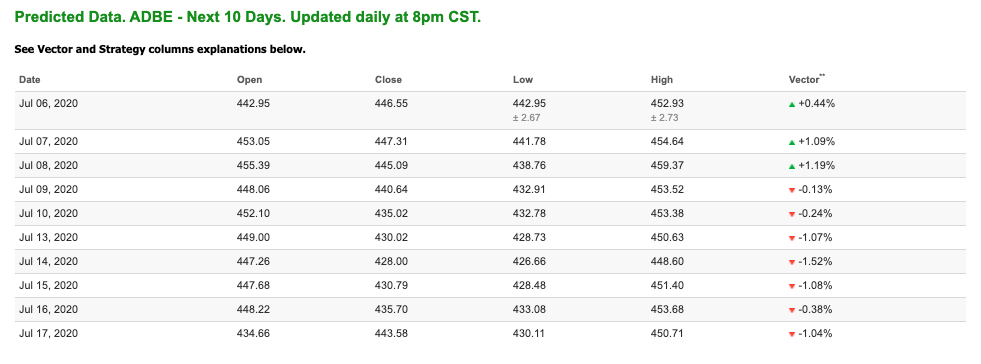
Note: The Vector column calculates the change of the Forecasted Average Price for the next trading session relative to the average of actual prices for the last trading session. The column shows the expected average price movement “Up or Down”, in percent. Trend traders should trade along the predicted direction of the Vector. The higher the value of the Vector the higher its momentum.
*Please note: At the time of publication Vlad Karpel does have a position in the featured symbol, ADBE Our featured symbol is part of your free subscription service. It is not included in any paid Tradespoon subscription service. Vlad Karpel only trades his money in paid subscription services. If you are a paid subscriber, please review your Premium Member Picks, ActiveTrader, or MonthlyTrader recommendations. If you are interested in receiving Vlad’s picks, please click here.
Oil
West Texas Intermediate for Crude Oil delivery (CL.1) is priced at $40.59 per barrel, down 0.15% from the open, at the time of publication.
Looking at USO, a crude oil tracker, our 10-day prediction model shows mixed signals. The fund is trading at $28.96 at the time of publication. Prediction data is uploaded after the market close at 6 p.m., CST. Today’s data is based on market signals from the previous trading session.

Gold
The price for the Gold Continuous Contract (GC00) is up 0.22% at $1,794.00 at the time of publication.
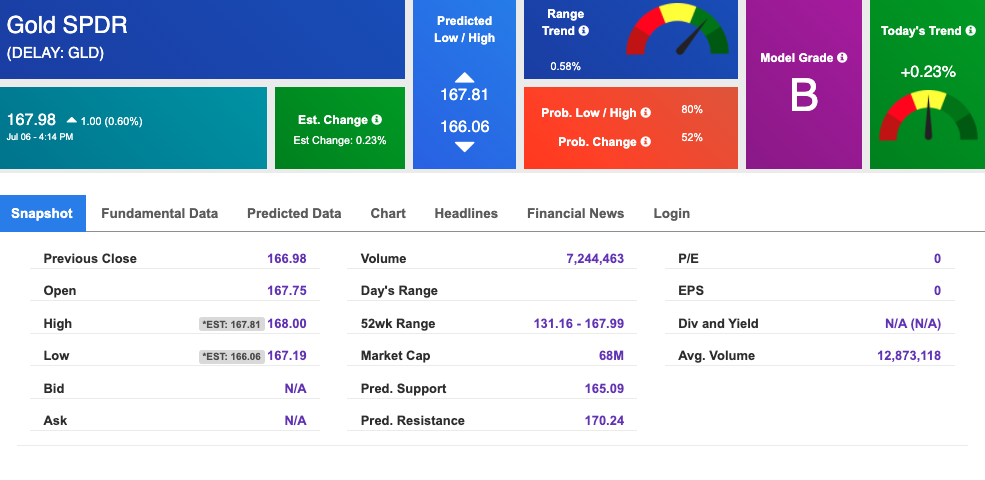
Using SPDR GOLD TRUST (GLD) as a tracker in our Stock Forecast Tool, the 10-day prediction window shows mixed signals. The gold proxy is trading at $167.98, at the time of publication. Vector signals show +0.23% for today. Prediction data is uploaded after the market close at 6 p.m., CST. Today’s data is based on market signals from the previous trading session.
Treasuries
The yield on the 10-year Treasury note is up, at 0.679% at the time of publication.
The yield on the 30-year Treasury note is up, at 1.441% at the time of publication.
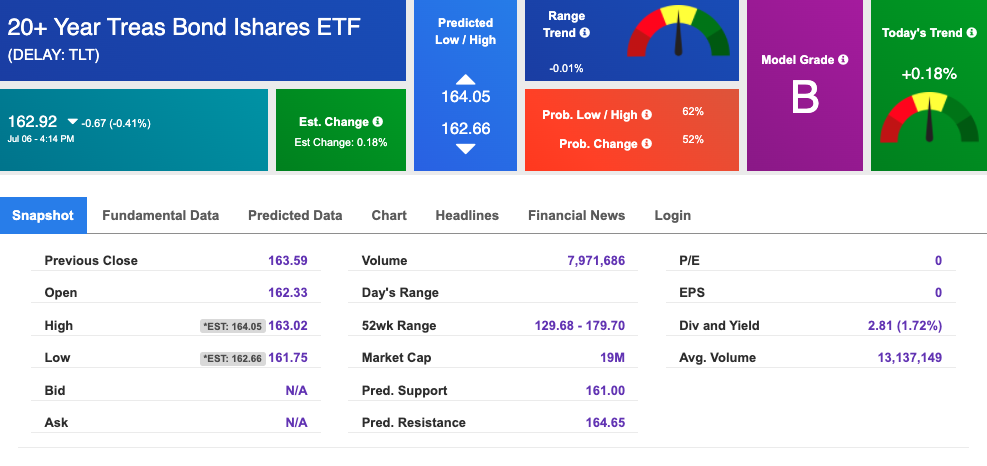
Using the iShares 20+ Year Treasury Bond ETF (TLT) as a proxy for bond prices in our Stock Forecast Tool, we see mixed signals in our 10-day prediction window. Prediction data is uploaded after the market close at 6 p.m., CST. Today’s data is based on market signals from the previous trading session.
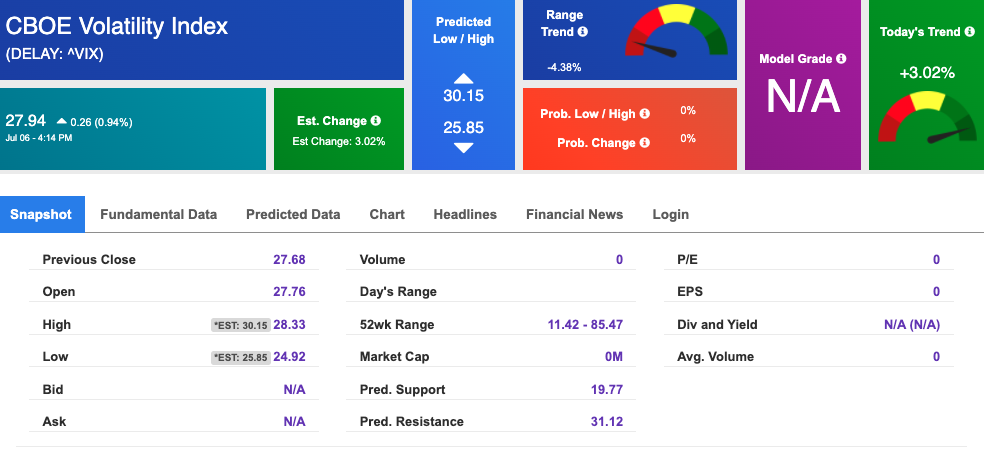
Volatility
The CBOE Volatility Index (^VIX) is $27.94 at the time of publication, and our 10-day prediction window shows mixed signals. Prediction data is uploaded after the market close at 6 p.m., CST. Today’s data is based on market signals from the previous trading session.