

March Retail Sales Down 8%, Corporate Earnings Underwhelm Leading Markets Lower
Concern regarding the continued impact of the virus mounts
Markets are seeing a sharp decline following two straight sessions of trading higher as global COVID cases top 2 million. Weaker than expected economic data and corporate earnings are also adding pressure as concern regarding the continued impact of the virus mounts.
Earnings season kicked off this week with major banks
Corporate earnings season kicked off this week with major banks as usual; Citigroup, Bank of America, Goldman Sachs reported today while JPMorgan Chase and Wells Fargo reported yesterday. Additional reports to monitor include today’s Beige Book release as well as earnings from UnitedHealth, Progressive, and Bed Bath & Beyond. Oil prices are seeing further pressure as the latest forecast from the IEA sees a record decline in demand.
(Want free training resources? Check our our training section for videos and tips!)
Long-term investors can consider buying equities with dollar-cost averaging in mind
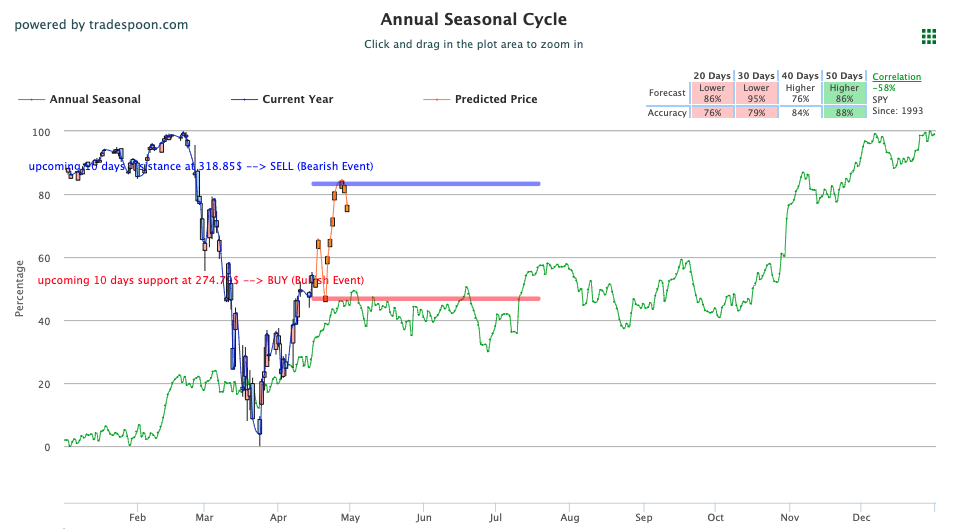
The latest swing in prices reaffirms our notion that the market is susceptible to a 10-20% selloff and investors should consider hedging portfolios into the rallies. At this point, we do not think the market will retest recent lows and could realistically reach 50% retracement on SPY $250-$260 level. Our opinion remains: the market is overbought in the short term and long-term investors can consider buying equities with dollar-cost averaging in mind. Market Commentary readers are encouraged to maintain clearly defined stop-levels for all positions. For reference, the SPY Seasonal Chart is shown below:
Weaker than expected economic data drag indexes down
The latest data has global COVID cases topping 2 million while U.S. death currently shows over 27,000 deaths, with 47,000 recoveries out 620,000 cases. All three major U.S. indices traded lower today as impact from the virus continues to be illuminated through the latest economic reports and corporate earnings. March retail sales were down over 8% while the U.S. Beige Book showed significant drop off in all twelve federal districts. Industrial production was down 5.4% in March.
U.S. Airlines, energy and materials sector under big pressure
U.S. Airlines were able to reach an agreement with the Treasury for grant and loan bailouts as the industry has been significantly hit. Also seeing pressure is the energy and materials sector. The latest news from OPEC initially softened pressure on crude prices but the latest data from the IEA shows a significant dropoff in demand in the upcoming months which once more sent prices lower. Globally, both Asian and European markets traded lower. Gold saw another day in the red while the dollar made slight gains. U.S. Treasury Yields modestly lowered as well.
Several stocks booked impressive gains today:
- UAL +2%, AAL +2% Major Airlines American and United saw shares higher following yesterday’s Treasury bailout
- UNH +3% UnitedHealth Group saw share higher following their earnings report this morning
Key U.S. Economic Reports Out This Week
- Weekly Jobless Claims (4/11) – Thursday
- Housing Starts (March) – Thursday
- Lead Economic Indicators (March) – Friday
Key Corporate Earnings Out This Week
- GS – Goldman Sachs – Wednesday, April 15th
- BAC – Bank of America – Wednesday, April 15th
- C – Citigroup – Wednesday, April 15th
- GS – Goldman Sachs – Wednesday, April 15th
- ABT – Abbott Laboratories – Thursday, April 16th
- HON – Honeywell International – Thursday, April 16th
(Want free training resources? Check our our training section for videos and tips!)
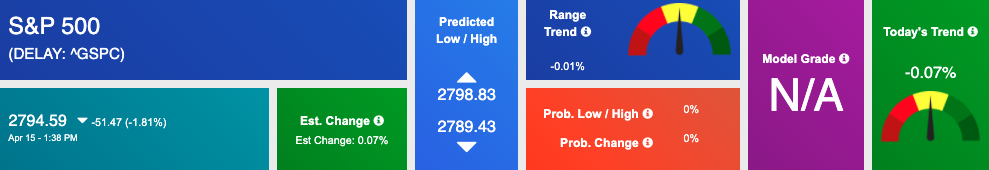
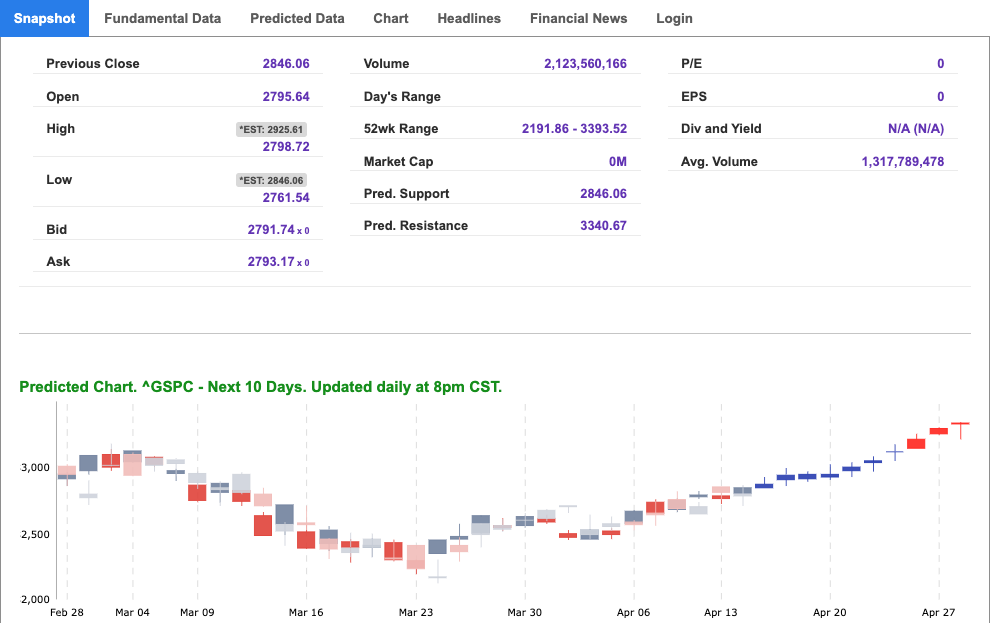
Using the “^GSPC” symbol to analyze the S&P 500 our 10-day prediction window shows a near-term mixed outlook. Prediction data is uploaded after the market closes at 6 p.m. CST. Today’s data is based on market signals from the previous trading session.
(Want free training resources? Check our our training section for videos and tips!)
Vlad’s Portfolio Lifetime Membership!
DO AS I DO… AS I DO IT WATCH LIVE AS I WORK THE MARKETS! TRY IT NOW RISK-FREE!
Click Here to Sign Up
Highlight of a Recent Winning Trade
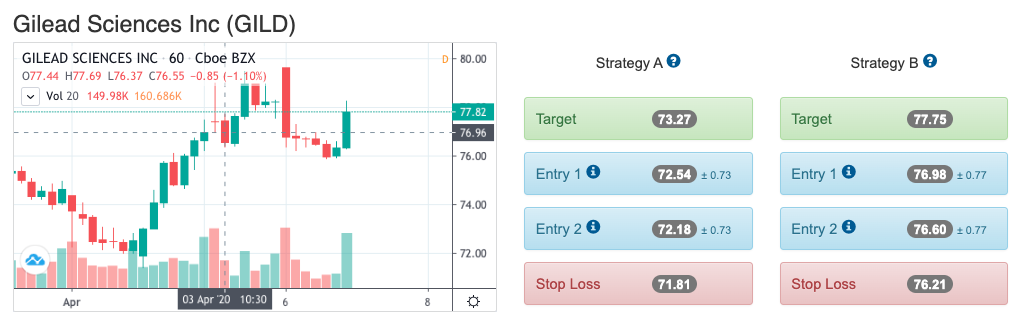
On April 3rd, our ActiveTrader service produced a bullish recommendation for Gilead Sciences Inc (GILD). ActiveTrader is included in several Tradespoon membership plans and is designed for day trading, with signals meant to last for 1-2 days.
Trade Breakdown
GILD entered its forecasted Strategy B Entry 1 price range $76.98(± 0.77) in the second hour of trading that day and passed through its Target price of $77.75 in the fourth hour of trading that day. The Stop Loss price was set at $76.21.
(Want free training resources? Check our our training section for videos and tips!)
Thursday Morning Featured Symbol
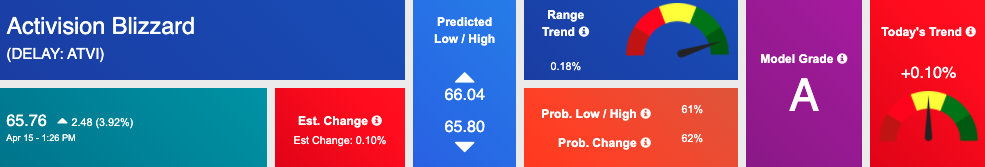
Our featured symbol for Thursday is Activision Blizzard (ATVI). ATVI is showing a steady vector in our Stock Forecast Toolbox’s 10-day forecast. This stock is assigned a Model Grade of (A) indicating it ranks in the top 10th percentile for accuracy for current-day predicted support and resistance, relative to our entire data universe.
(Want free training resources? Check our our training section for videos and tips!)
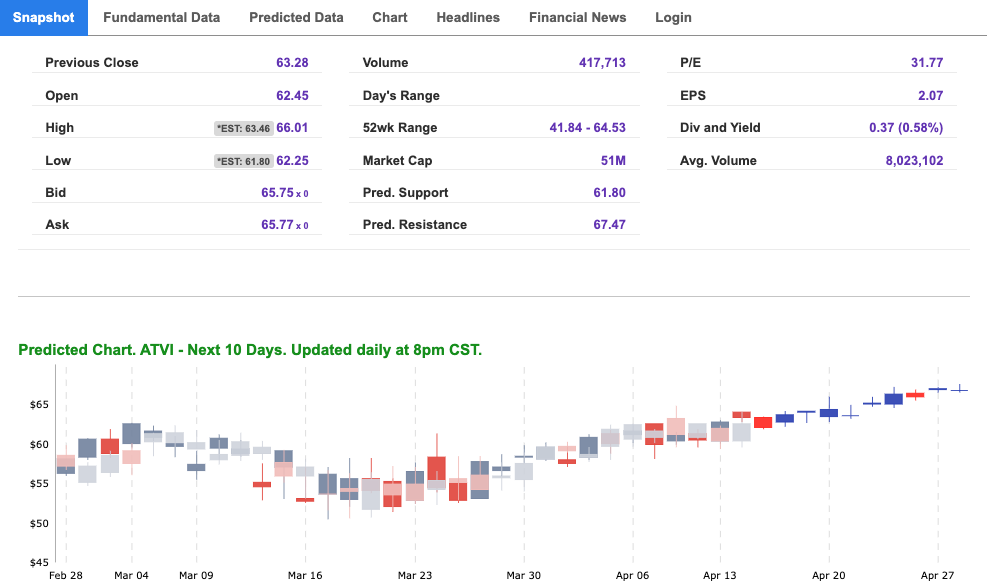
The stock is trading at $65.76, with a vector of -0.10% at the time of publication.
Prediction data is uploaded after the market close at 6 p.m., CST. Today’s data is based on market signals from the previous trading session.
(Want free training resources? Check our our training section for videos and tips!)
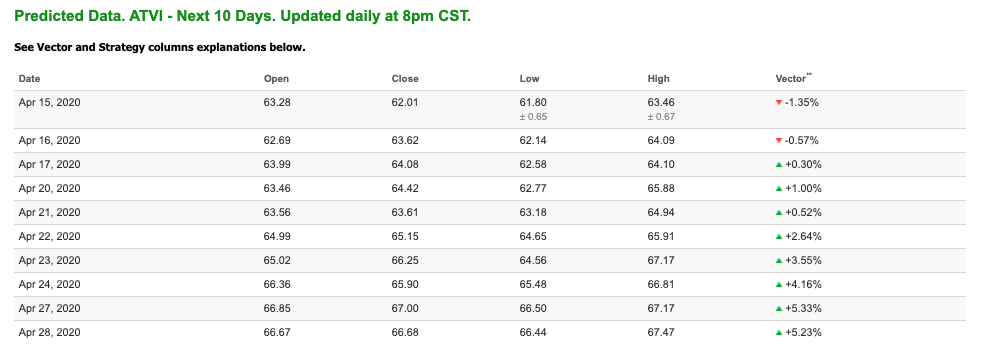
Note: The Vector column calculates the change of the Forecasted Average Price for the next trading session relative to the average of actual prices for the last trading session. The column shows the expected average price movement “Up or Down”, in percent. Trend traders should trade along the predicted direction of the Vector. The higher the value of the Vector the higher its momentum.
*Please note: At the time of publication Vlad Karpel does not have a position in the featured symbol, ATVI. Our featured symbol is part of your free subscription service. It is not included in any paid Tradespoon subscription service. Vlad Karpel only trades his own personal money in paid subscription services. If you are a paid subscriber, please review your Premium Member Picks, ActiveTrader or MonthlyTrader recommendations. If you are interested in receiving Vlad’s personal picks, please click here.
Oil
West Texas Intermediate for Crude Oil delivery (CL.1) is priced at $20.10 per barrel, down 0.05% from the open, at the time of publication.
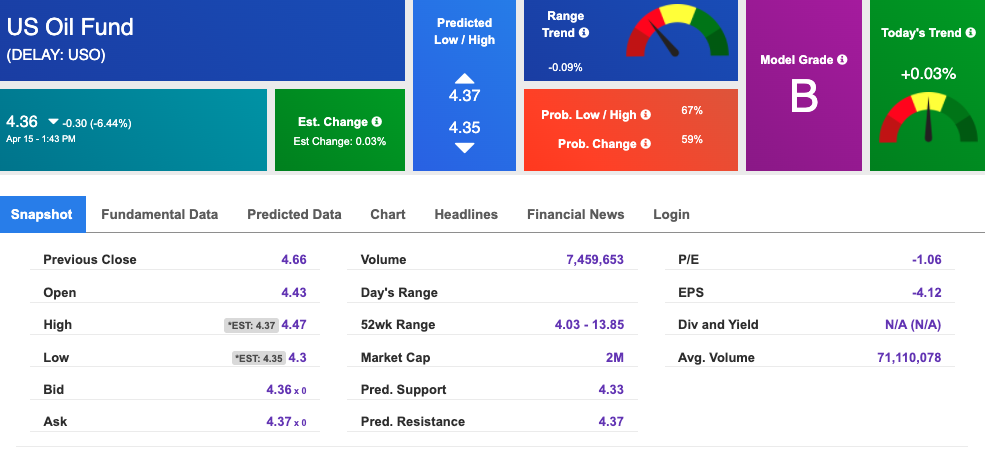
Looking at USO, a crude oil tracker, our 10-day prediction model shows mixed signals. The fund is trading at $4.36 at the time of publication. Prediction data is uploaded after the market close at 6 p.m., CST. Today’s data is based on market signals from the previous trading session.
(Want free training resources? Check our our training section for videos and tips!)
Gold
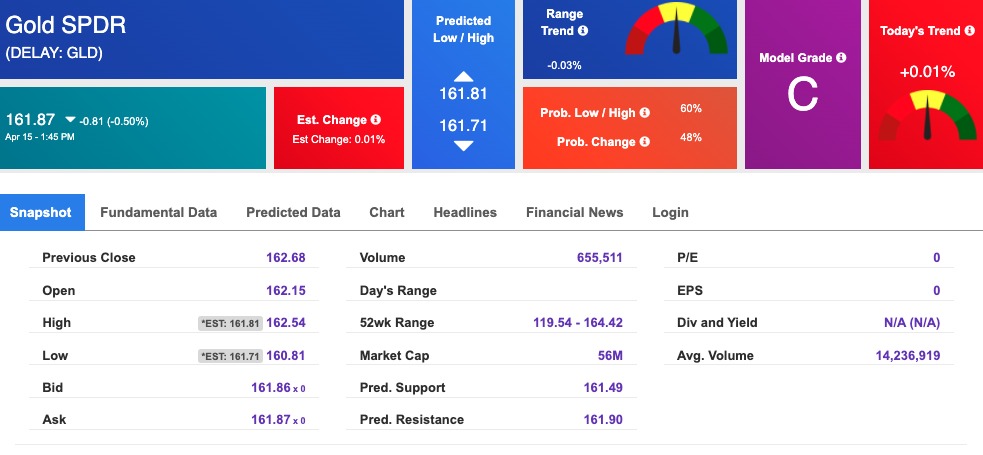
The price for the Gold Continuous Contract (GC00) is down 1.26% at $1,746.50 at the time of publication.
Using SPDR GOLD TRUST (GLD) as a tracker in our Stock Forecast Tool, the 10-day prediction window shows mixed signals. The gold proxy is trading at $161.87, at the time of publication. Vector signals show +0.01% for today. Prediction data is uploaded after the market close at 6 p.m., CST. Today’s data is based on market signals from the previous trading session.
(Want free training resources? Check our our training section for videos and tips!)
Treasuries
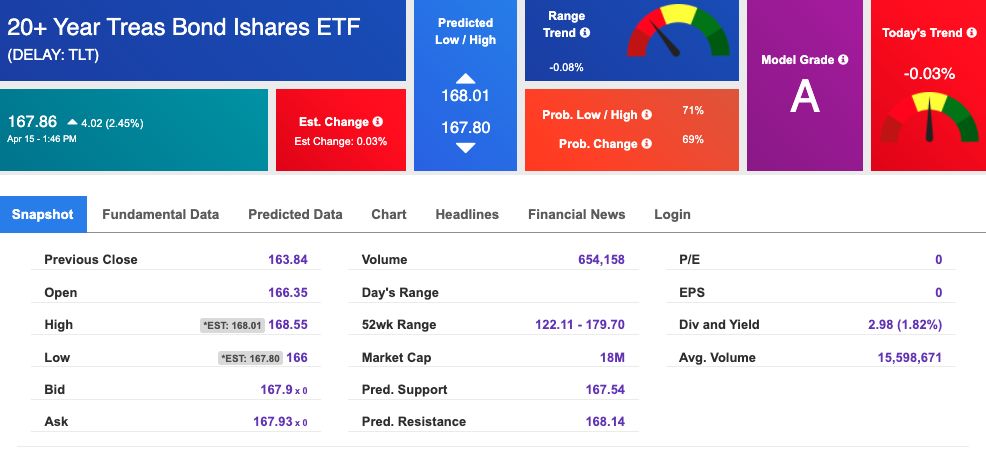
The yield on the 10-year Treasury note is down to 0.64% at the time of publication.
The yield on the 30-year Treasury note is down to 1.273% at the time of publication.
Using the iShares 20+ Year Treasury Bond ETF (TLT) as a proxy for bond prices in our Stock Forecast Tool, we see negative signals in our 10-day prediction window. Prediction data is uploaded after the market close at 6 p.m., CST. Today’s data is based on market signals from the previous trading session.
(Want free training resources? Check our our training section for videos and tips!)
Volatility
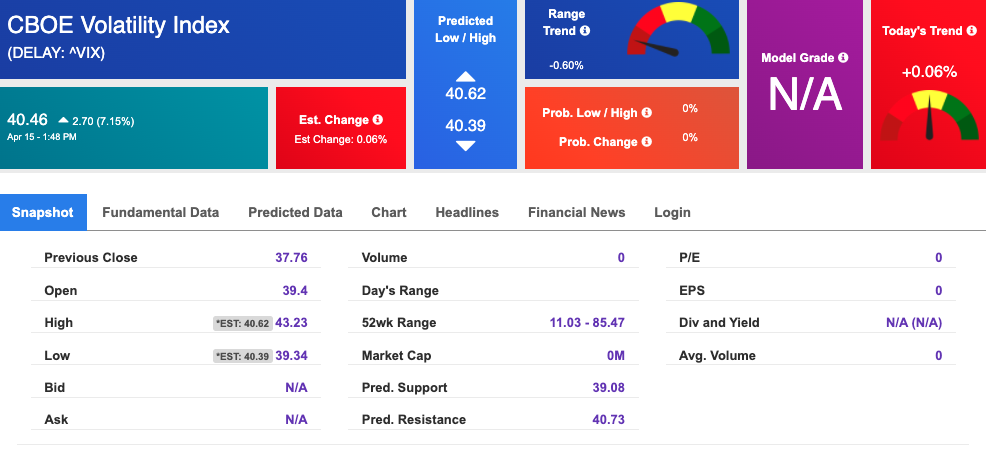
The CBOE Volatility Index (^VIX) is $40.46 at the time of publication, and our 10-day prediction window shows mixed signals. Prediction data is uploaded after the market close at 6 p.m., CST. Today’s data is based on market signals from the previous trading session.
(Want free training resources? Check our our training section for videos and tips!)
Vlad’s Portfolio Lifetime Membership!
DO AS I DO… AS I DO IT WATCH LIVE AS I WORK THE MARKETS! TRY IT NOW RISK-FREE!
Click Here to Sign Up
(Want free training resources? Check our our training section for videos and tips!)