Market Opens Week to Mixed Results, Tech and Healthcare Continue Leading All Sectors
SPY will trade between $270-$295 level in the next 2-3 weeks
Based on our models, the SPY will trade between $270-$295 level in the next 2-3 weeks. Several sectors have already broken through their recent overhead resistance levels, eliminating the potential for the market to retest $260 SPY level, in our opinion. We will be a buyer into any short term corrections but will continue monitoring the VIX. The market can overshoot support and resistance levels when VIX is trading near $30 level.
Indices opened to mixed results this week
After trading higher for most of last week, indices opened to mixed results this week with the Nasdaq and S&P in the green, while the Dow is trading lower. Oil and gold are also seeing some pressure, both currently down, while global markets remain mixed.
Several key economic reports are due this week
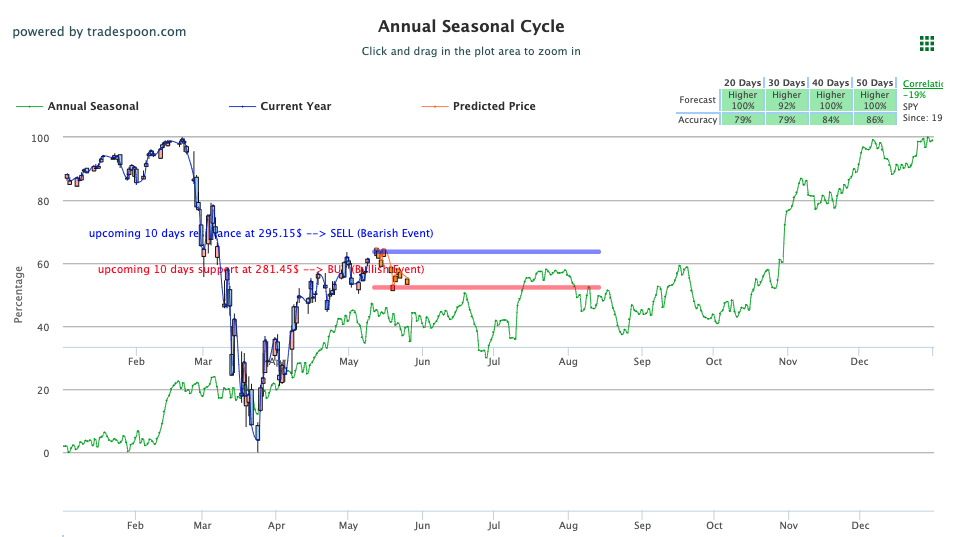
Several key economic reports are due this week including April Core CPI, Federal Budget, and Retail Sales while earnings in focus feature Applied Materials, Cisco Systems, Cardinal Health, Duke Energy, as well as auto-makers Honda and Toyota. Bond yields are inching higher today while the dollar is modestly up. In the short term, we still believe the market is overbought; long-term investors can consider buying equities with dollar-cost averaging in mind. Investors should continue considering hedging portfolios into the rallies. Market Commentary readers are always encouraged to maintain clearly defined stop-levels for all positions. For reference, the SPY Seasonal Chart is shown below:

Key U.S. Economic Reports Out This Week:
- Core CPI (April) – Tuesday
- Federal Budget (April) – Tuesday
- Consumer Price Index (April) – Tuesday
- Fed Chair Powell Press Conference – Wednesday
- Producer Price Index (April) -Wednesday
- Weekly Jobless Claims (5/9) – Thursday
- Import Price Index (April) – Thursday
- Retail Sales (April) – Friday
- Industrial Production (April) – Friday
- Job Openings (March) – Friday
- Business Inventories (March) – Friday
Key Corporate Earnings Out This Week:
- DUK – Duke Energy – Tuesday, May 12th
- HMC – Honda Motor – Tuesday, May 12th
- TM – Toyota Motor – Tuesday, May 12th
- CSCO – Cisco Systems – Wednesday, May 13th
- TCEHY – Tencent – Wednesday, May 13th
- AMAT – Applied Materials – Thursday, May 14th
- ACB – Aurora Cannabis – Thursday, May 14th
- JD – JD.com – Friday, May 15th
- PBF – PBF Energy – Friday, May 15th
- VFC – VF Corp. – Friday, May 15th
(Want free training resources? Check our our training section for videos and tips!)
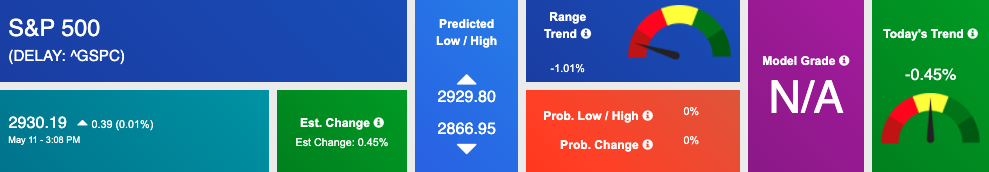
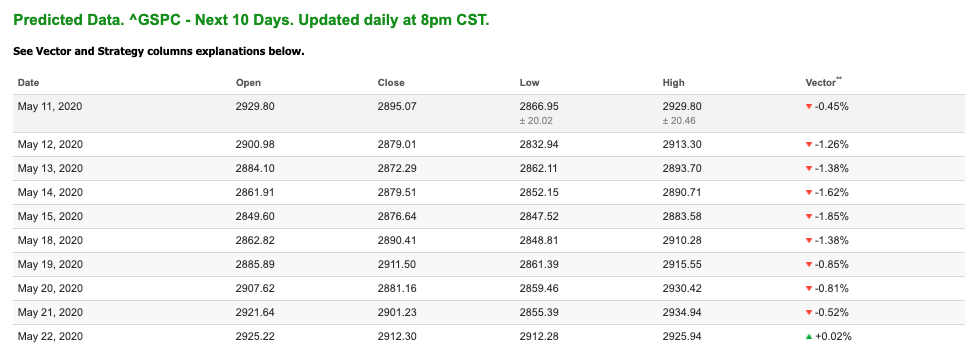
Using the “^GSPC” symbol to analyze the S&P 500 our 10-day prediction window shows a near-term mixed outlook. Prediction data is uploaded after the market closes at 6 p.m. CST. Today’s data is based on market signals from the previous trading session.
ROBOINVESTOR SPECIAL:
Breakthrough, mind-boggling, high-tech Artificial Intelligence platform available to Tradespoon’s individual investors:
Click Here – To See Where AI Places My Money
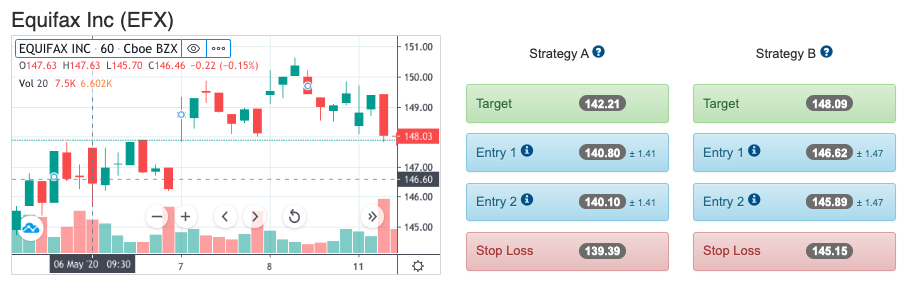
Highlight of a Winning Trade
On May 6th, our ActiveTrader service produced a bullish recommendation for Equifax Inc (EFX). ActiveTrader is included in several Tradespoon membership plans and is designed for day trading, with signals meant to last for 1-2 days.
Trade Breakdown
EFX entered its forecasted Strategy B Entry 1 price range $146.62(± 1.47) in the first hour of trading that day and passed through its Target price of $148.09 in the first hour of trading the following day. The Stop Loss price was set at $145.15.
Tuesday Morning Featured Symbol
Our featured symbol for Tuesday is Cisco Systems(CSCO). CSCO is showing a steady vector in our Stock Forecast Toolbox’s 10-day forecast. This stock is assigned a Model Grade of (B) indicating it ranks in the top 25th percentile for accuracy for current-day predicted support and resistance, relative to our entire data universe.
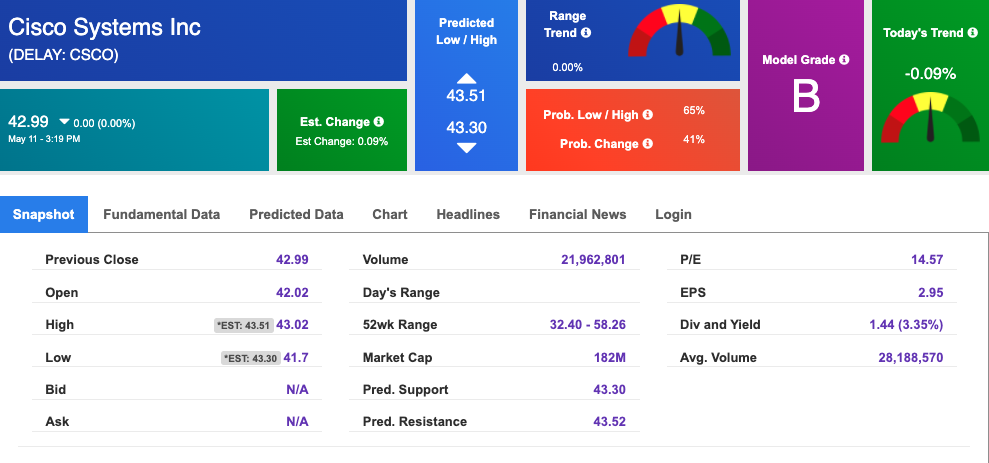
The stock is trading at $42.99, with a vector of 0.09% at the time of publication.
Prediction data is uploaded after the market close at 6 p.m., CST. Today’s data is based on market signals from the previous trading session.
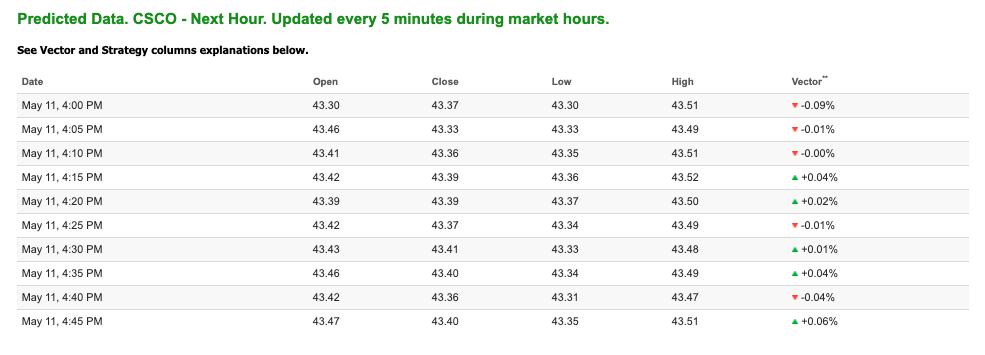
Note: The Vector column calculates the change of the Forecasted Average Price for the next trading session relative to the average of actual prices for the last trading session. The column shows the expected average price movement “Up or Down”, in percent. Trend traders should trade along the predicted direction of the Vector. The higher the value of the Vector the higher its momentum.
*Please note: At the time of publication Vlad Karpel does not have a position in the featured symbol, CSCO. Our featured symbol is part of your free subscription service. It is not included in any paid Tradespoon subscription service. Vlad Karpel only trades his own personal money in paid subscription services. If you are a paid subscriber, please review your Premium Member Picks, ActiveTrader, or MonthlyTrader recommendations. If you are interested in receiving Vlad’s personal picks, please click here.
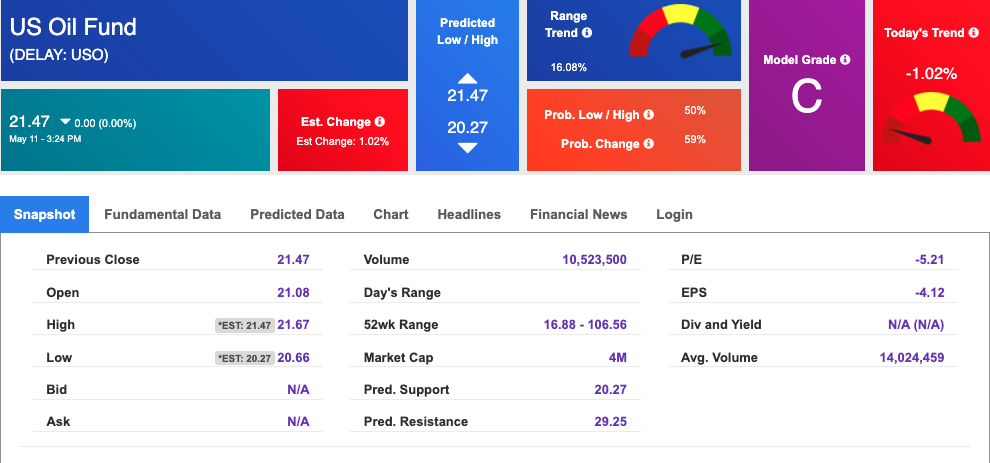
Oil
West Texas Intermediate for Crude Oil delivery (CL.1) is priced at $24.62 per barrel, down 0.49% from the open, at the time of publication.
Looking at USO, a crude oil tracker, our 10-day prediction model shows mixed signals. The fund is trading at $21.47 at the time of publication. Prediction data is uploaded after the market close at 6 p.m., CST. Today’s data is based on market signals from the previous trading session.
Gold
The price for the Gold Continuous Contract (GC00) is down 0.77% at $1,700.60 at the time of publication.
Using SPDR GOLD TRUST (GLD) as a tracker in our Stock Forecast Tool, the 10-day prediction window shows mixed signals. The gold proxy is trading at $160.42, at the time of publication. Vector signals show -0.46% for today. Prediction data is uploaded after the market close at 6 p.m., CST. Today’s data is based on market signals from the previous trading session.

Treasuries
The yield on the 10-year Treasury note is up, at 0.701% at the time of publication.
The yield on the 30-year Treasury note is up, at 1.418% at the time of publication.
Using the iShares 20+ Year Treasury Bond ETF (TLT) as a proxy for bond prices in our Stock Forecast Tool, we see mixed signals in our 10-day prediction window. Prediction data is uploaded after the market close at 6 p.m., CST. Today’s data is based on market signals from the previous trading session.

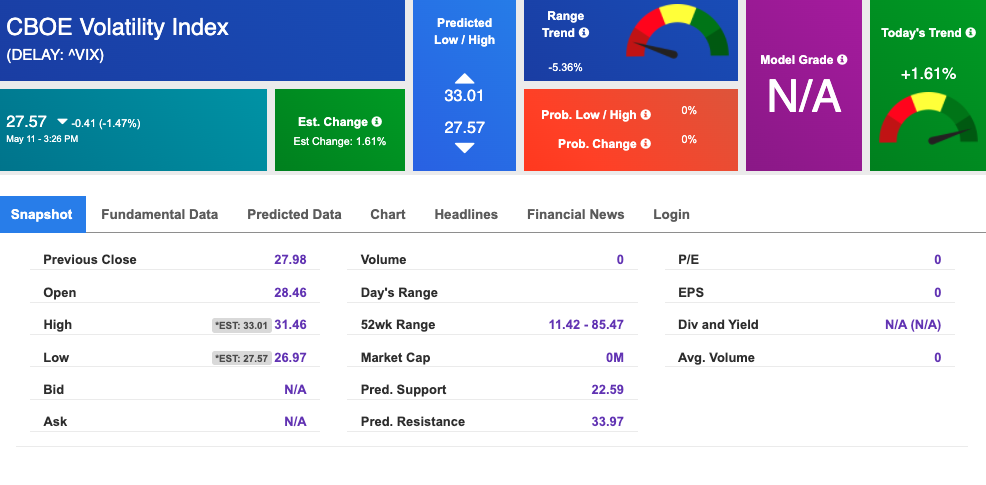
Volatility
The CBOE Volatility Index (^VIX) is $27.57 at the time of publication, and our 10-day prediction window shows negative signals. Prediction data is uploaded after the market close at 6 p.m., CST. Today’s data is based on market signals from the previous trading session.