Markets Move Higher, Impeachment and Global Trade Remain Focal
Impeachment and global trade concerns currently dictating markets
On the last trading day of the third quarter, markets moved higher with all three major indices on track to close in the green. Impeachment and global trade concerns are the main factors currently dictating markets while tension in the Middle East continues to impact oil. The next meeting between China and the U.S. is set for October 10-11 and will feature Chinese Vice Premier Liu He in Washington.
(Want free training resources? Check our our training section for videos and tips!)
Buy when SPY is near $282, sell near $300
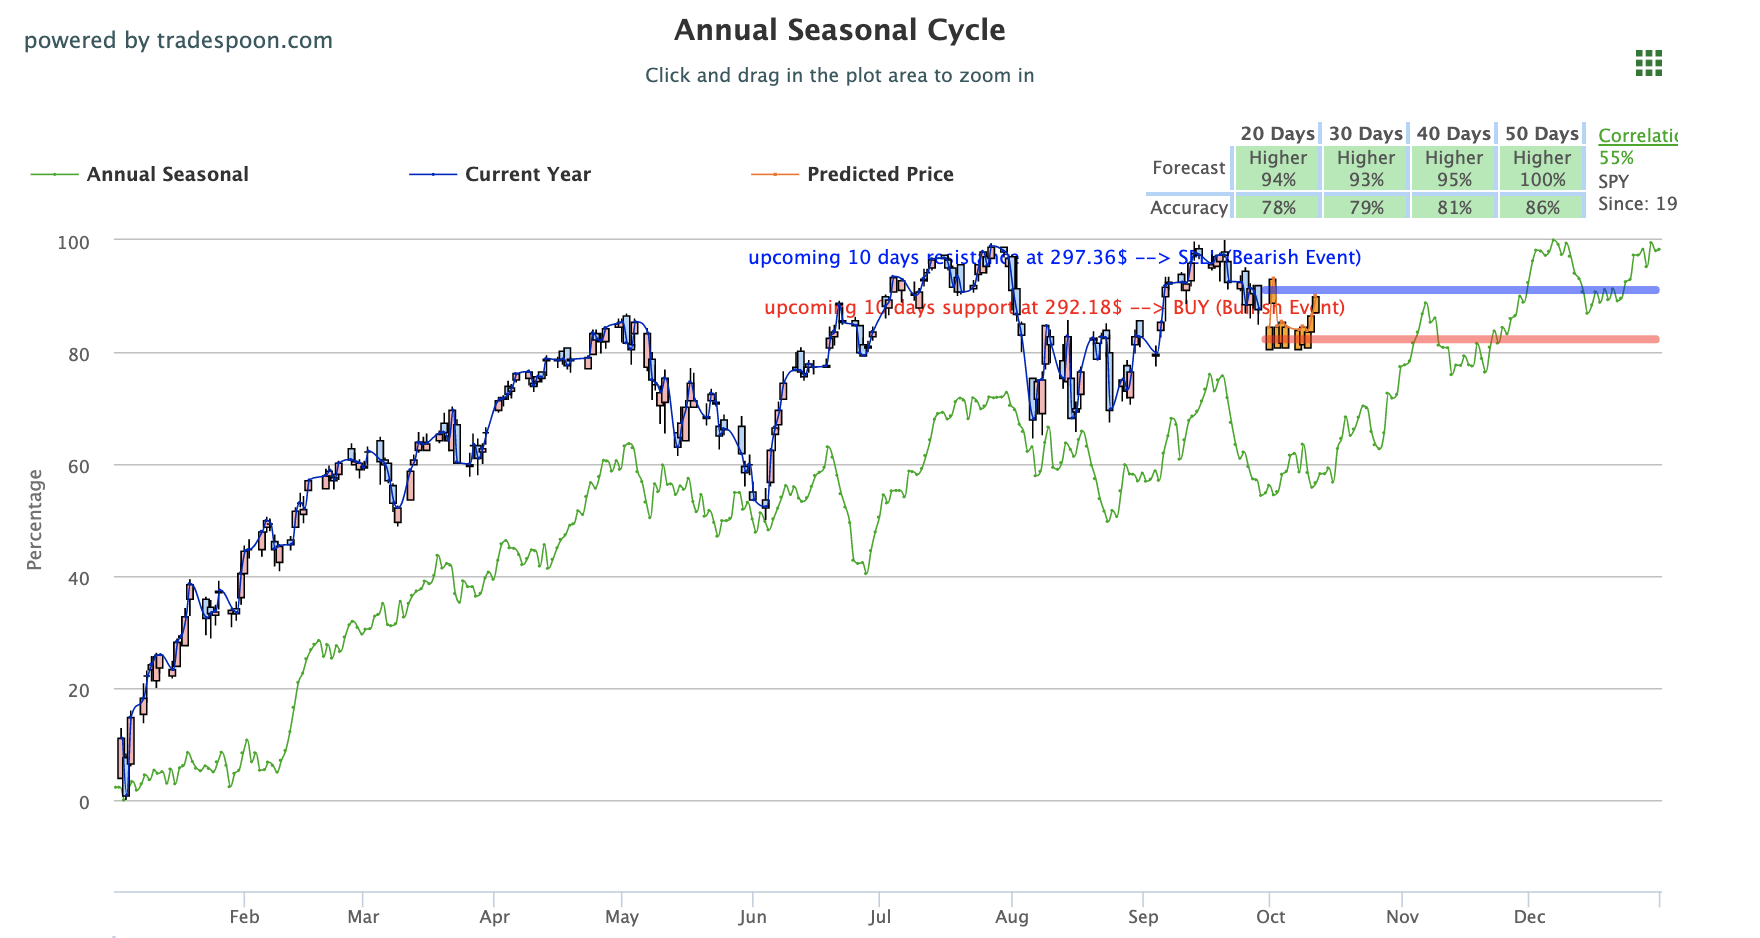
Currently, the SPY is trading between $294-302. With this in mind, we believe the market is range-bound and we do not see the potential for the market to overshoot all-time high of $302. Short-term support remains near $295 and we will look to buy when SPY is near $282, sell near $300. Readers of Market Commentary are encouraged to maintain clearly defined stop levels for all positions. For reference, the SPY Seasonal Chart is shown below:

All three major U.S. indices closed in the green
All three major U.S. indices closed in the green following an up and down week due to major political and financial news. First, the formal impeachment bid for President Trump made its way to D.C. with testimony beginning. A conversation with Ukranian President is in question and continue to be inspected in the upcoming testimonies. Official transcript of the call, as well as the complaint from the whistleblower, has been released. According to the House Intelligence Committee, the whistleblower is set to testify soon.
Globally, Asian and European markets closed to mixed results with China and the U.K. noticeably lower. Last week, reports that the U.S. Treasury was looking at blocking Chinese companies from the U.S. made rounds only to be dispelled over the weekend. The reports stated White House officials were looking into ways to curb U.S. business with Chinese companies. While the initial report sent certain tangible stocks lower, those losses have since been recouped. In the coming weeks, U.S. and China trade representatives are set to meet in D.C. to continue trade and tariff negotiations. Earnings and economic reports remain light for the U.S. this week, with key employment data released later this week.
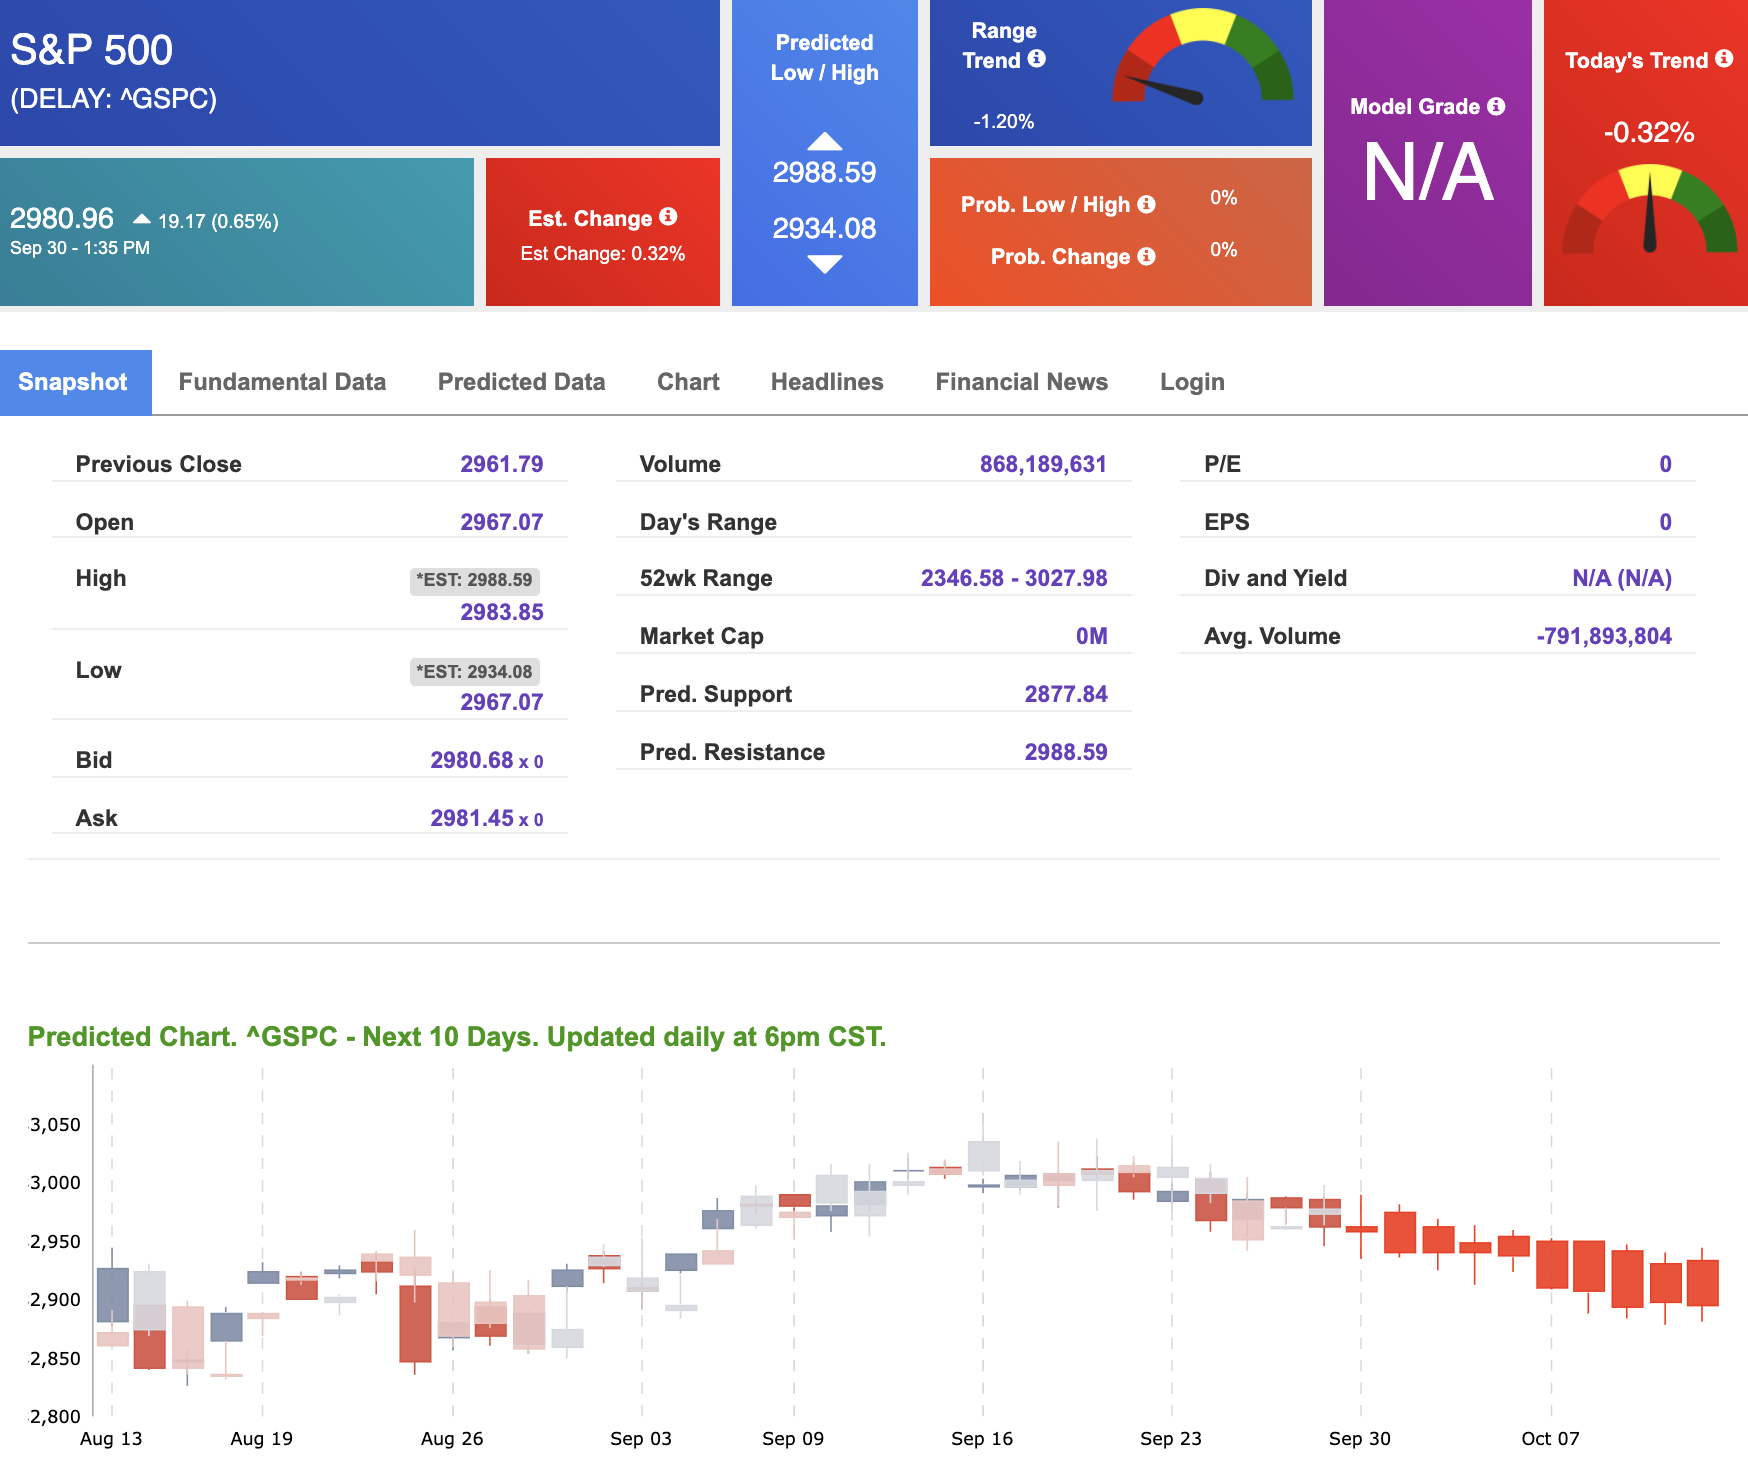
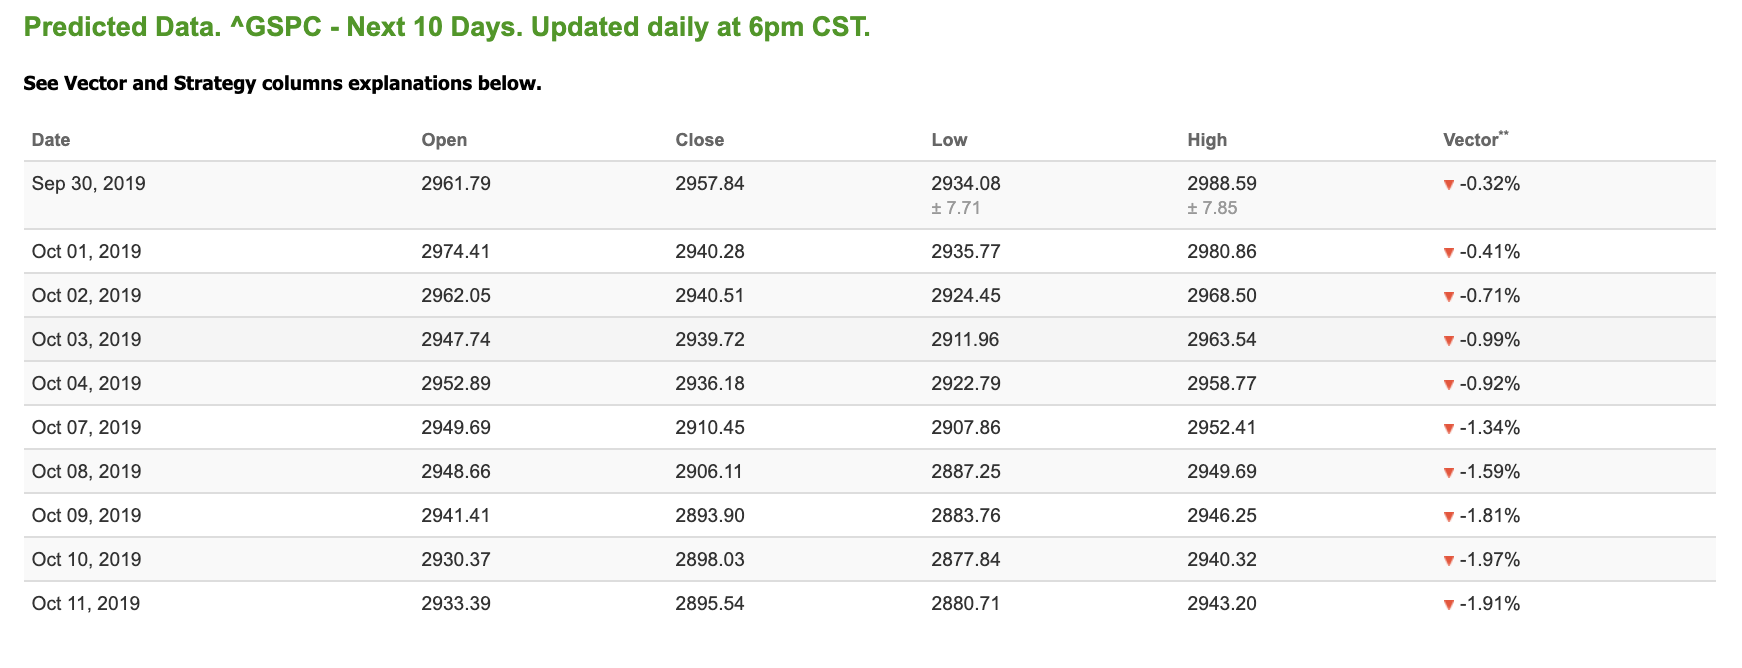
Using the “^GSPC” symbol to analyze the S&P 500 our 10-day prediction window shows negative signals. Today’s vector figure of -0.32% moves to -1.34% in five trading sessions. Prediction data is uploaded after the market close at 6 p.m. CST. Today’s data is based on market signals from the previous trading session.
Want a more manageable portfolio with fewer trades and more profits
How often do you sign up for an investment advisory and find dozens, or hundreds, of open trades in their portfolio?
It’s almost as though the guru is trying to cover all his bases by recommending every potential stock that could go up.
As an investor, it’s overwhelming: what do you focus on?
With Vlad’s system, you never have to worry about more than a handful of stocks at one time. It’s a focused approach to trading, and that means you can spend more of your brain energy on other activities without sacrificing profitability.
And there’s a unique advantage Vlad’s system has that is a must-have in this day and age…
That winning percentage doesn’t budge…
even during volatile times
CLICK HERE TO LEARN MORE
Highlight of a Recent Winning Trade
On September 27th, our ActiveTrader service produced a bullish recommendation for Nike Inc (NKE). ActiveTrader is included in all paid Tradespoon membership plans and is designed for day trading.
Trade Breakdown
NKE entered its forecasted Strategy B Entry 1 price range $92.17 (± 0.50) in its first hour of trading and passed through its Target price $93.09 in the first hour of trading the following trading day. The Stop Loss price was set at $91.25.

Tuesday Morning Featured Symbol
*Please note: At the time of publication we do not own the featured symbol, NKE. Our featured symbol is part of your free subscription service. It is not included in any paid Tradespoon subscription service. Vlad Karpel only trades his own personal money in paid subscription services. If you are a paid subscriber, please review your Premium Member Picks, ActiveTrader or MonthlyTrader recommendations. If you are interested in receiving Vlad’s personal picks, please click here.
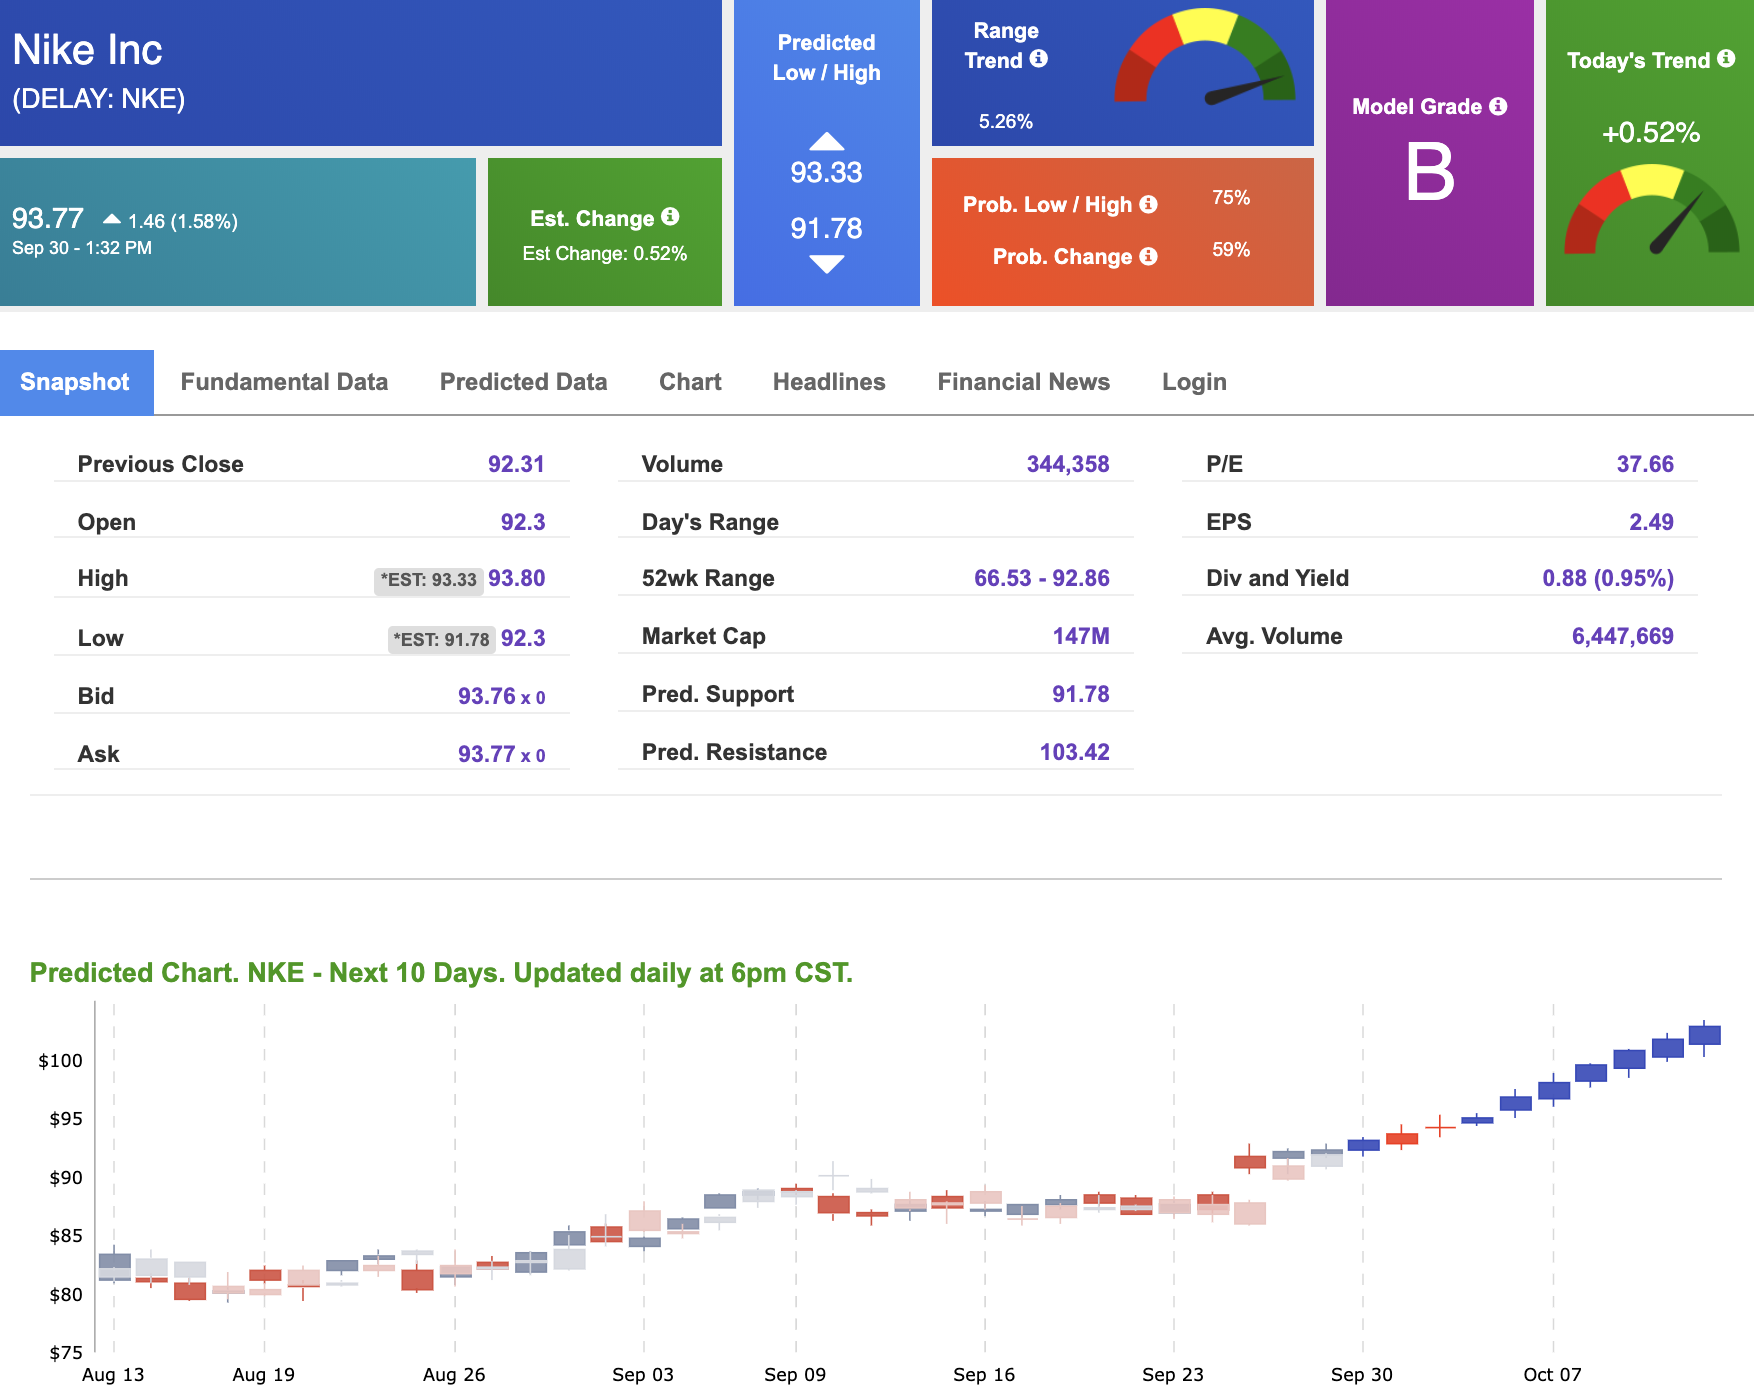
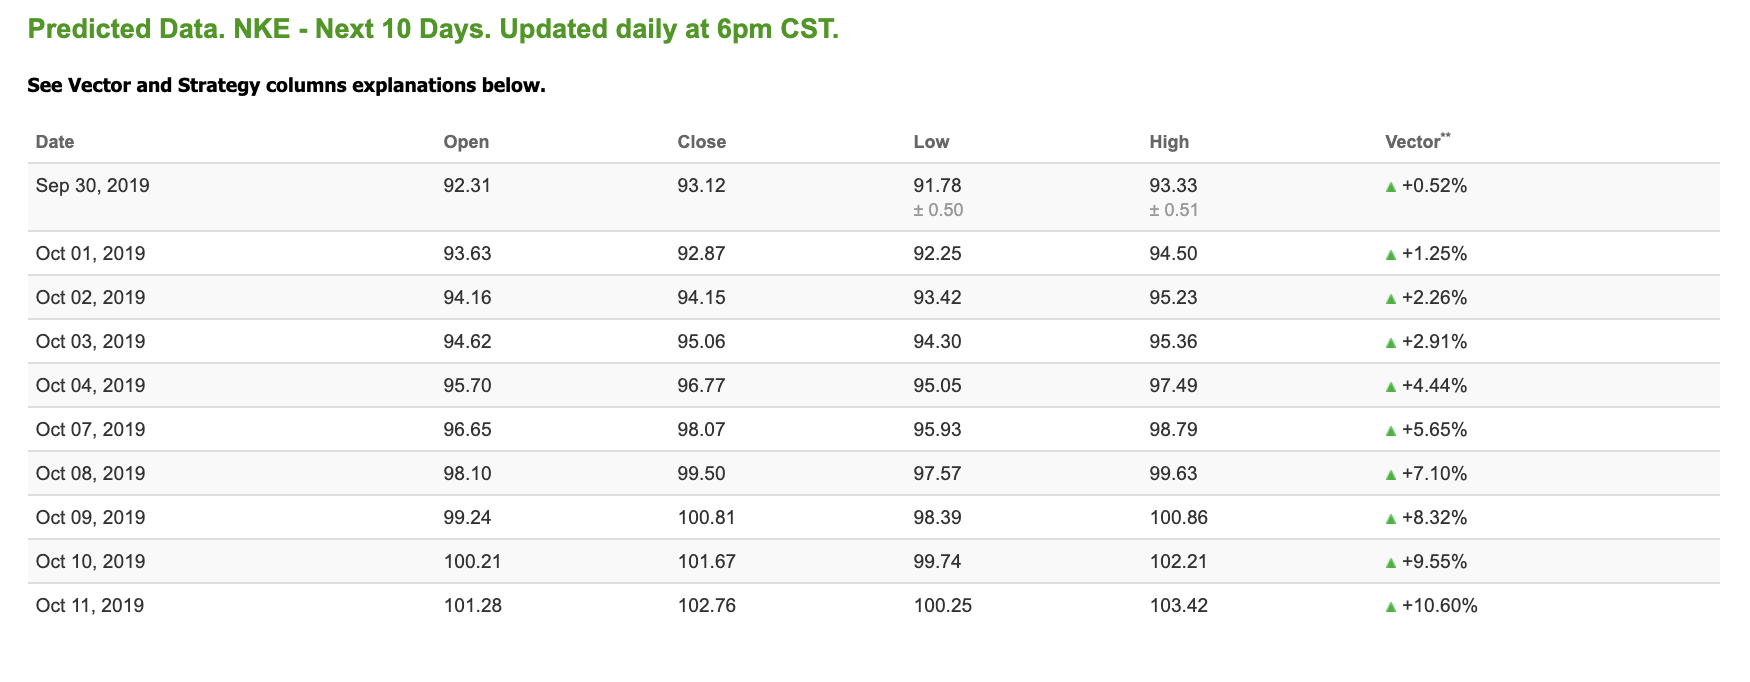
Our featured symbol for Tuesday is Nike Inc (NKE). NKE is showing a confident vector trend in our Stock Forecast Toolbox’s 10-day forecast. This stock is assigned a Model Grade of (B) indicating it ranks in the top 25th percentile for accuracy for predicted support and resistance, relative to our entire data universe.
The stock is trading at $93.77 at the time of publication, up 1.58% from the open with a +0.52% vector figure.
Prediction data is uploaded after market close at 6 p.m., CST. Today’s data is based on market signals from the previous trading session.
Note: The Vector column calculates the change of the Forecasted Average Price for the next trading session relative to the average of actual prices for the last trading session. The column shows expected average price movement “Up or Down”, in percent. Trend traders should trade along the predicted direction of the Vector. The higher the value of the Vector the higher its momentum.
Oil
West Texas Intermediate for Crude Oil delivery (CL.1) is priced at $54.08 per barrel, down 3.27% from the open, at the time of publication.
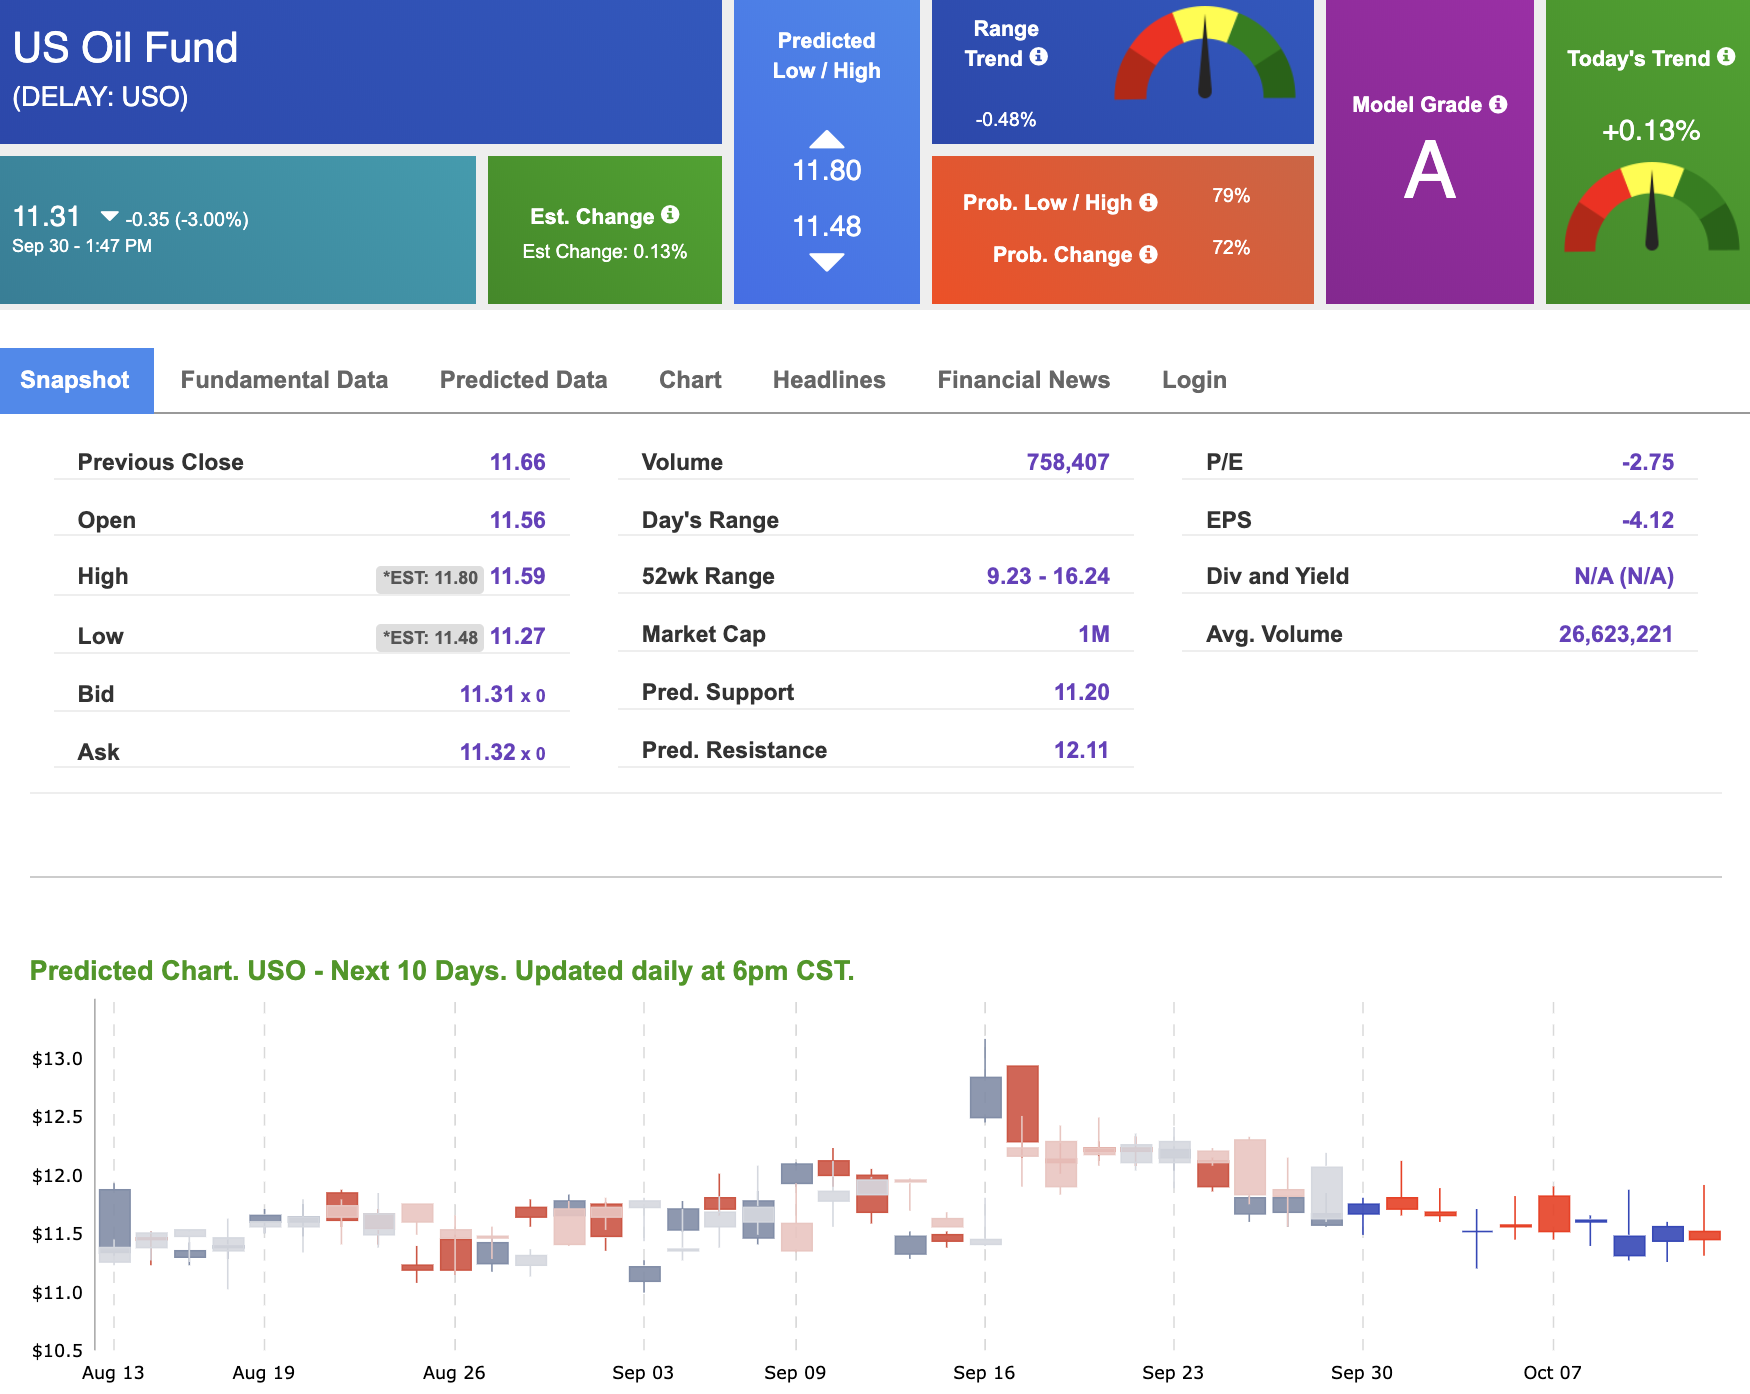
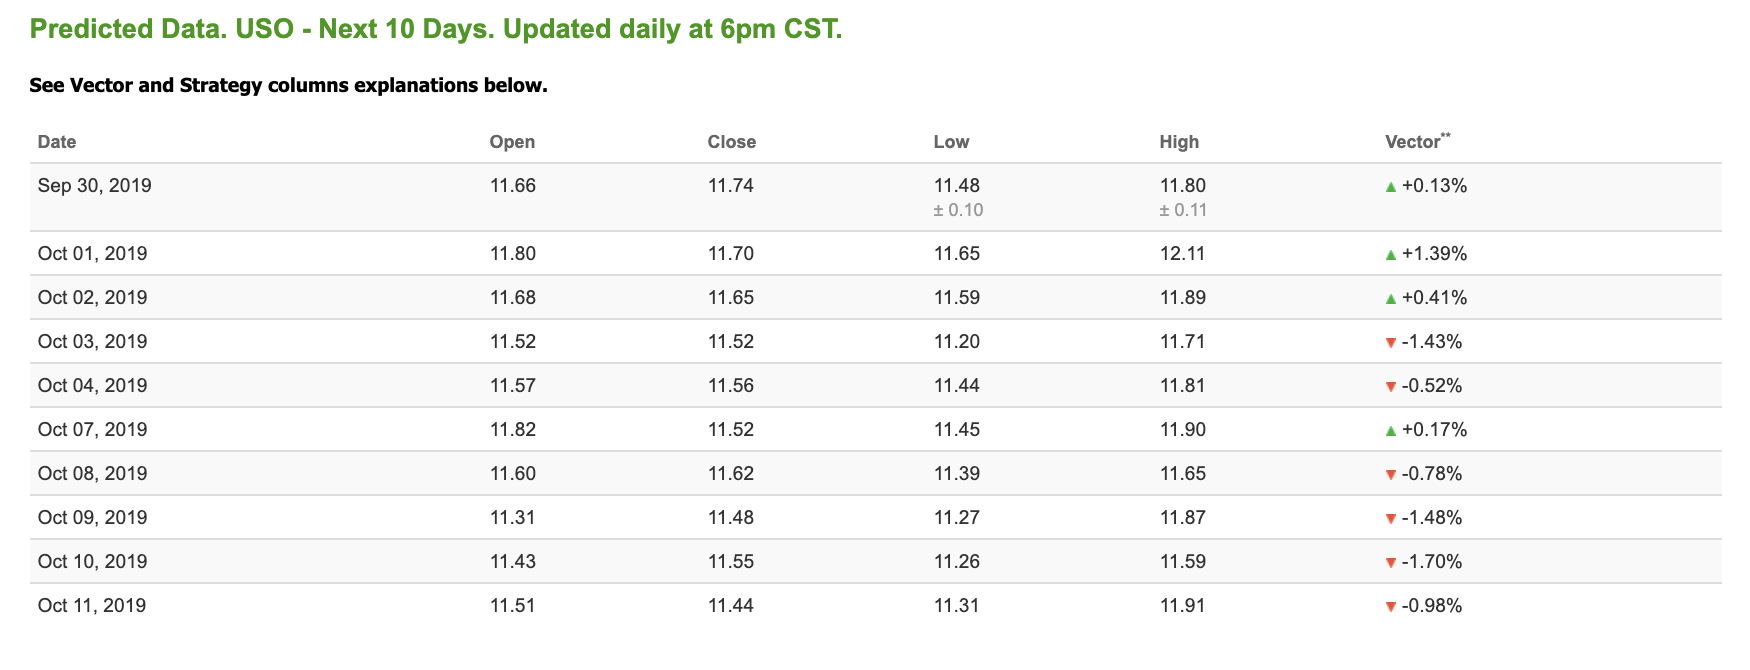
Looking at USO, a crude oil tracker, our 10-day prediction model shows mixed signals. The fund is trading at $11.31 at the time of publication, down 3.00% from the open. Vector figures show +0.13% today, which turns +0.17% in five trading sessions. Prediction data is uploaded after market close at 6 p.m., CST. Today’s data is based on market signals from the previous trading session.
Gold
The price for the Gold Continuous Contract (GC00) is down 1.79% at $1,479.50 at the time of publication.
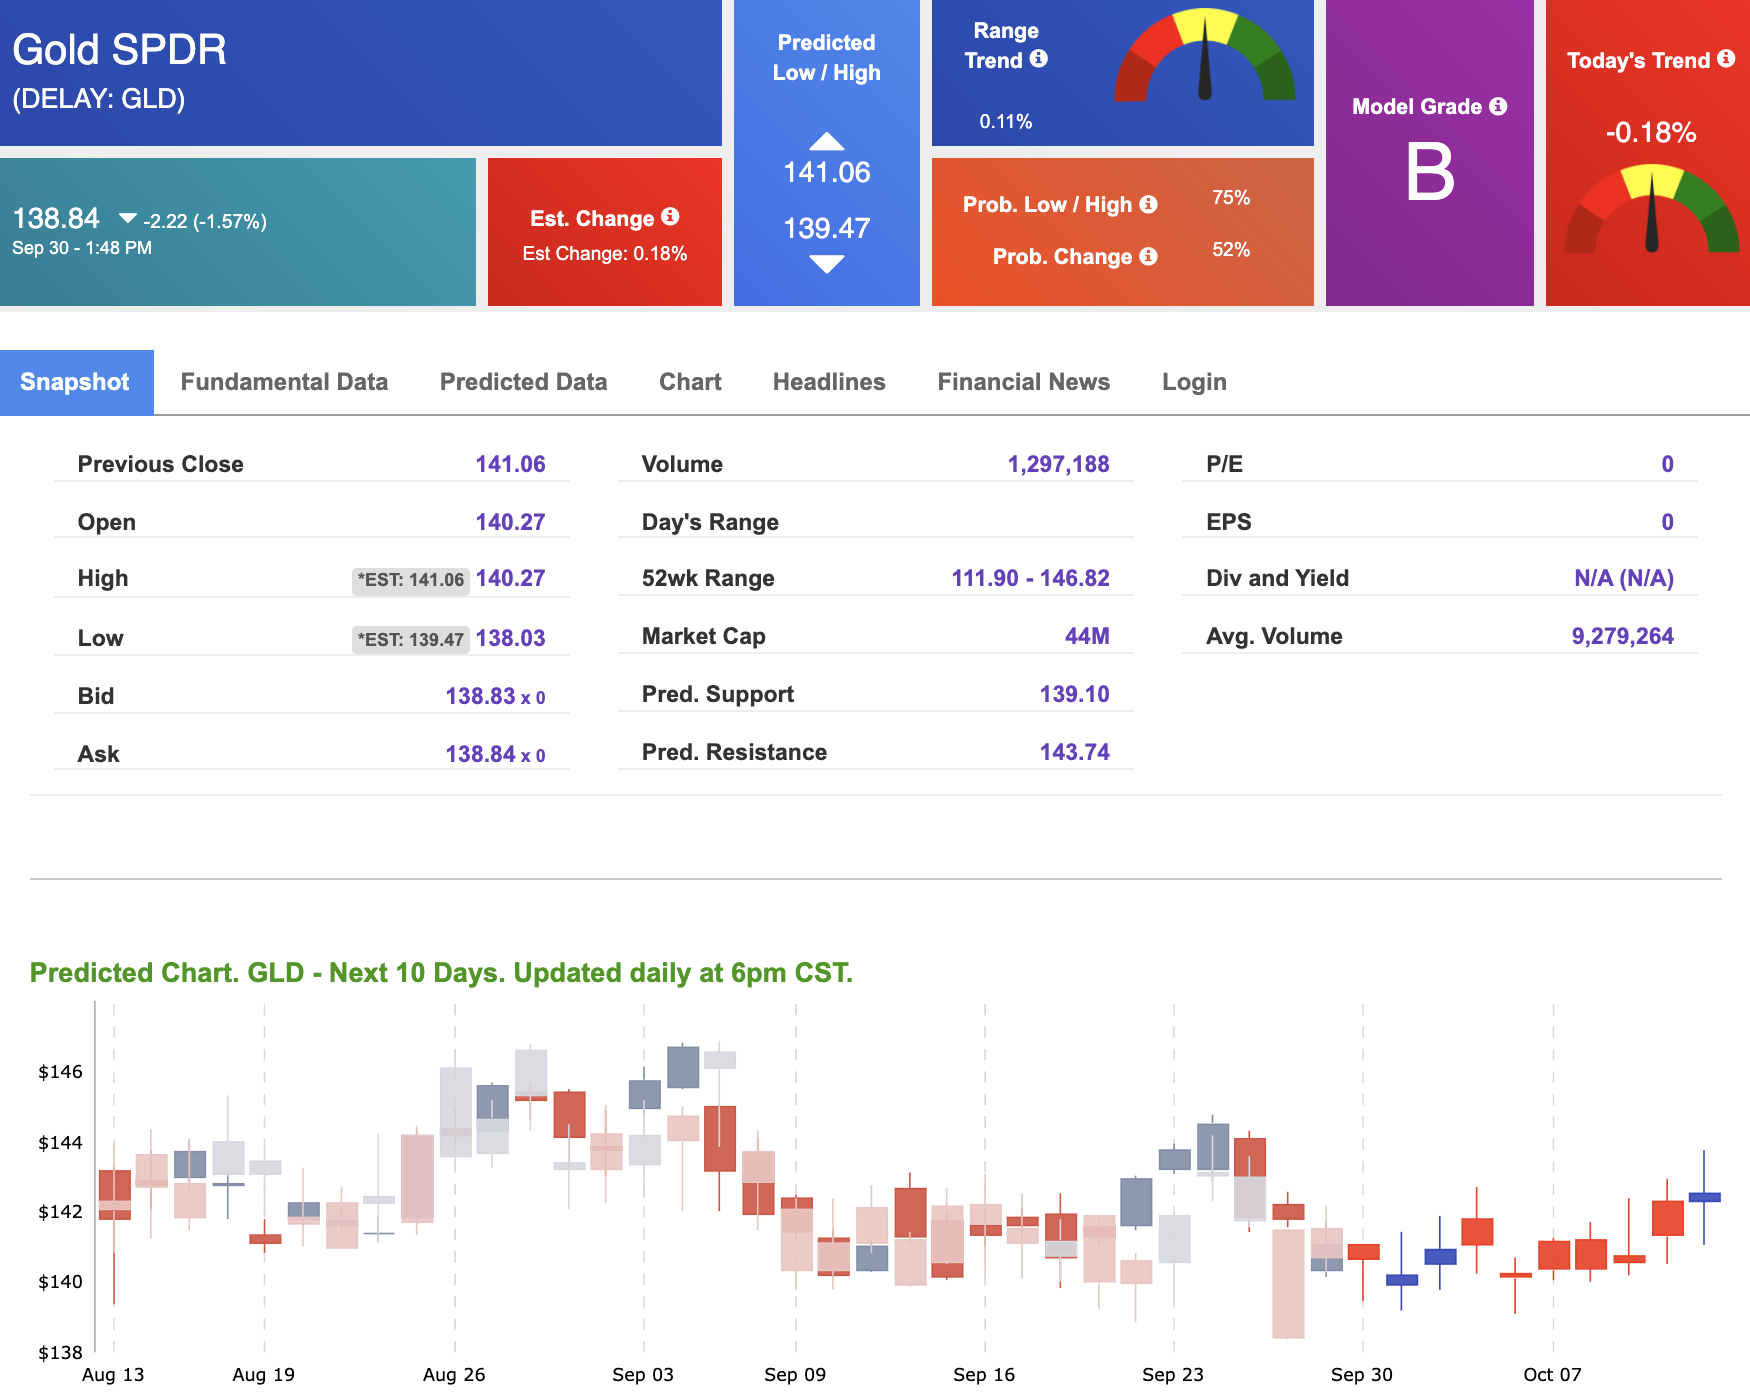
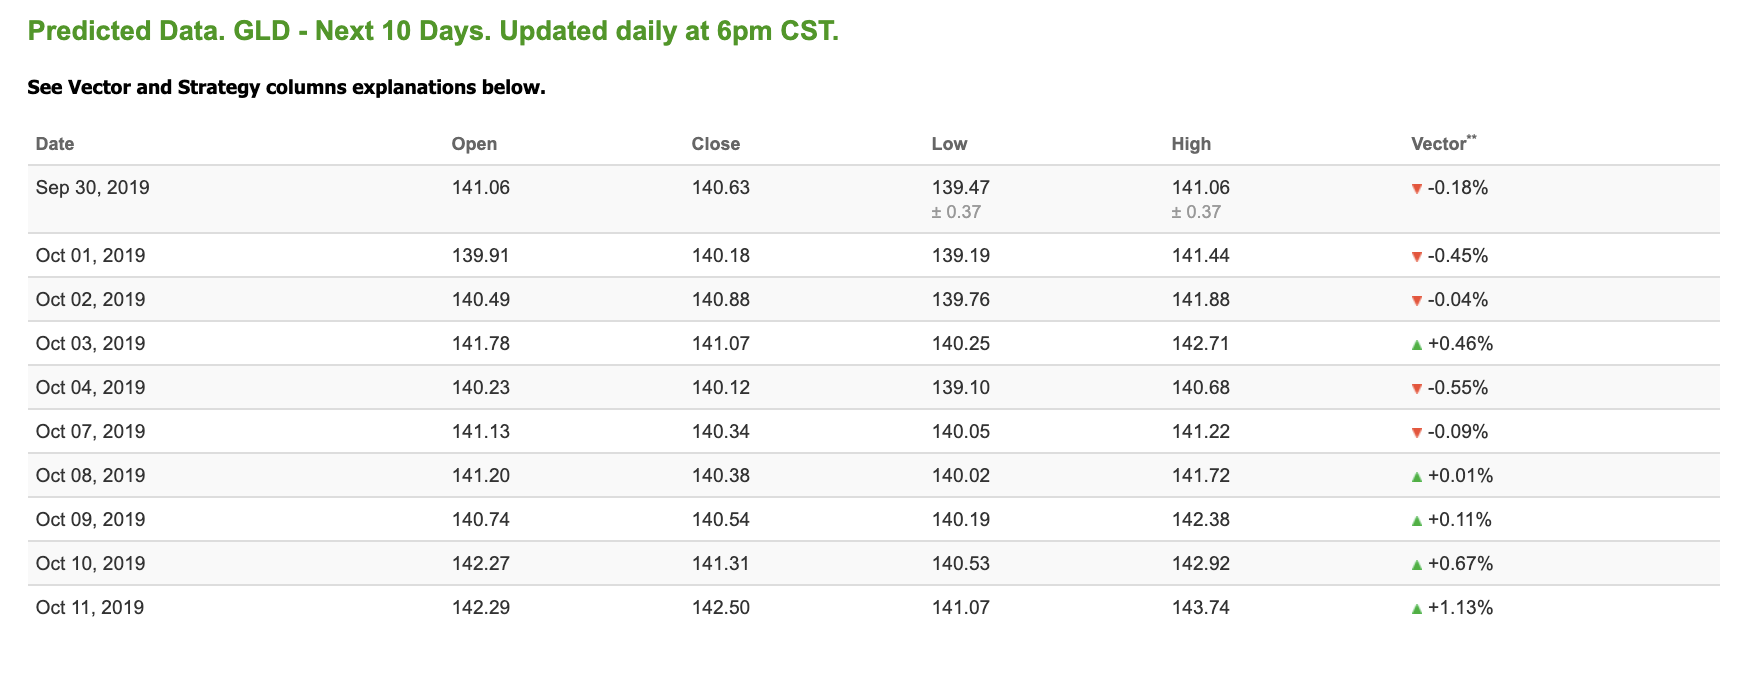
Using SPDR GOLD TRUST (GLD) as a tracker in our Stock Forecast Tool, the 10-day prediction window shows mostly negative signals. The gold proxy is trading at $138.84, down 1.57% at the time of publication. Vector signals show -0.18% for today. Prediction data is uploaded after market close at 6 p.m., CST. Today’s data is based on market signals from the previous trading session.
Treasuries
The yield on the 10-year Treasury note is down 0.36% at 1.68% at the time of publication. The yield on the 30-year Treasury note is down 0.23% at 2.13% at the time of publication.
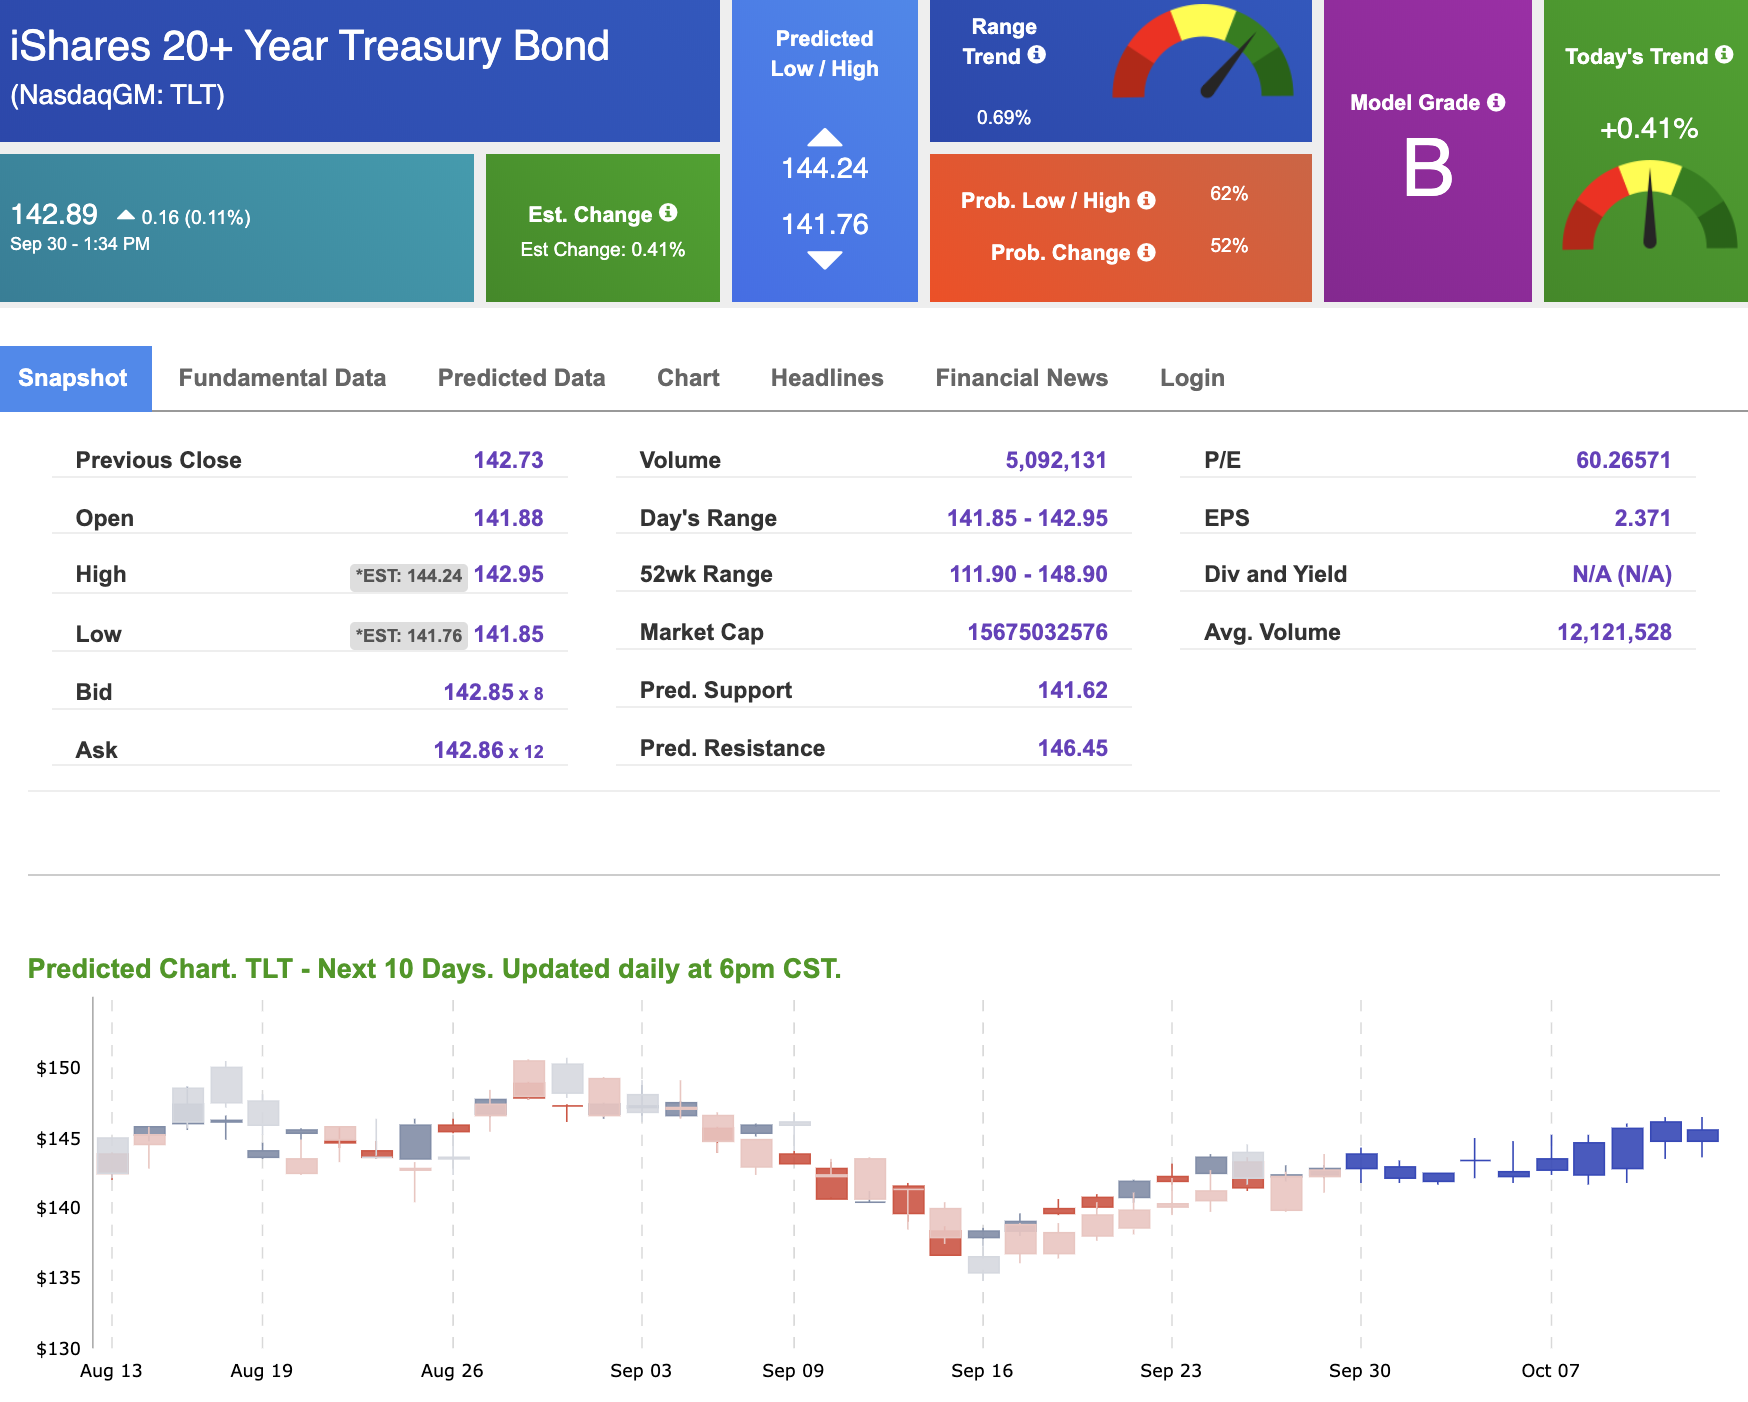
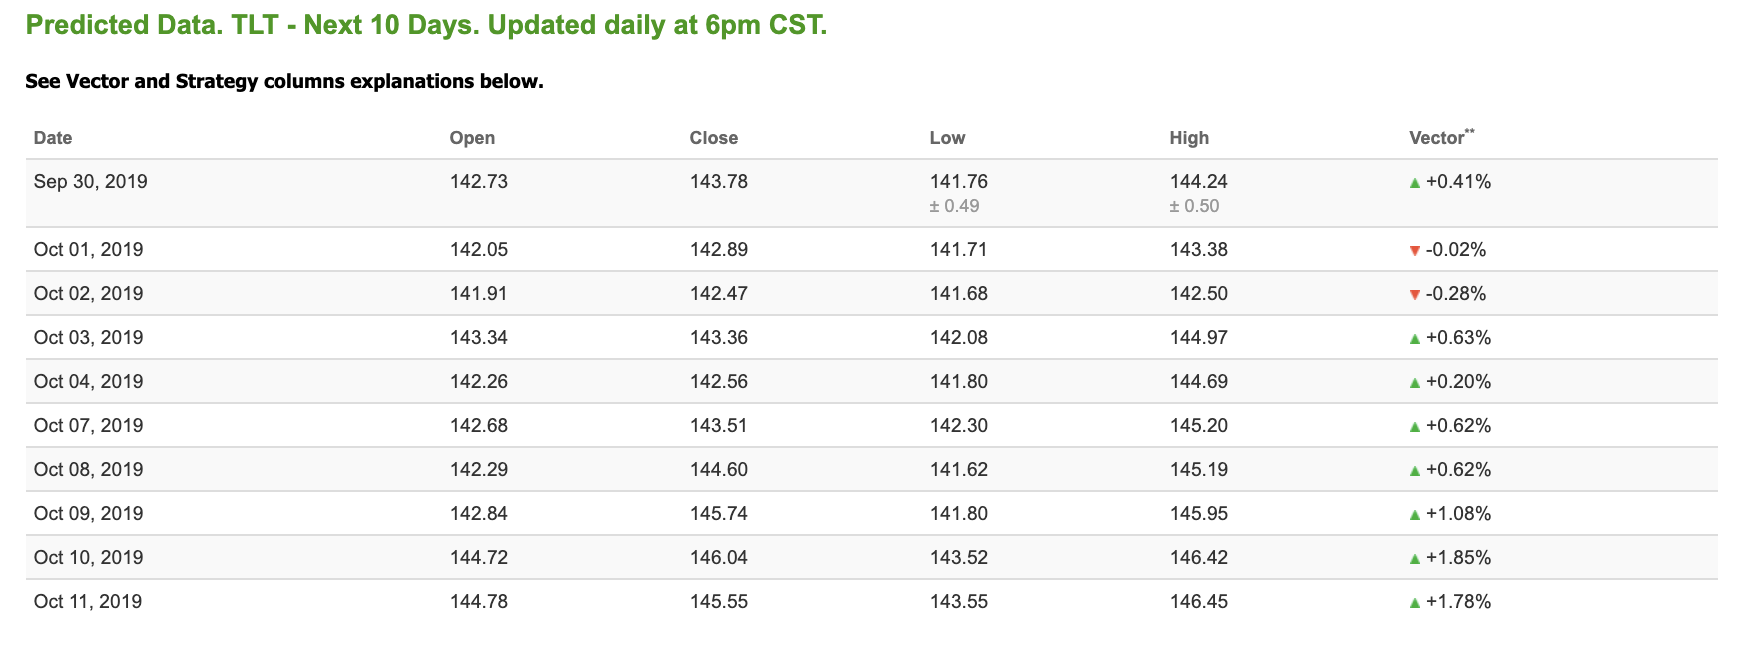
Using the iShares 20+ Year Treasury Bond ETF (TLT) as a proxy for bond prices in our Stock Forecast Tool, we see positive signals in our 10-day prediction window. Today’s vector of +0.41% moves to +0.63% in three sessions. Prediction data is uploaded after market close at 6 p.m., CST. Today’s data is based on market signals from the previous trading session.
Volatility
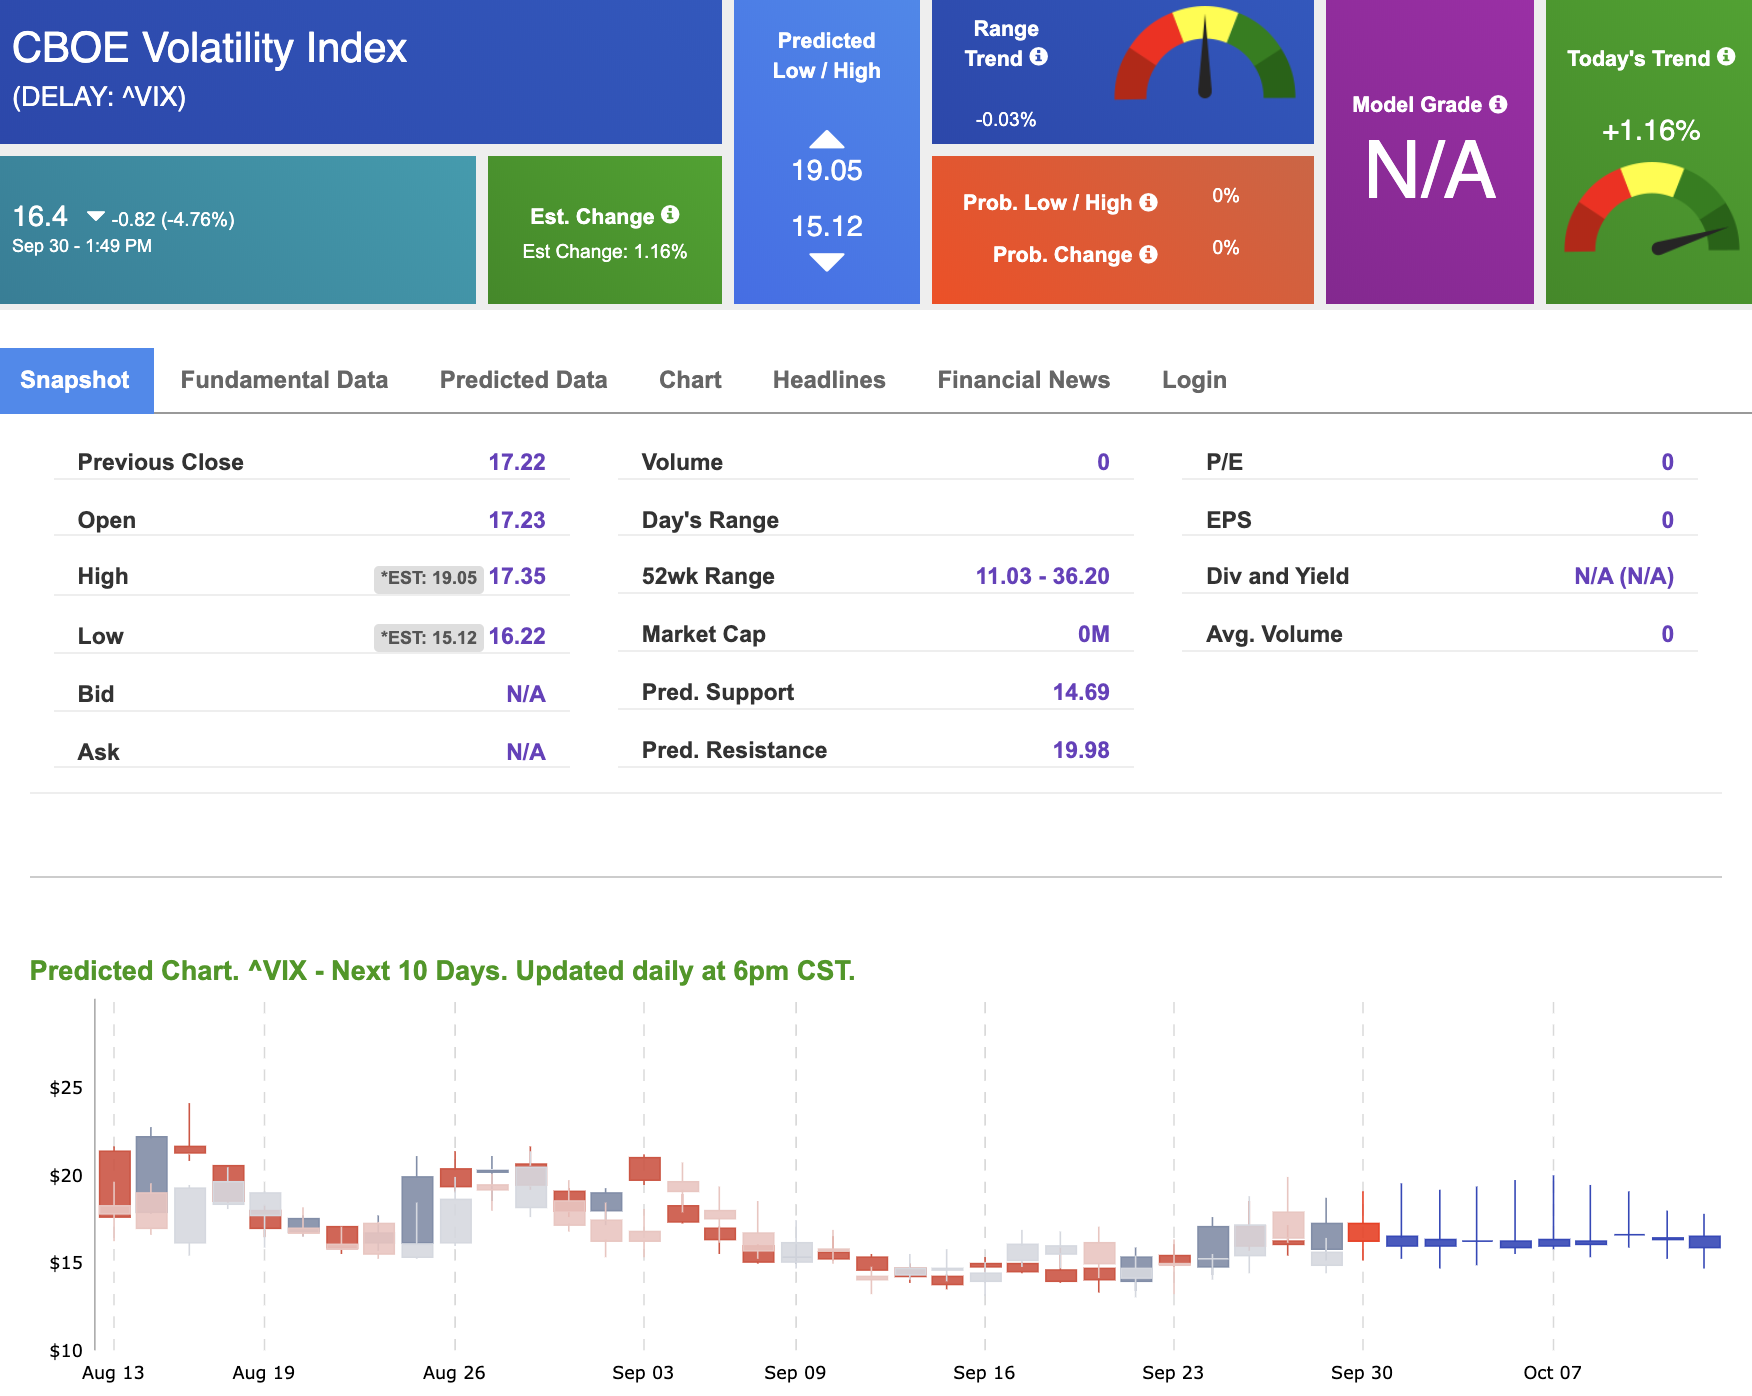
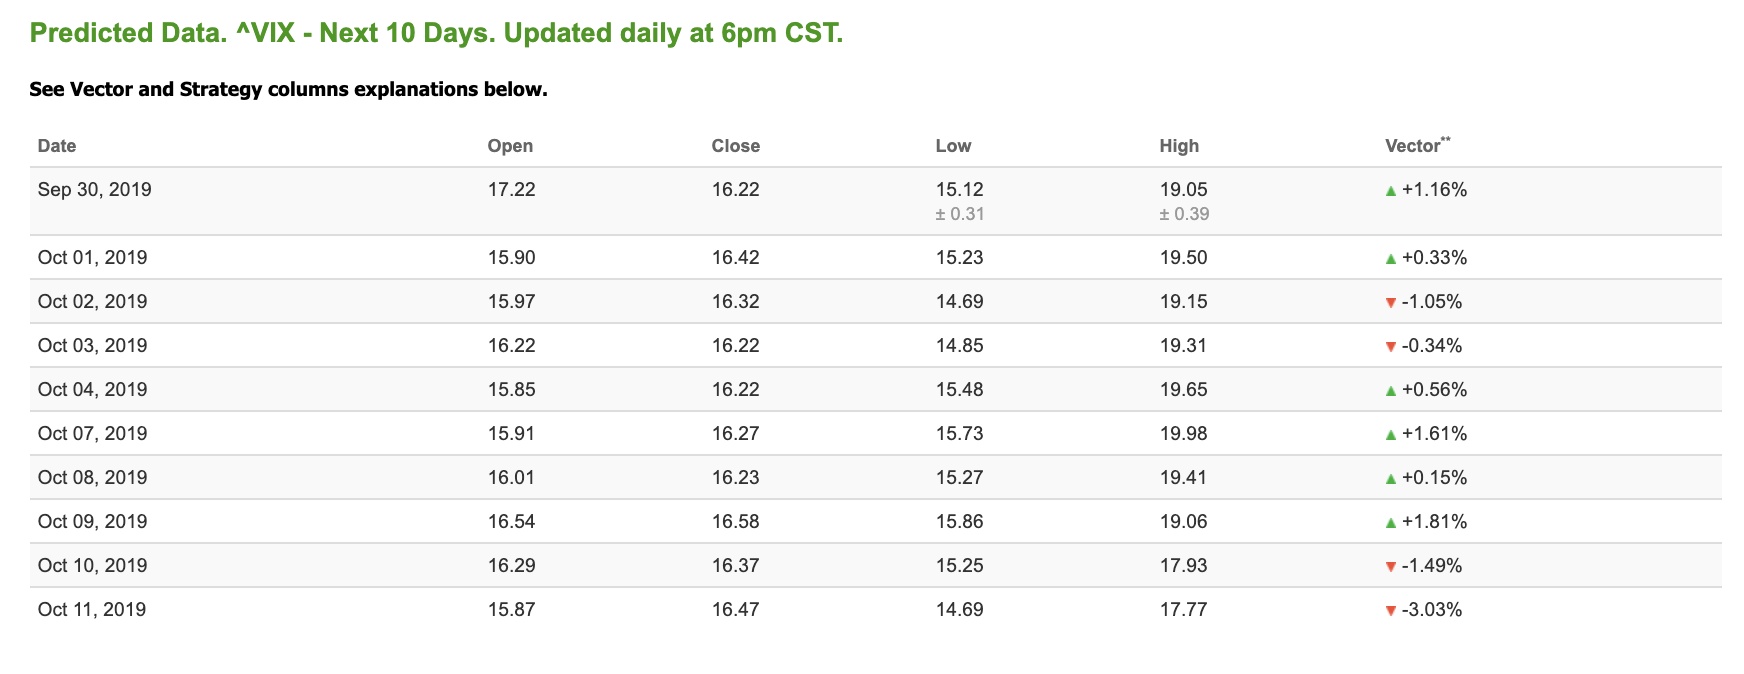
The CBOE Volatility Index (^VIX) is down 4.76% at $16.4 at the time of publication, and our 10-day prediction window shows mixed signals. The predicted close for tomorrow is $16.42 with a vector of +0.33%. Prediction data is uploaded after market close at 6 p.m., CST. Today’s data is based on market signals from the previous trading session.
