Markets Rebound on First Day of Huge Q2 Earnings Week
U.S. stocks slighty higher
Major U.S. indices are trading modestly higher today after closing lower on Friday, with focusing firmly shifting to Q2 earnings this week.
Several big-name earnings reports this week
Following Haliburton’s pre-market release today, this week will feature several big-name earnings reports, including Coca-Cola, Visa, Facebook, Boeing, Comcast, Starbucks, McDonald’s, Twitter, and Amazon.
Economic data this week
U.S home sales, both existing and new, and Q2 GDP will be the marquee economic reports to look out for this week while next week focus will shift to the July 30-31 FOMC where we could see a potential interest rate cut.
(Want free training resources? Check our our training section for videos and tips!)
SPY buying opportunity near $290 level
If the Fed’s cut rates by 25-50 basis points, we could see some volatility in the market. Still, with the SPY trading at an all-time high level, we continue encouraging our readers to avoid chasing near $300 and consider buying near $290 level.
SPY Seasonal Chart
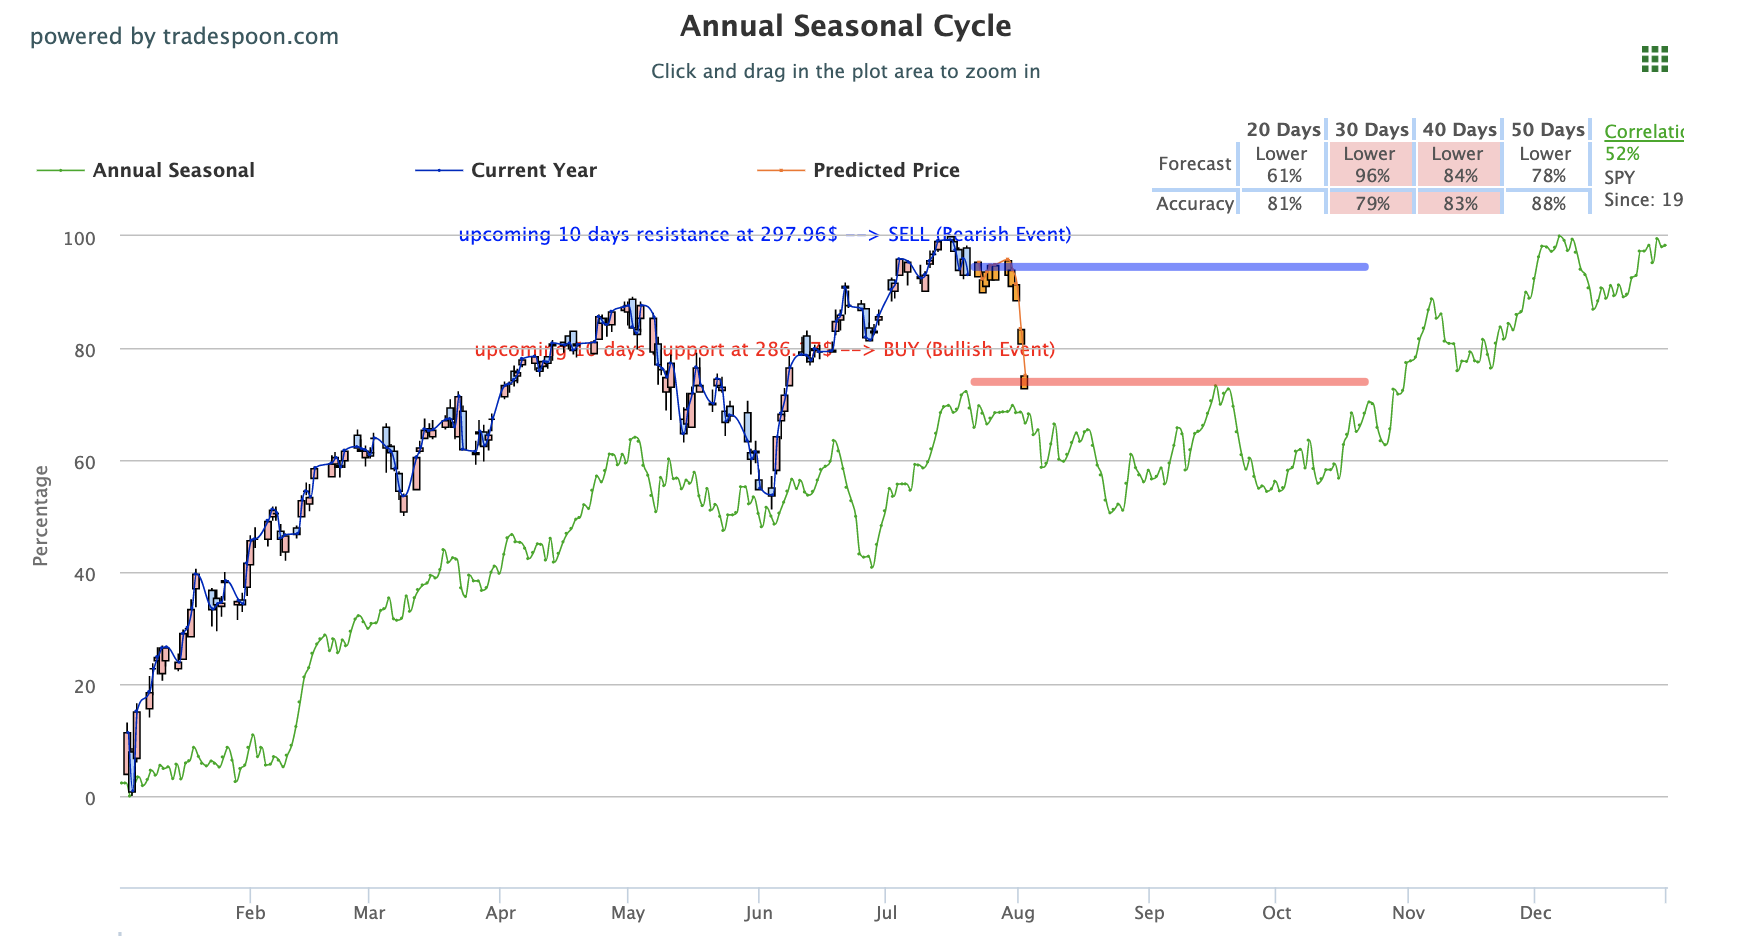
This week’s corporate earnings remain the biggest factor to markets this week but we do not see market momentum pushing SPY above much higher than $300, potentially overshooting to $305. For reference, the SPY Seasonal Chart is shown below:

Haliburton stock gain over 8% after earnings release
Haliburton released earnings that beat estimates before market open today which helped the stock gain over 8%. This will be the first of many big names due to report this week following last week’s mostly impressive financial earnings data.
Facebook, Amazon, and Google report their earnings
Look for markets to react to major reports from Facebook, Amazon, and Google parent-company Alphabet while several other key reports will also be in focus this week.
Other notable names report earnings this week
On Tuesday, Coca-Cola, Visa, Hasbro, United Tech, Chipotle, Discover Financial, and Snap will release Q2 reports. Wednesday will feature AT&T, Boeing, Caterpillar, UPS, PayPal, and Tesla, while on Thursday 3M, Comcast, Raytheon, and Starbucks are scheduled to report.
(Want free training resources? Check our our training section for videos and tips!)
Q2 GDP data release on Friday
Besides earnings, several key economic reports will also release. Q2 GDP will release this Friday while weekly jobless claims, durable goods orders for June, and Q2 housing vacancies will release Thursday.
Potential talks between the U.S. and China as early as next week
Markets are responding positively to reports talks between the U.S. and China to meet face to face have accelerated, with both sides looking to meet as early as next week potentially. U.S. Trade Representative Robert Lighthizer and U.S. Treasury Secretary Steve Mnuchin are looking to head to Beijing next week to continue trade talks.
Tariffs still on even after several goodwill gestures by China
After several goodwill gestures by the Chinese government, including expanding the country’s financial sector to more foreign investors as well as a focus on American agricultural goods, the U.S. will continue holding off further tariffs for now as negotiations progress.
Good political news not help Asian markets
Still, the news was not able to help Asian markets as markets in China, Hong Kong, and Japan all closed in the red. European markets closed in the green. Continue monitoring tensions in the Middle East which have factored into global markets and continuously pushed the commodity to trade higher.
(Want free training resources? Check our our training section for videos and tips!)
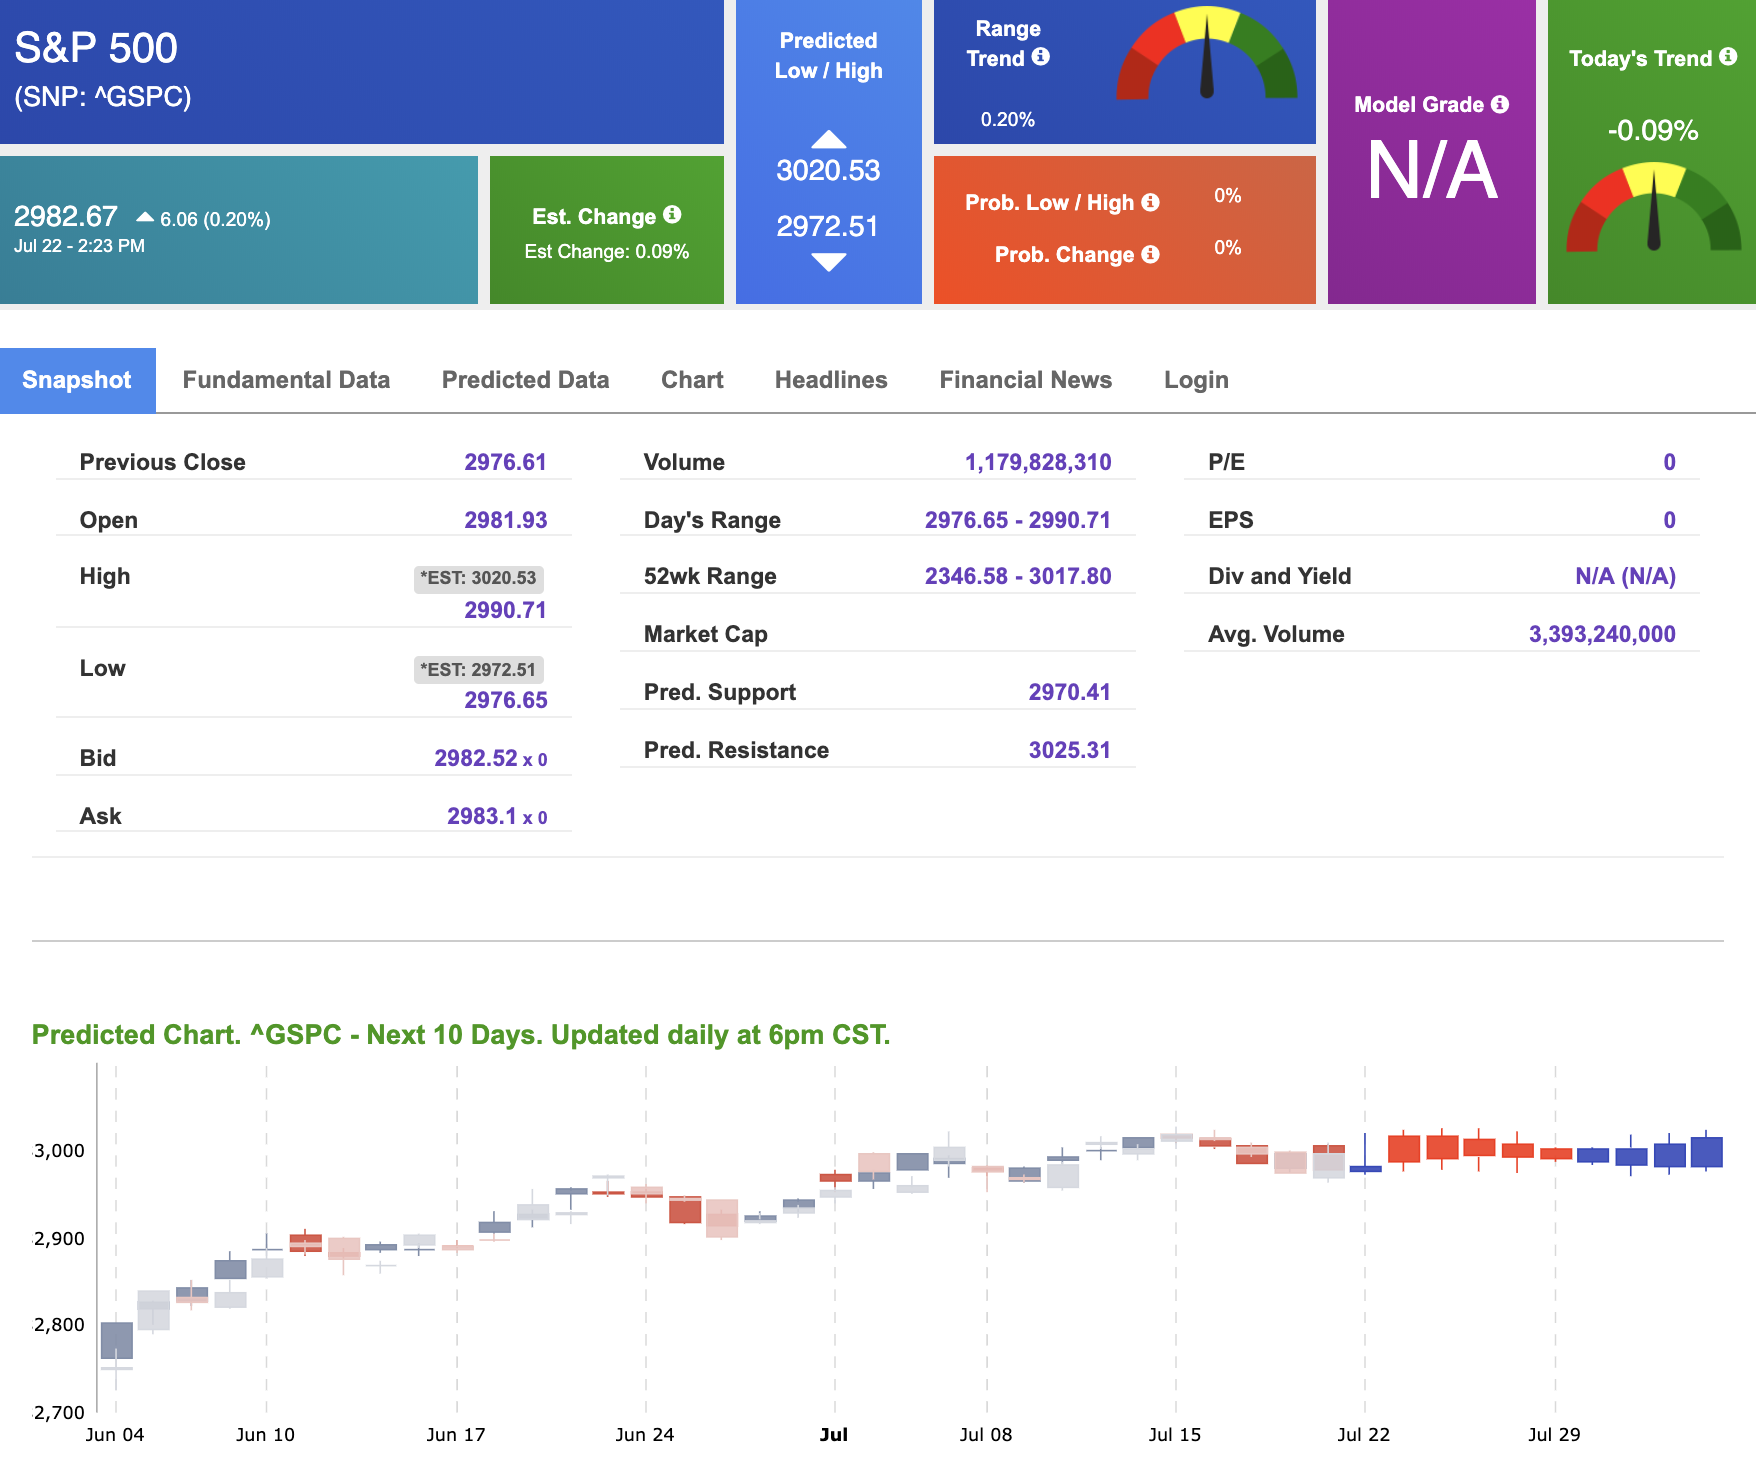
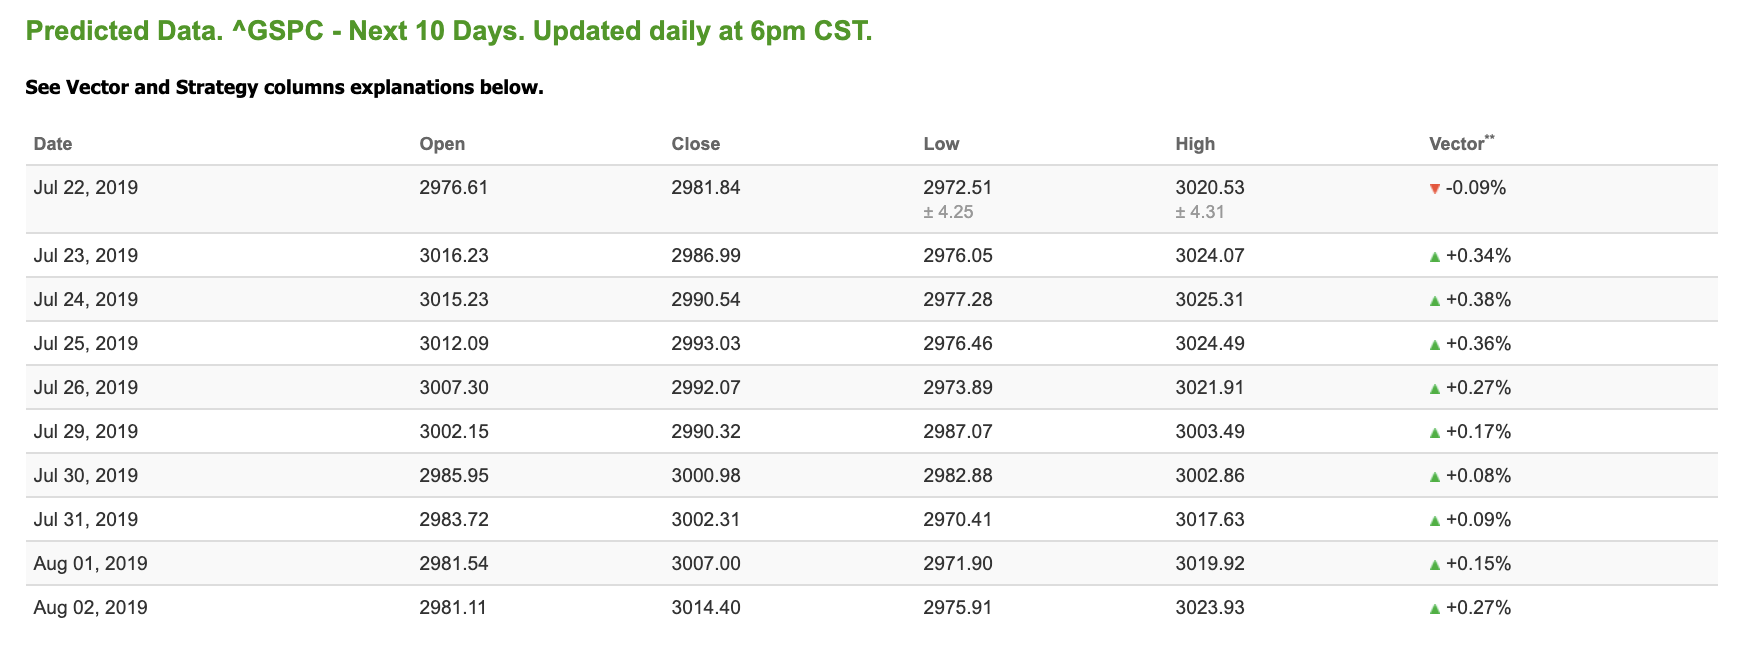
Using the “^GSPC” symbol to analyze the S&P 500 our 10-day prediction window shows mixed signals. Today’s vector figure of -0.09% moves to +0.17% in five trading sessions. Prediction data is uploaded after the market close at 6pm, CST. Today’s data is based on market signals from the previous trading session.
(Want free training resources? Check our our training section for videos and tips!)
When your win-rate is a rock-solid 74%, the more you trade, the greater your profits.
Simply duplicate the exact trades I’ll be making to up my current 1,253% gains to 1,500%… and even higher!
But honestly, the only way you can come to truly understand how incredibly accurate its buy/sell signals are, is to use it on a daily basis until it becomes second nature to you.
That’s why we have always offered a no-risk 30-day trial. The Elite Trading Circle is its own best salesman and I hope, that you’ll want to take advantage of our no-risk 30-day trial.
Don’t spend time thinking about this.
In a matter of minutes, all 50 guest passes could be activated!
Click here to get started
Highlight of a Recent Winning Trade
On July 17th, our ActiveTrader service produced a bullish recommendation for AES Corporation (AES). ActiveTrader is included in all paid Tradespoon membership plans and is designed for day trading.
Trade Breakdown
AES entered its forecasted Strategy B Entry 1 price range $17.29 (± 0.07) in its first hour of trading and passed through its Target price $17.46 in the second hour of trading that day. The Stop Loss price was set at $17.12
(Want free training resources? Check our our training section for videos and tips!)

Tuesday Morning Featured Symbol
*Please note: At the time of publication we do not own the featured symbol, KSS. Our featured symbol is part of your free subscription service. It is not included in any paid Tradespoon subscription service. Vlad Karpel only trades his own personal money in paid subscription services. If you are a paid subscriber, please review your Premium Member Picks, ActiveTrader or MonthlyTrader recommendations. If you are interested in receiving Vlad’s personal picks, please click here.
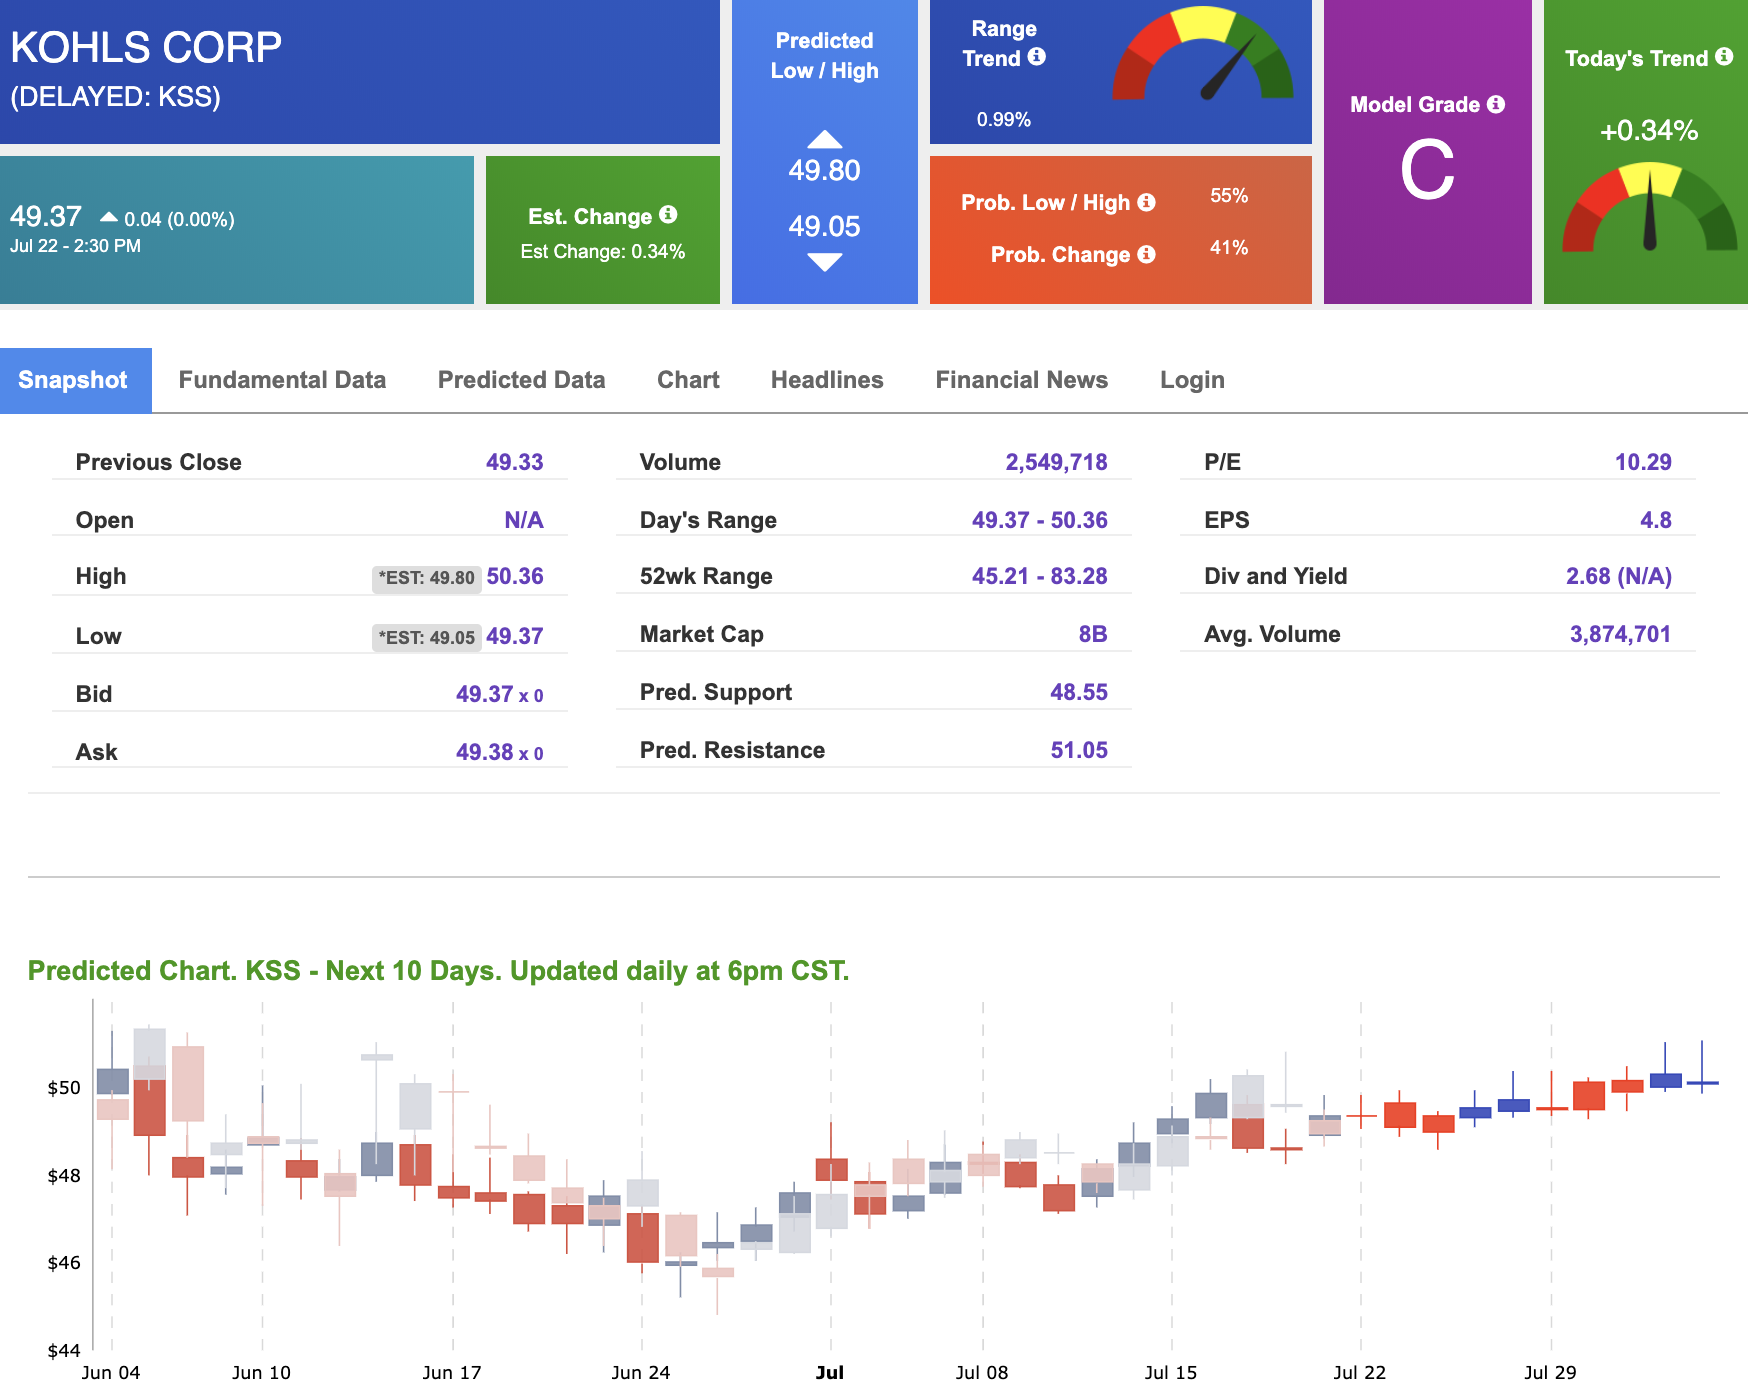
KSS is showing a confident vector trend in our Stock Forecast Toolbox’s 10-day forecast
Our featured symbol for Tuesday is Kohl’s Corp (KSS). KSS is showing a confident vector trend in our Stock Forecast Toolbox’s 10-day forecast. This stock is assigned a Model Grade of (C) indicating it ranks in the top 50th percentile for accuracy for predicted support and resistance, relative to our entire data universe.
(Want free training resources? Check our our training section for videos and tips!)
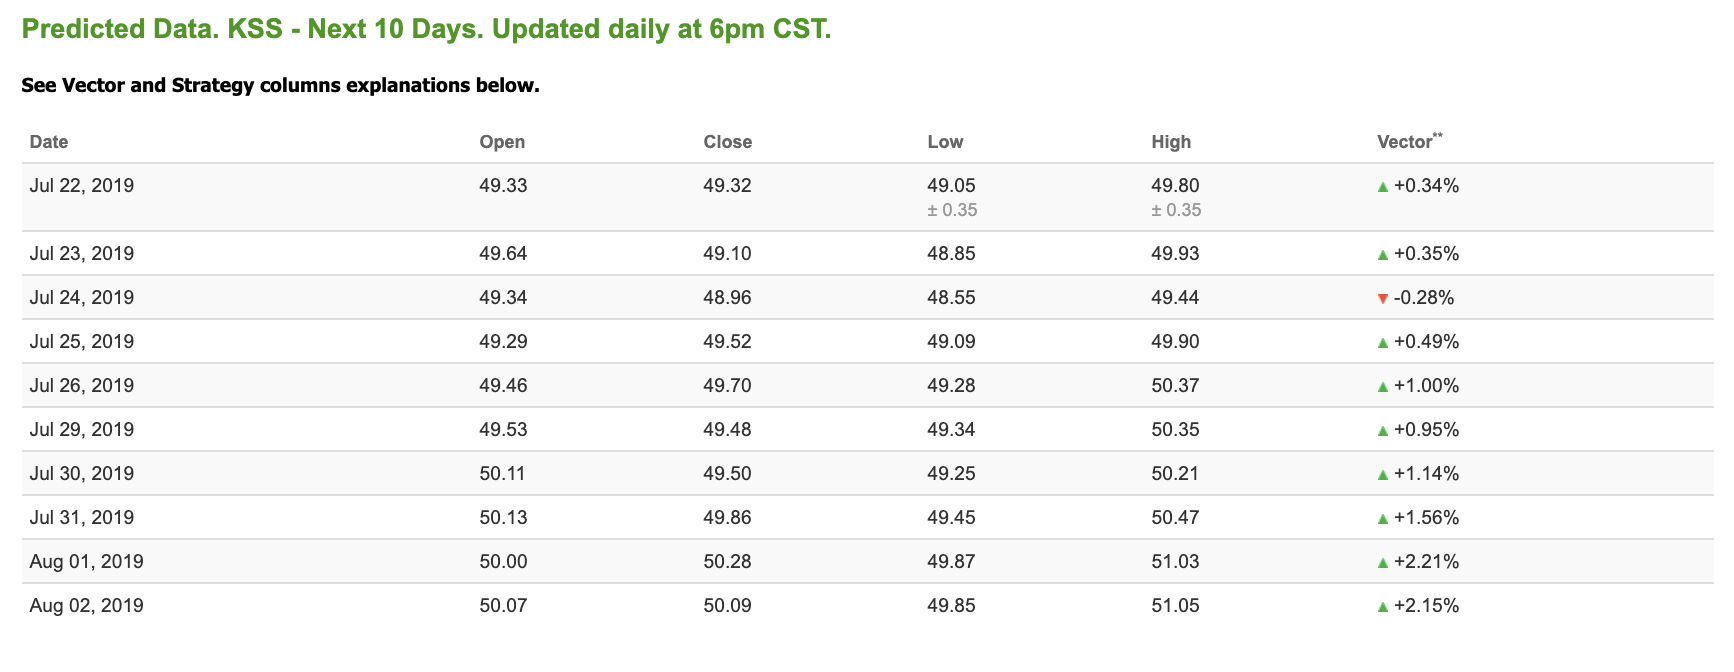
The stock is trading at $49.37 at the time of publication, with a +0.34% vector figure.
Prediction data is uploaded after market close at 6 p.m., CST. Today’s data is based on market signals from the previous trading session.
Note: The Vector column calculates the change of the Forecasted Average Price for the next trading session relative to the average of actual prices for the last trading session. The column shows expected average price movement “Up or Down”, in percent. Trend traders should trade along the predicted direction of the Vector. The higher the value of the Vector the higher its momentum.
Oil
West Texas Intermediate for Crude Oil delivery (CL.1) is priced at $61.17 per barrel, down 3.10% from the open, at the time of publication.
(Want free training resources? Check our our training section for videos and tips!)
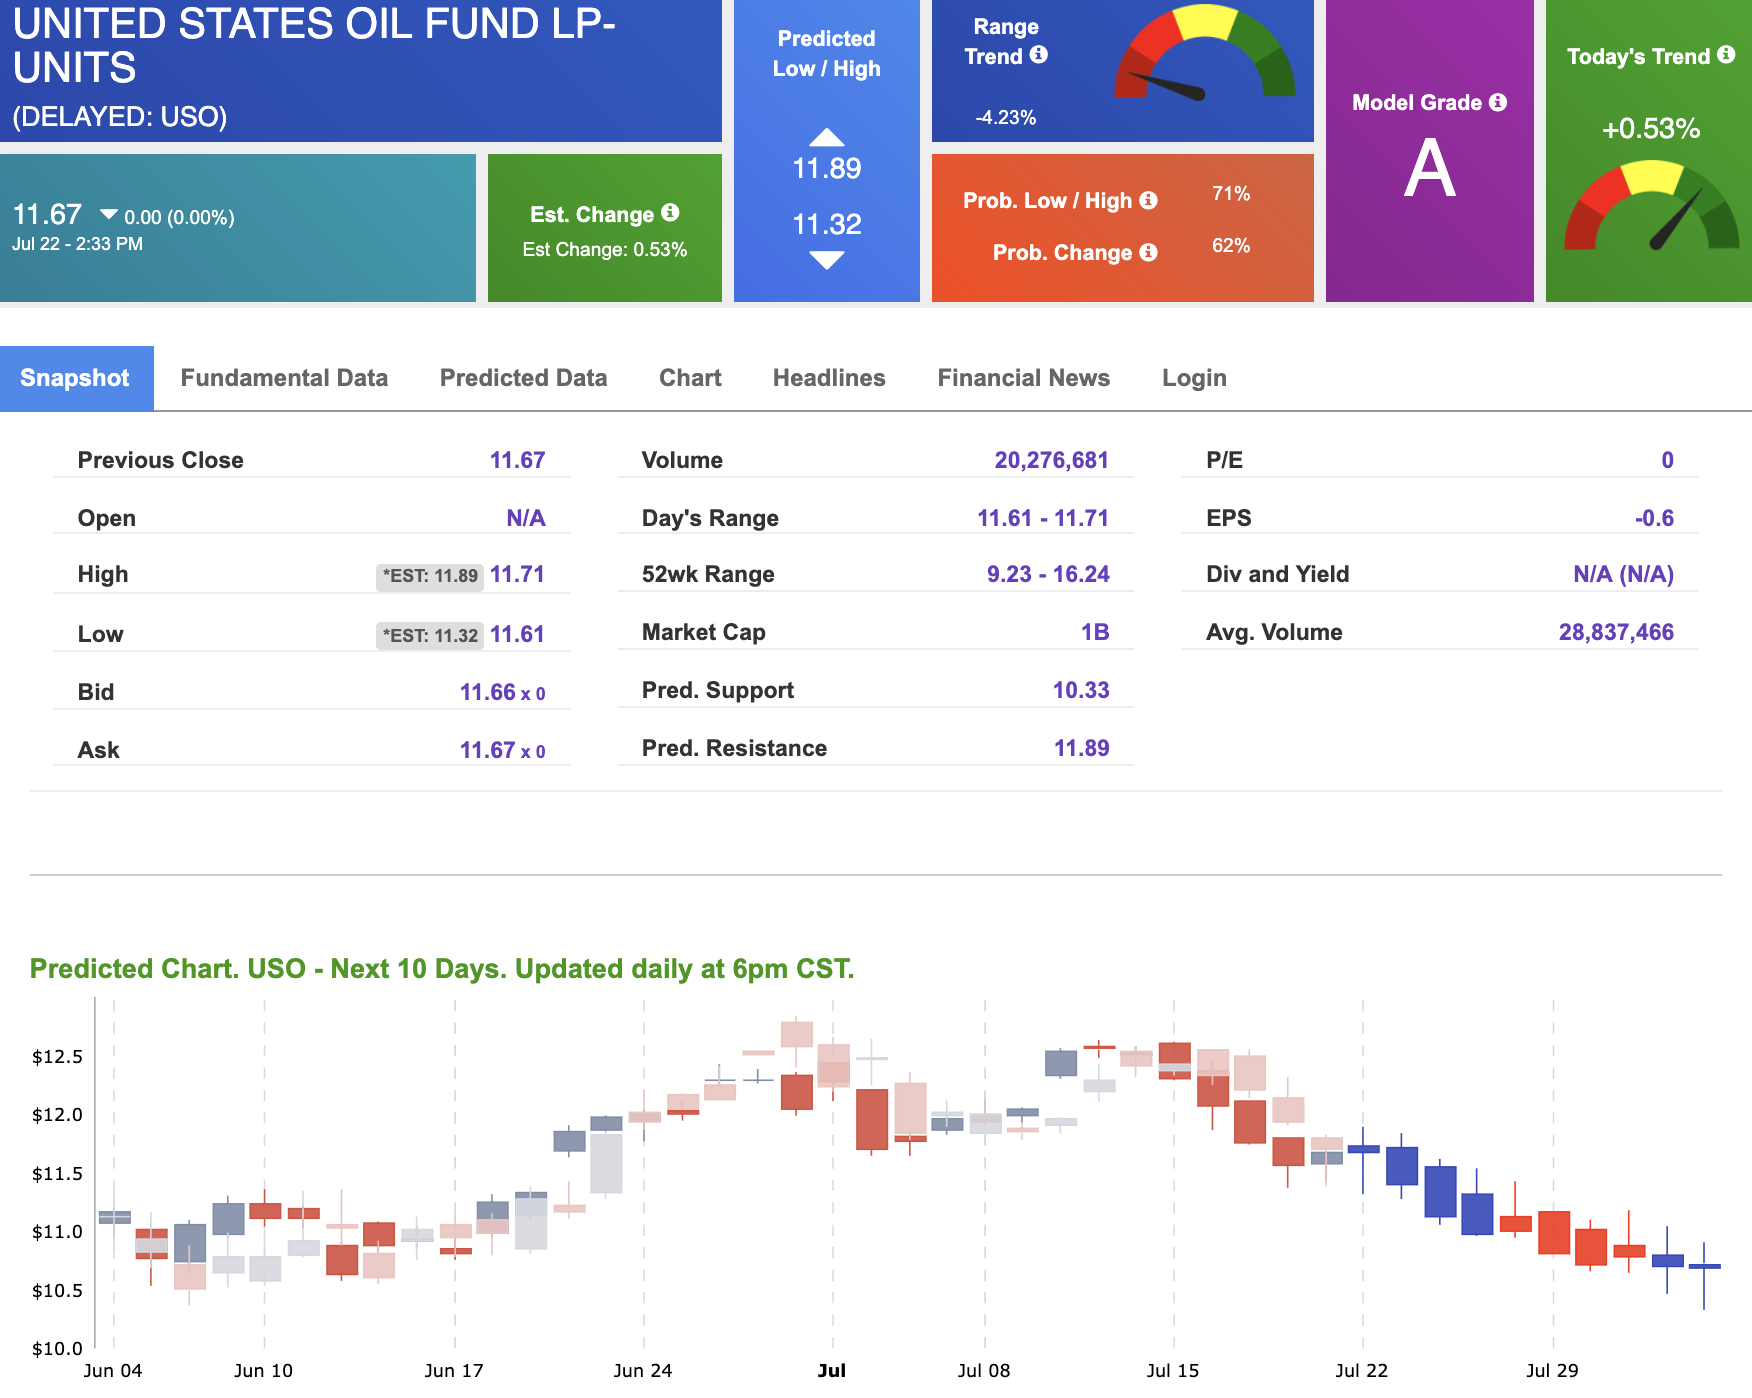
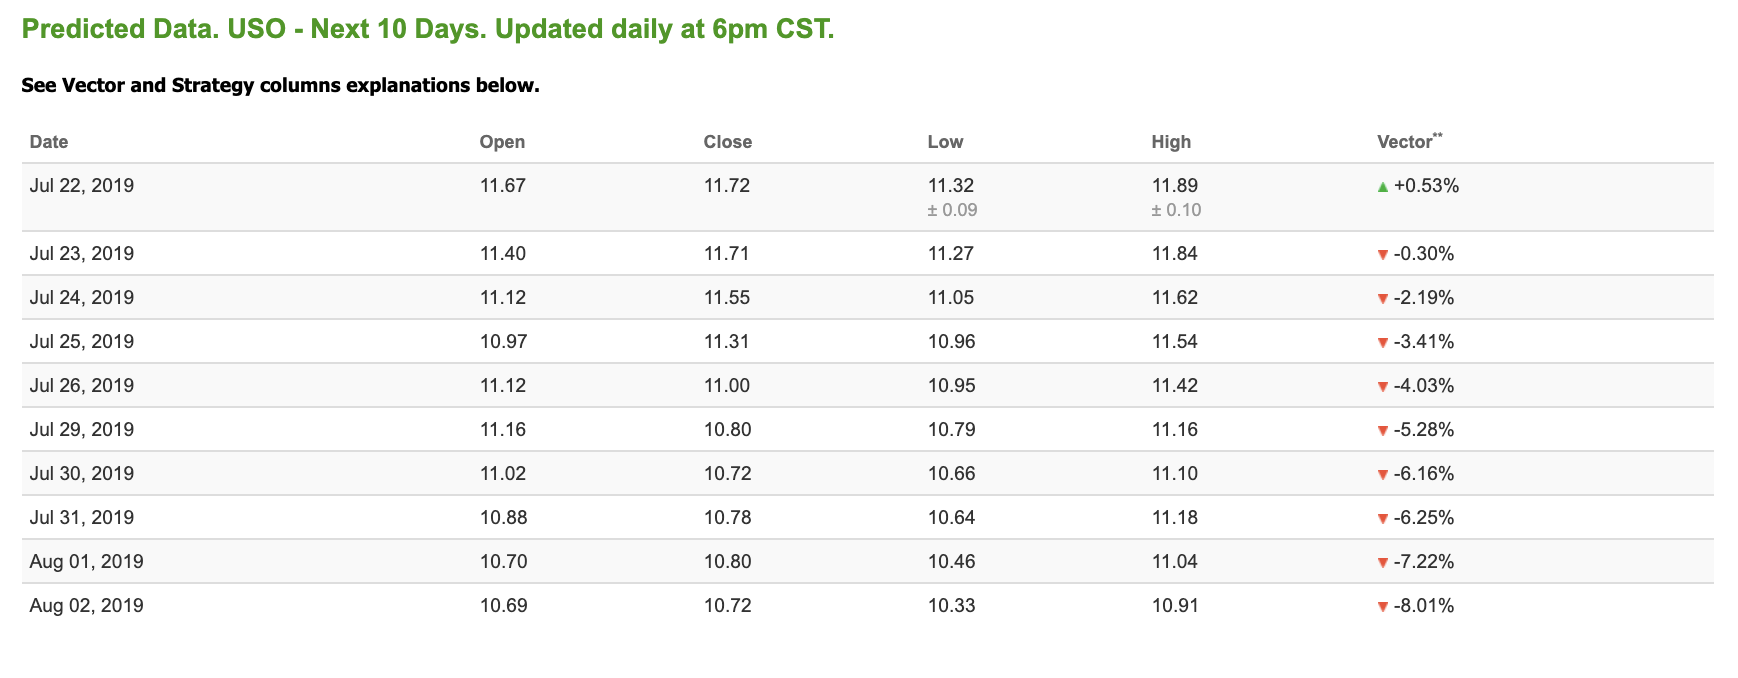
Looking at USO, a crude oil tracker, our 10-day prediction model shows mixed signals. The fund is trading at $15.06 at the time of publication, down 2.08% from the open.
Vector figures show -0.16% today, which turns -0.36% in five trading sessions. Prediction data is uploaded after market close at 6 p.m., CST. Today’s data is based on market signals from the previous trading session.
(Want free training resources? Check our our training section for videos and tips!)
Gold
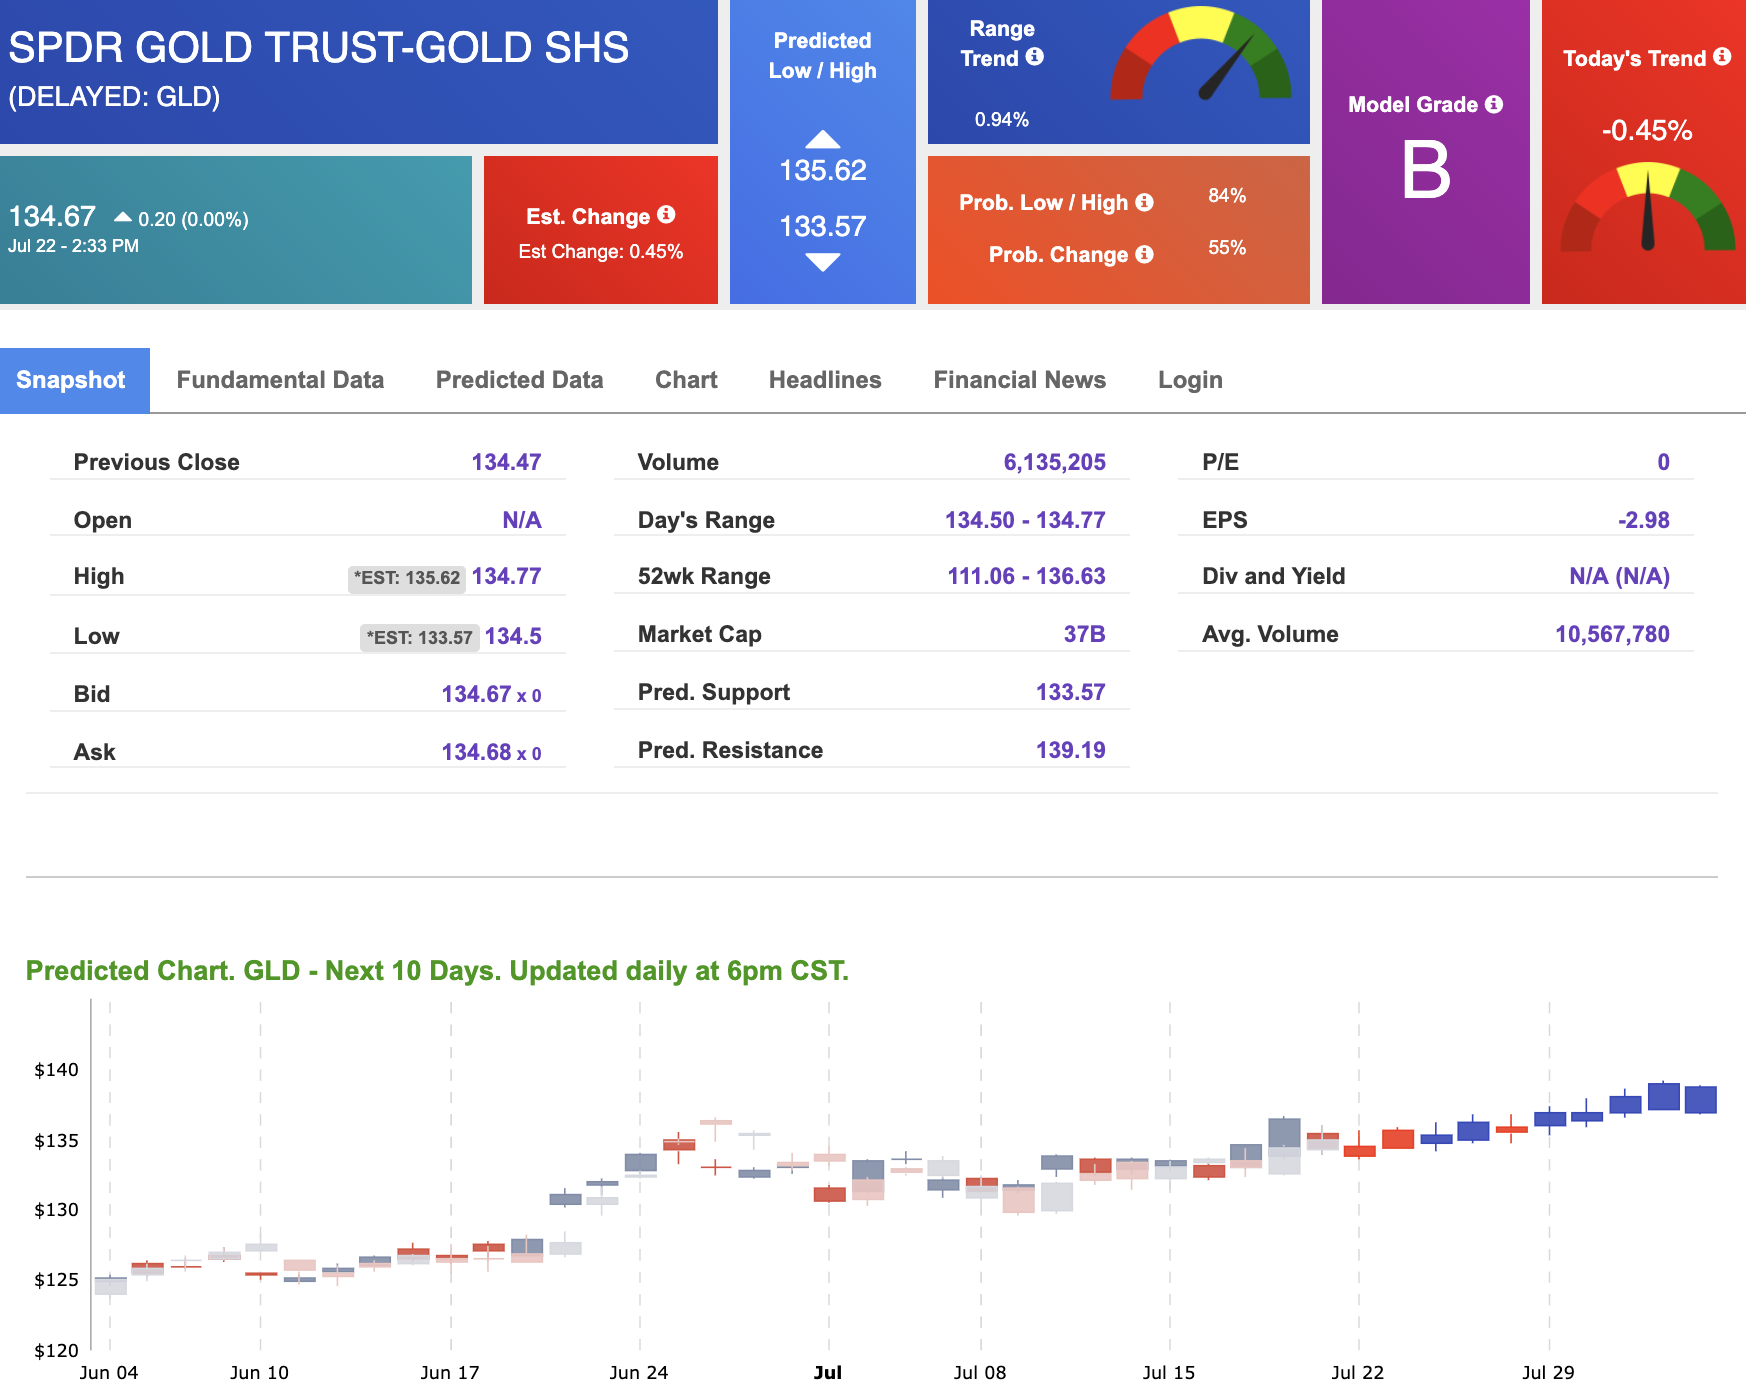
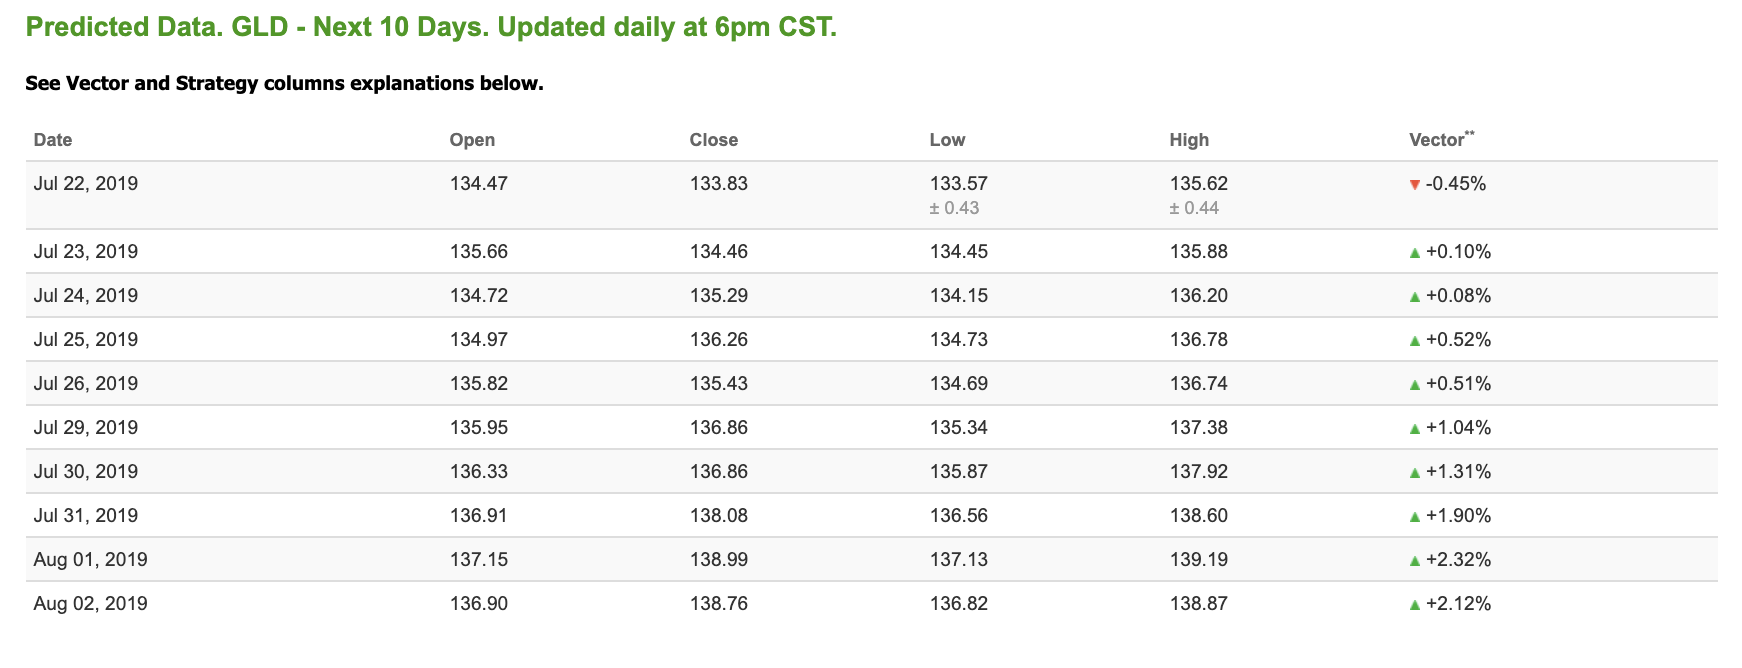
The price for the Gold Continuous Contract (GC00) is up 0.09% at $1,274.40 at the time of publication.
Using SPDR GOLD TRUST (GLD) as a tracker in our Stock Forecast Tool, the 10-day prediction window shows mostly negative signals. The gold proxy is trading at $115.54, up 2.36% at the time of publication. Vector signals show +0.02% for today. Prediction data is uploaded after market close at 6 p.m., CST. Today’s data is based on market signals from the previous trading session.
(Want free training resources? Check our our training section for videos and tips!)
Treasuries
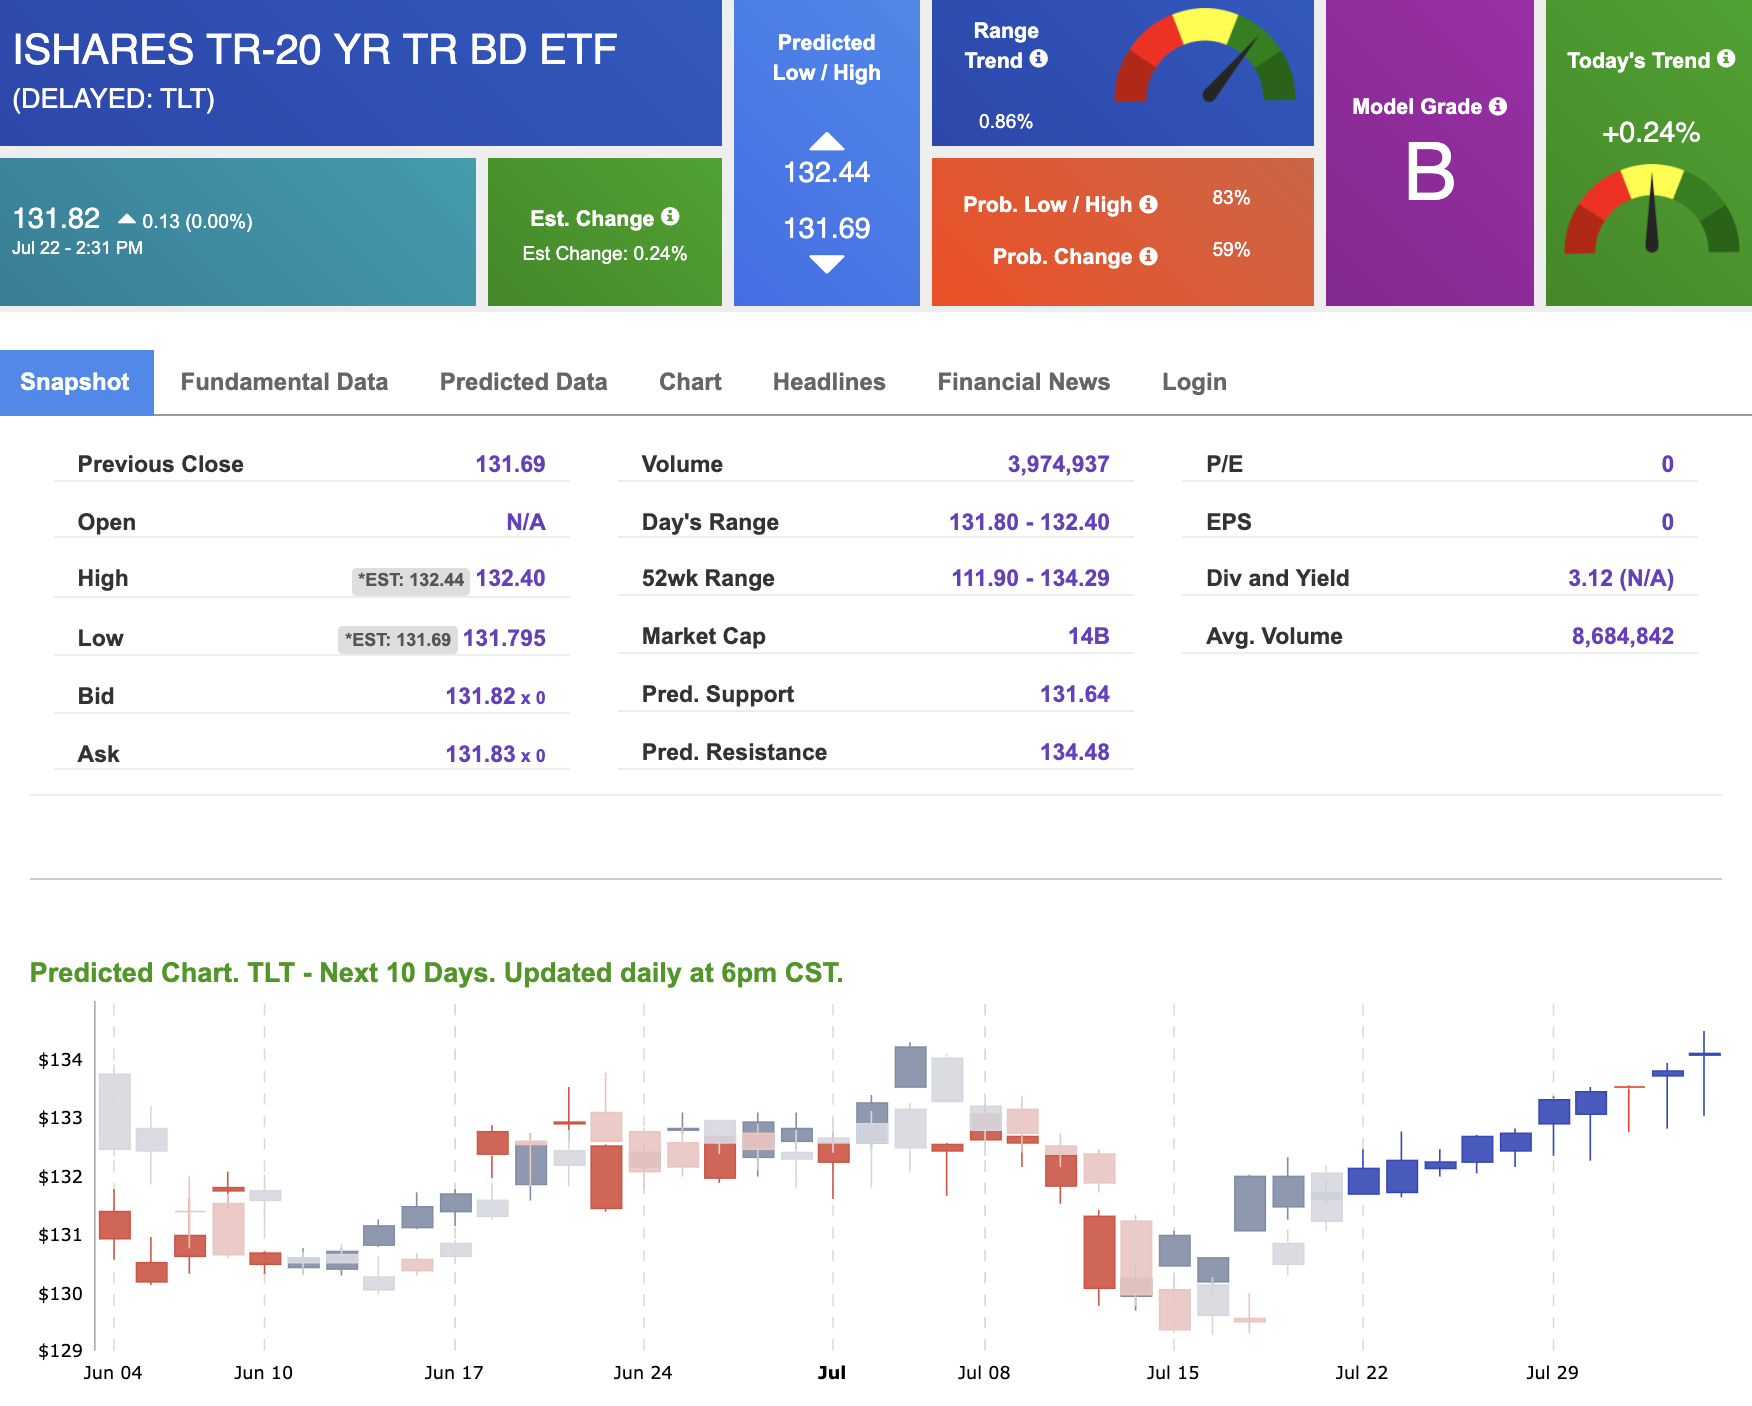
The yield on the 10-year Treasury note is up 2.29% at 2.72% at the time of publication. The yield on the 30-year Treasury note is up 2.32% at 3.96% at the time of publication.
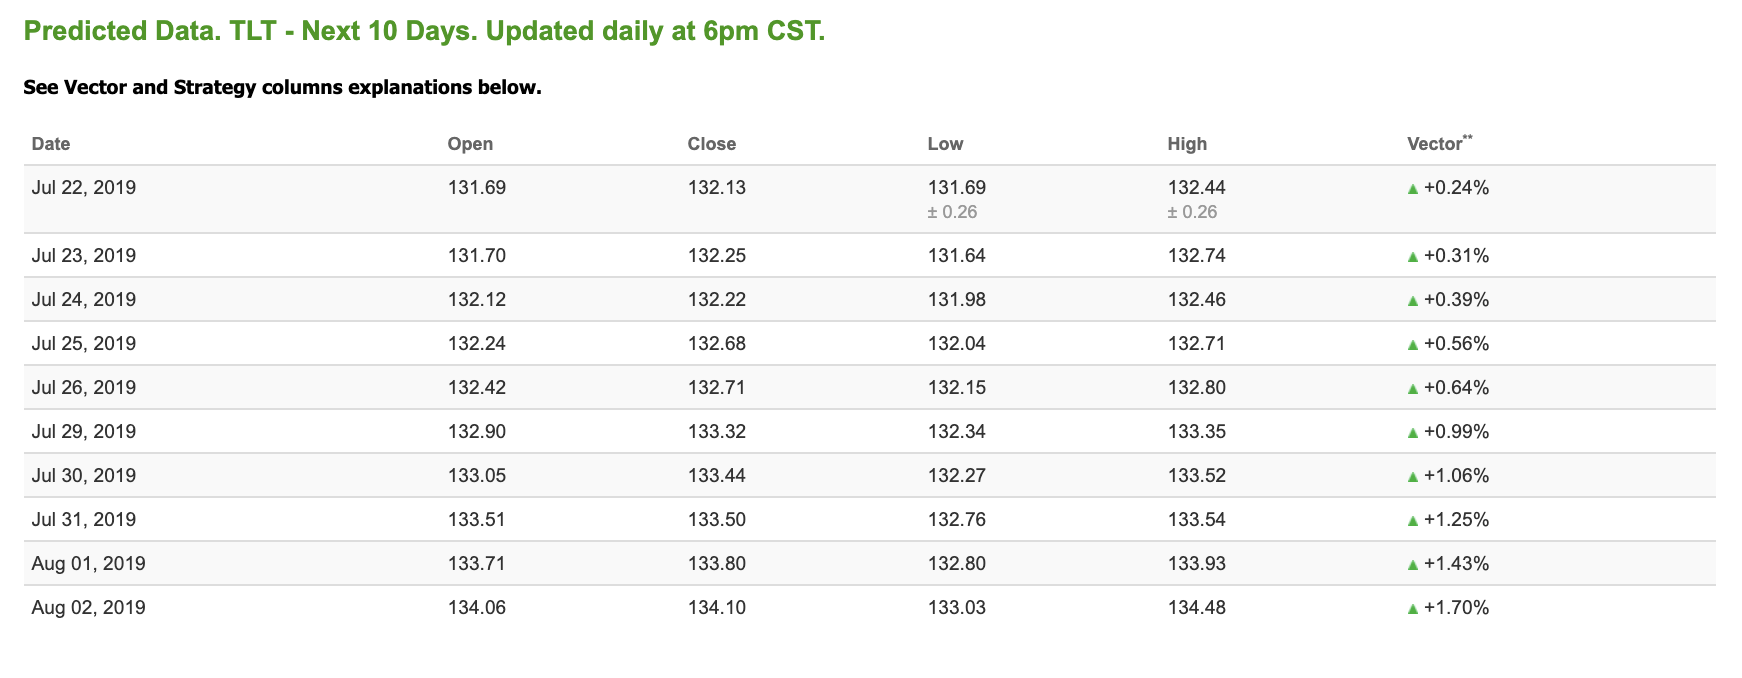
Using the iShares 20+ Year Treasury Bond ETF (TLT) as a proxy for bond prices in our Stock Forecast Tool, we see negative signals in our 10-day prediction window. Today’s vector of -0.20% moves to -1.15% in three sessions. Prediction data is uploaded after market close at 6 p.m., CST. Today’s data is based on market signals from the previous trading session.
(Want free training resources? Check our our training section for videos and tips!)
Volatility
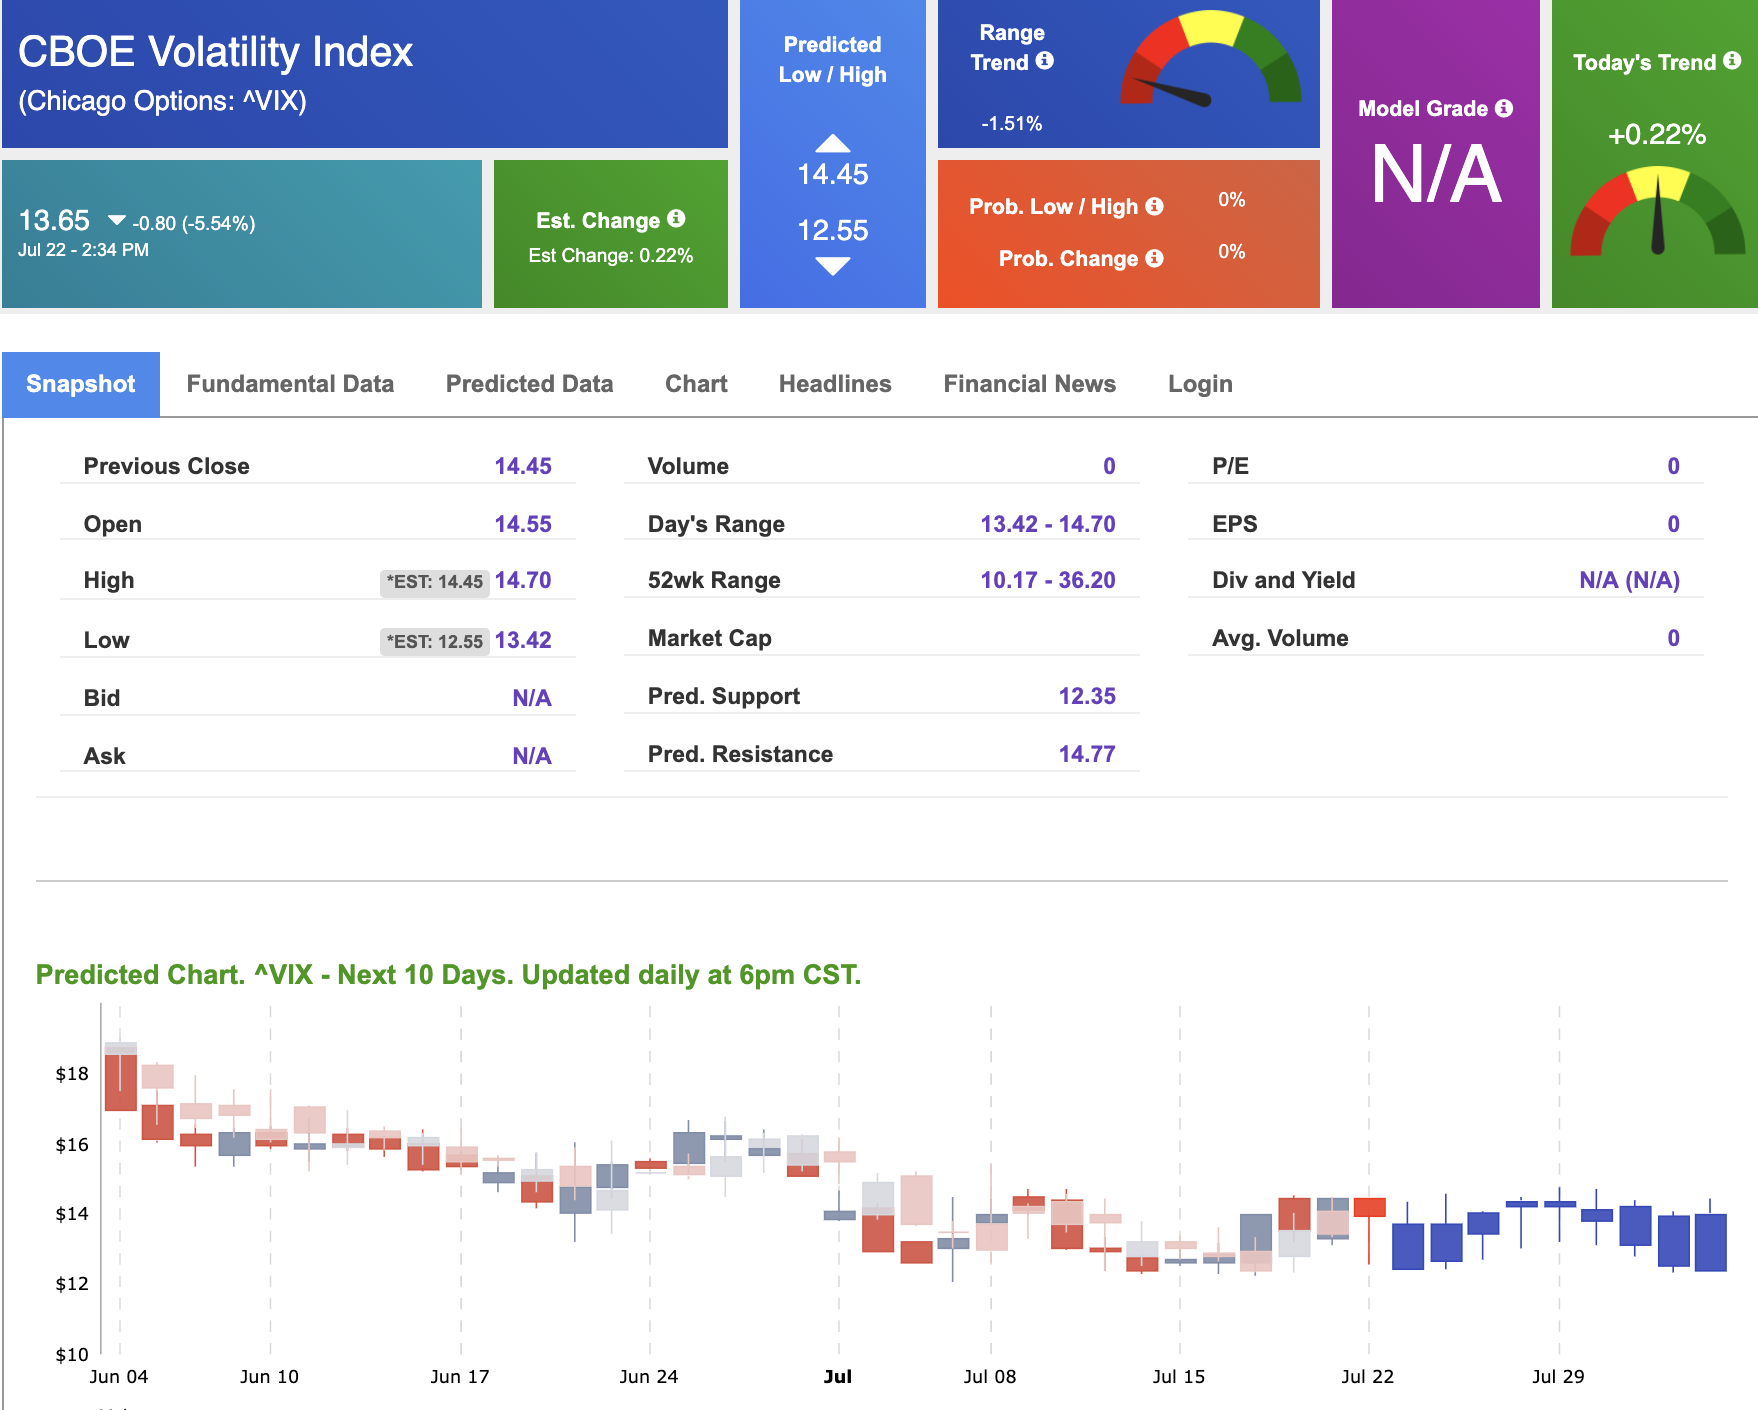
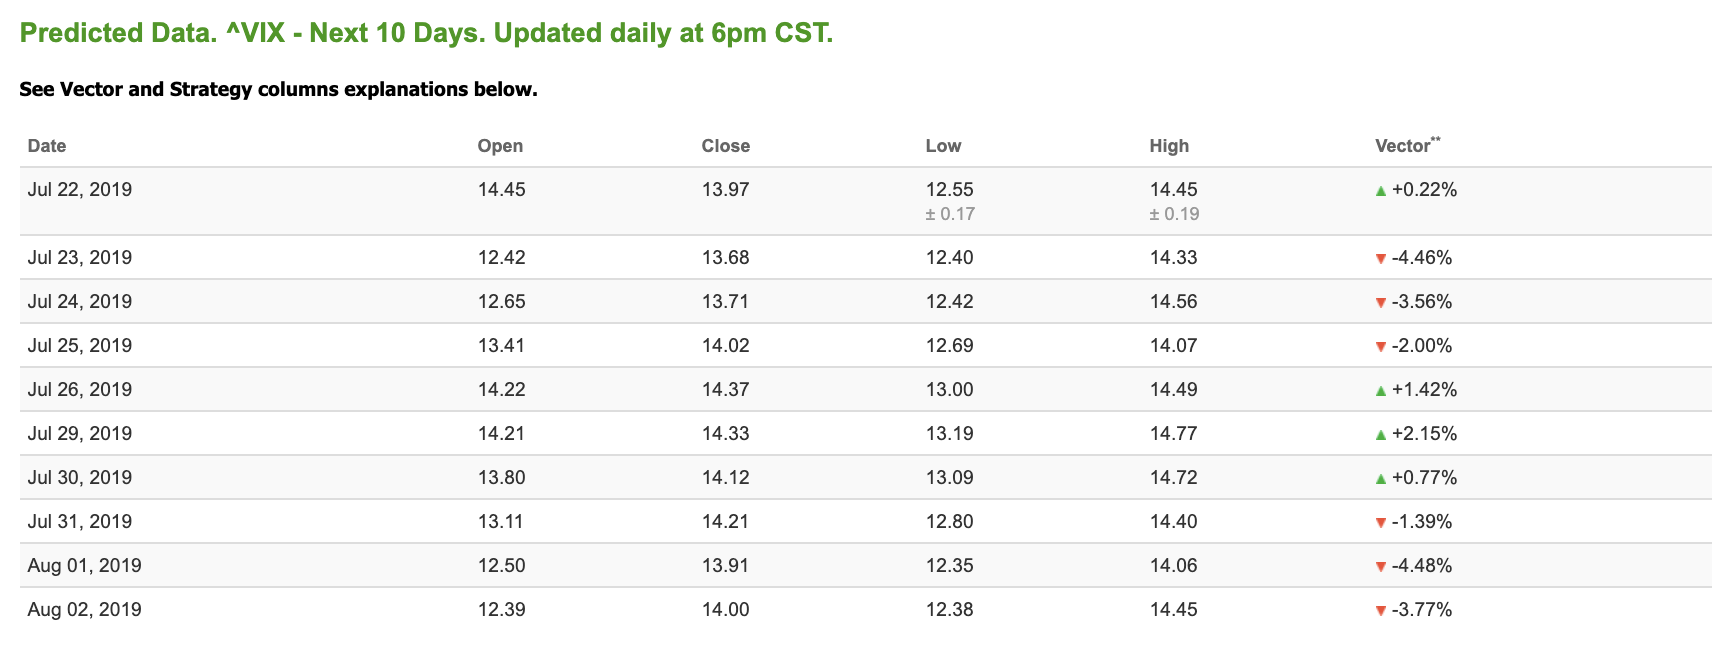
The CBOE Volatility Index (^VIX) is down 2.61% at $22.36 at the time of publication, and our 10-day prediction window shows negative signals. The predicted close for tomorrow is $17.15 with a vector of -17.87%. Prediction data is uploaded after market close at 6 p.m., CST. Today’s data is based on market signals from the previous trading session.
(Want free training resources? Check our our training section for videos and tips!)
