“Phase One” Deal Signed, Markets Hit Intraday Records
Partial U.S.-China trade agreement brings intraday record highs for U.S. stocks
Major U.S. indices set intraday record highs following today’s signing of the partial U.S.-China trade agreement and a strong start to Q4 earnings season. Chinese delegation in D.C. is due to sign the deal along with President Trump which will include an increase of Chinese purchased of U.S. manufacturing, agricultural, and energy products as well as additional measures for continued trade talks. Yesterday, strong big-bank earnings kicked off earnings season which continued today with Bank of America, United Health, and Goldman Sachs. Other key economic releases today include the Beige Book, Producer Price Index, as well as PNC and BlackRock earnings.
(Want free training resources? Check our our training section for videos and tips!)
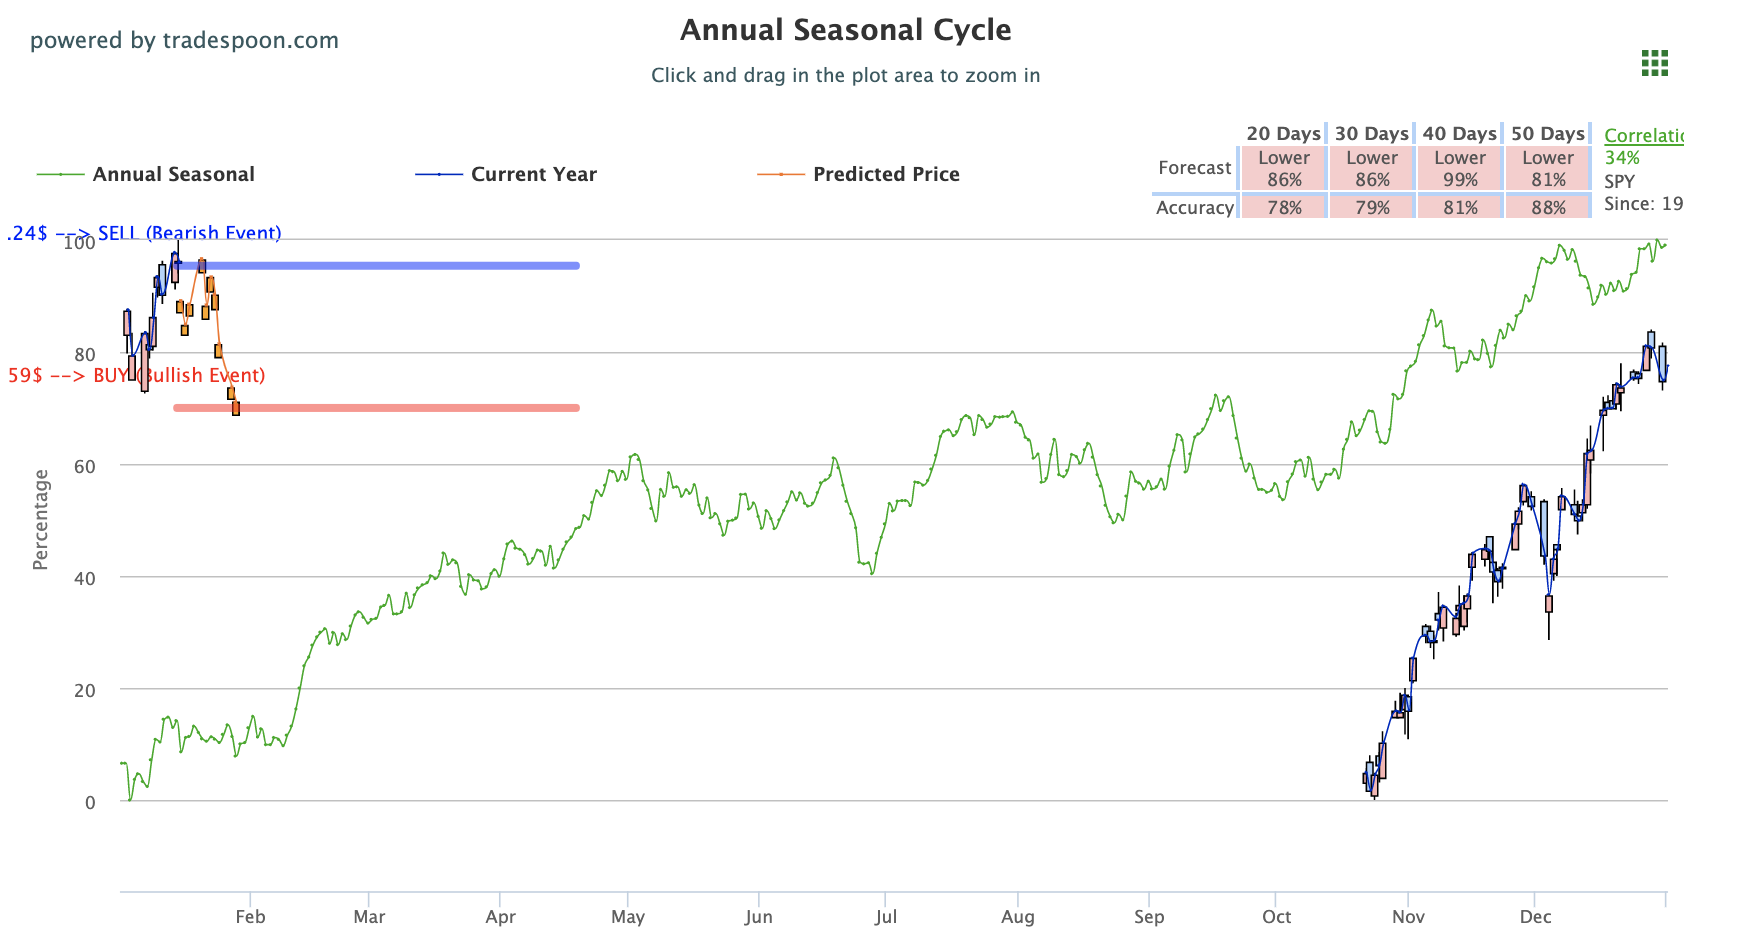
Currently, support and resistance levels remain at $320-$330 for they SPY and we will continue to look for buying opportunities near $320. We remain bullish in the short-term but also some shallow pullbacks during this earnings season. We encourage Market Commentary readers to maintain clearly defined stop-levels for all positions. For reference, the SPY Seasonal Chart is shown below:
All three major U.S. indices in green after the signing of the “phase one” trade deal
All three major U.S. indices closed in the green after the signing of the “phase one” trade deal. Vice Premier Liu He was in D.C. to sign, along with President Trump, as both sides agree to what is expected to be the first of several agreements. Both sides are looking to continue negotiations in the coming months with additional “phases” of the trade plan to be continuously rolled out. The current deal outlines promises by China to purchase additional U.S. agricultural, manufacturing, and energy products over the next two years. The deal sent U.S. stocks higher while Asian and European markets closed lower.
Positive earnings and economic reports also make impact on stocks
Also influencing markets today is the latest earnings and economic reports, which for the most part have been positive. Big-bank Q4 earnings kicked off earning season yesterday with strong Chase Citigroup data while also receiving the latest on Wells Fargo and Delta. Today, Bank of America released earnings before the market open which sent shares higher. Tomorrow CSX, PPG, and Morgan Stanley are due to release earnings while Friday we will see HDFC Bank, State Street, Citizens Financial, and JBHT.
“Modest” growth for the U.S. economy with a very strong labor market
Other key releases include today’s Beige Book which provides a good reading of the current economic condition throughout the twelve federal districts. The latest data indicated “modest” growth for the U.S. economy with a very strong labor market. Tomorrow, look for December retail data and the latest-weekly employment numbers.
(Want free training resources? Check our our training section for videos and tips!)
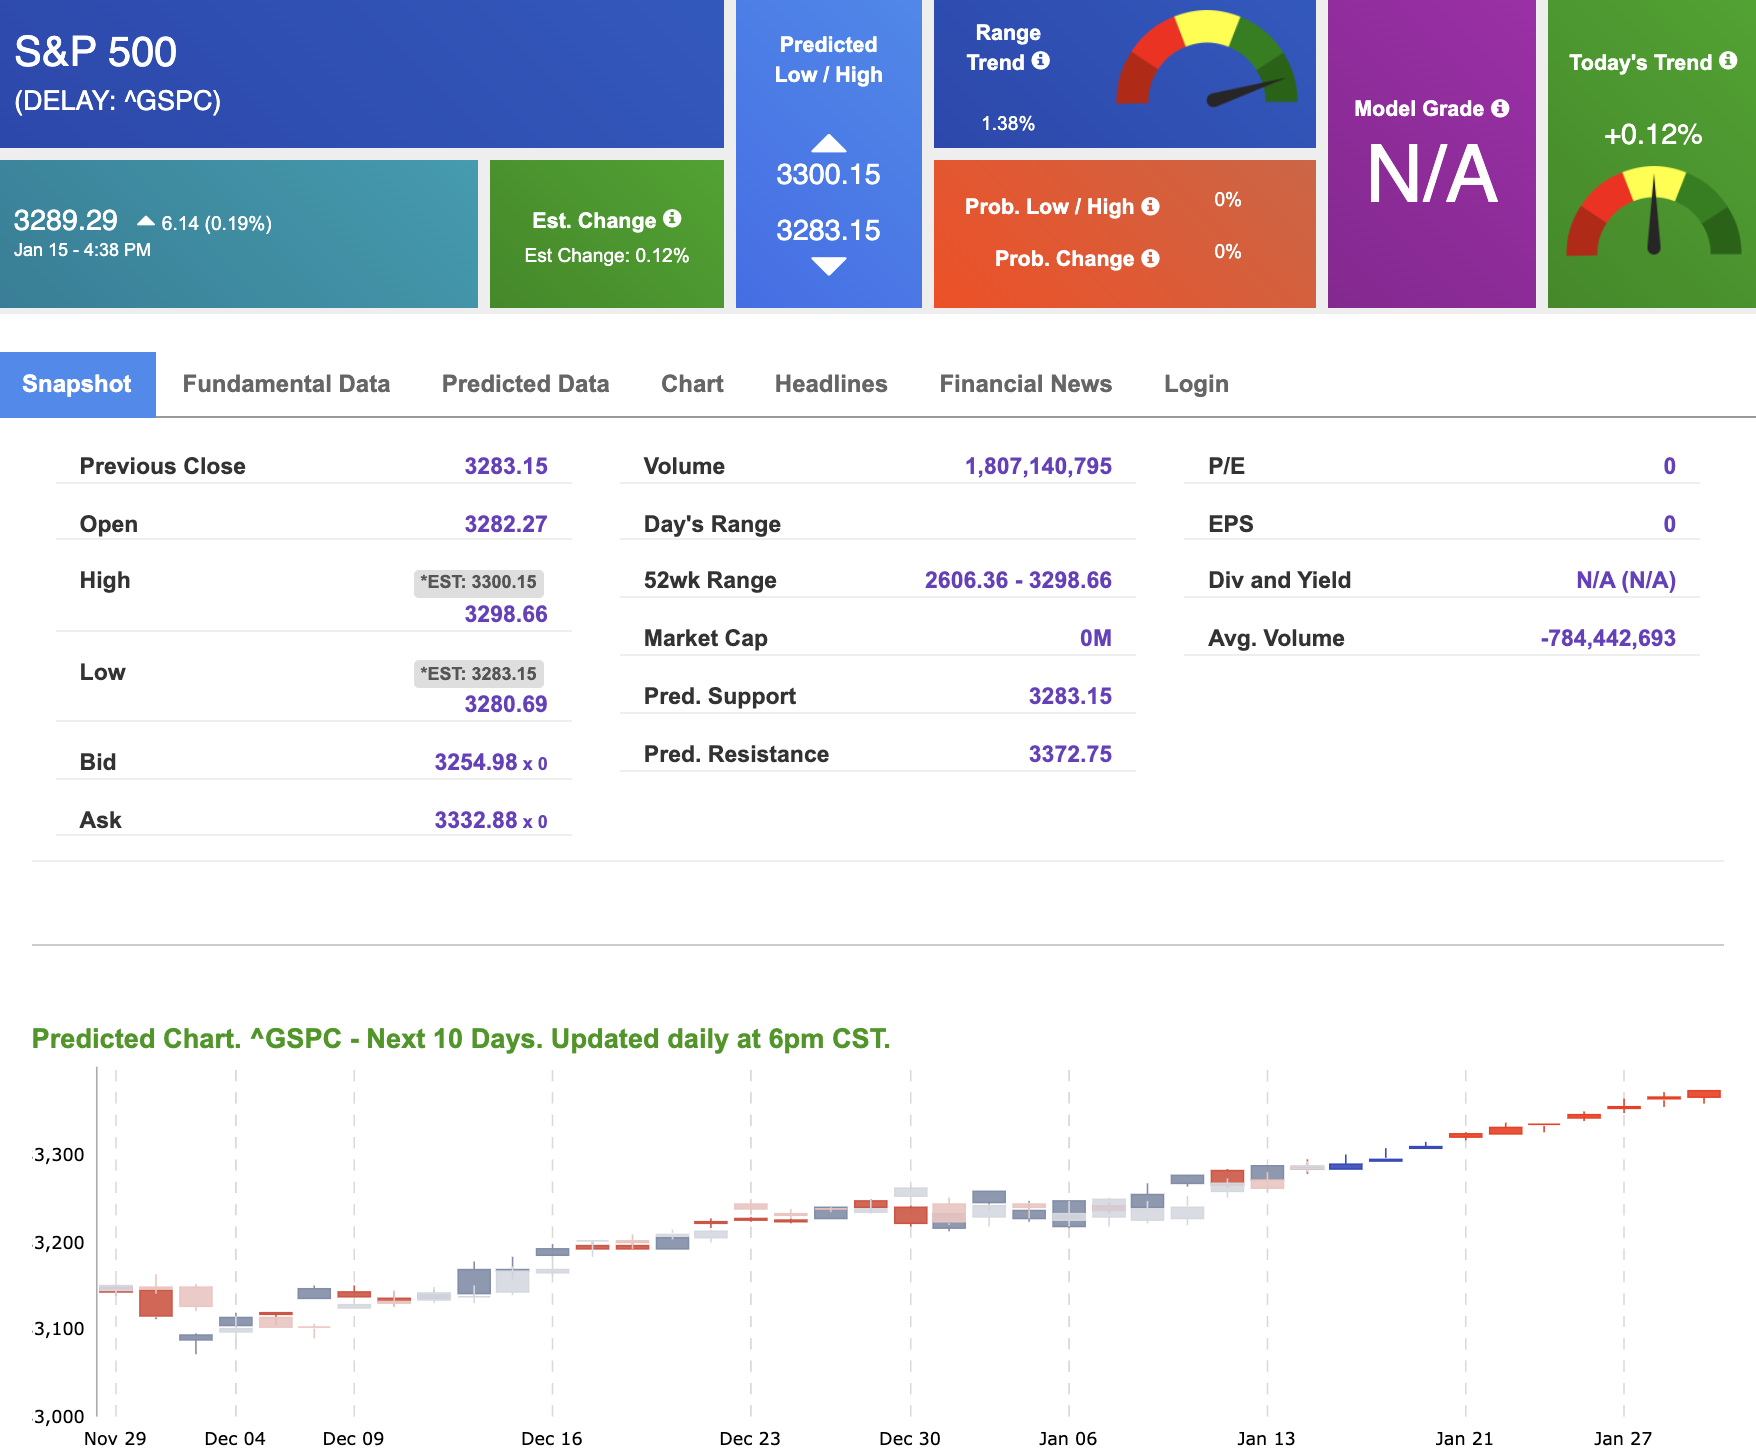
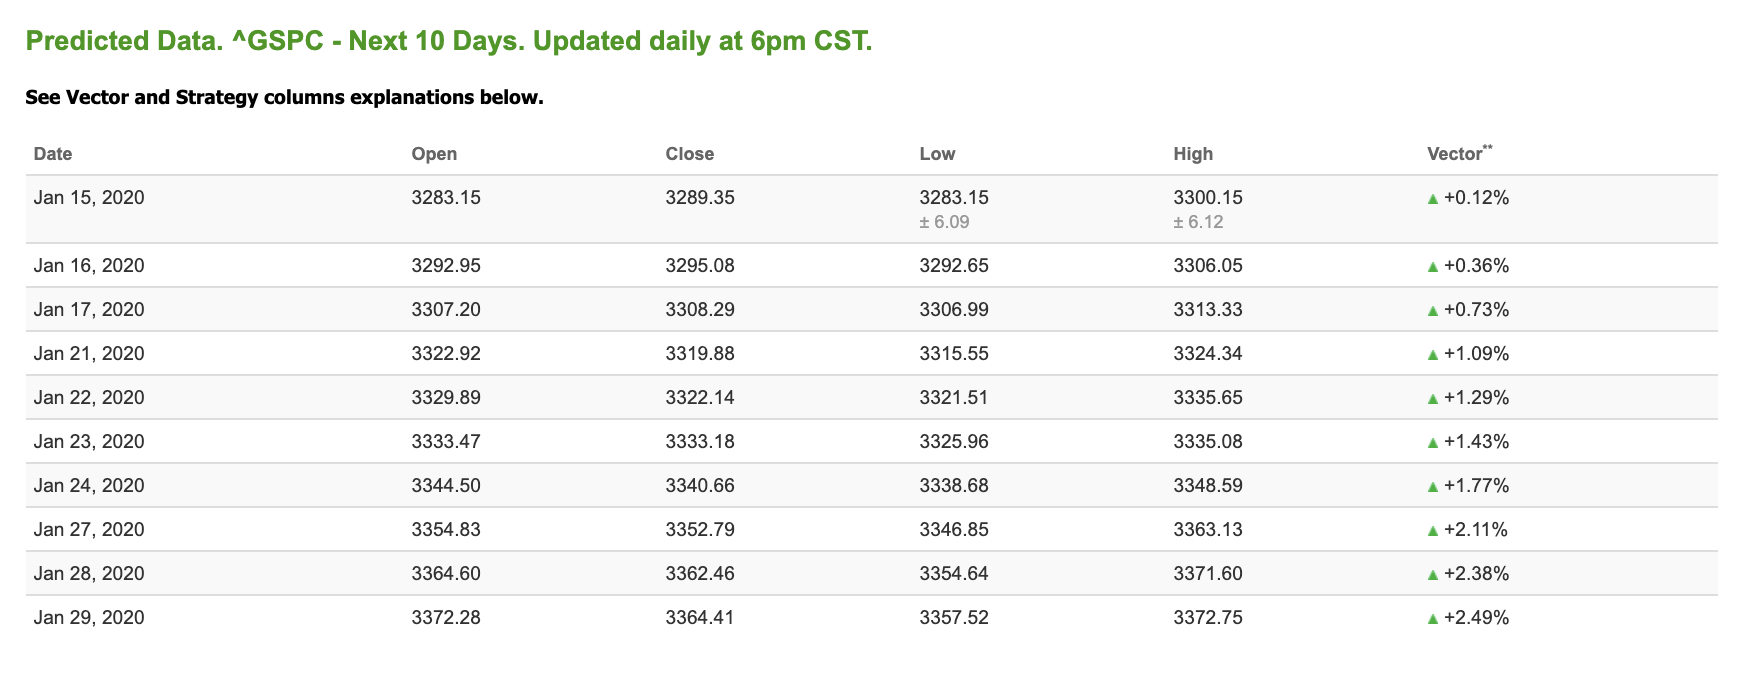
Using the “^GSPC” symbol to analyze the S&P 500 our 10-day prediction window shows a near-term positive outlook. Today’s vector figure of +0.12% moves to +1.29% in four trading sessions. Prediction data is uploaded after the market closes at 6 p.m. CST. Today’s data is based on market signals from the previous trading session.
I’ve created the ultimate trading program that picks winners over 75% of the time.
Brand-New Super-Platform.
I call it my all-new WeeklyTrader service
But, I’m not interested in selling out… I want to see how much money WeeklyTrader can make for me and for you!
CLICK HERE TO LEARN MORE
Highlight of a Recent Winning Trade
On January 10th, our ActiveTrader service produced a bullish recommendation for Apple Inc. (AAPL). ActiveTrader is included in all paid Tradespoon membership plans and is designed for day trading, with signals meant to last for 1-2 days.
Trade Breakdown
AAPL entered its forecasted Strategy B Entry 1 price range $309.63(± 1.05) in its third hour of trading that day and passed through its Target price of $312.73 in the second hour of trading the following trading. The Stop Loss price was set at $306.53.

Thursday Morning Featured Symbol
*Please note: At the time of publication Vlad Karpel does have a position in the featured symbol, MA. Our featured symbol is part of your free subscription service. It is not included in any paid Tradespoon subscription service. Vlad Karpel only trades his own personal money in paid subscription services. If you are a paid subscriber, please review your Premium Member Picks, ActiveTrader or MonthlyTrader recommendations. If you are interested in receiving Vlad’s personal picks, please click here.

Our featured symbol for Thursday is Monster Beverage Corp. (MNST). MNST is showing a positive vector trend in our Stock Forecast Toolbox’s 10-day forecast. This stock is assigned a Model Grade of (B) indicating it ranks in the top 25th percentile for accuracy for current-day predicted support and resistance, relative to our entire data universe.

The stock is trading at $65.88 at the time of publication, with a +0.35% vector figure.
Prediction data is uploaded after the market close at 6 p.m., CST. Today’s data is based on market signals from the previous trading session.
Note: The Vector column calculates the change of the Forecasted Average Price for the next trading session relative to the average of actual prices for the last trading session. The column shows the expected average price movement “Up or Down”, in percent. Trend traders should trade along the predicted direction of the Vector. The higher the value of the Vector the higher its momentum.
Oil
West Texas Intermediate for Crude Oil delivery (CL.1) is priced at $58.06 per barrel, down 1.66% from the open, at the time of publication.
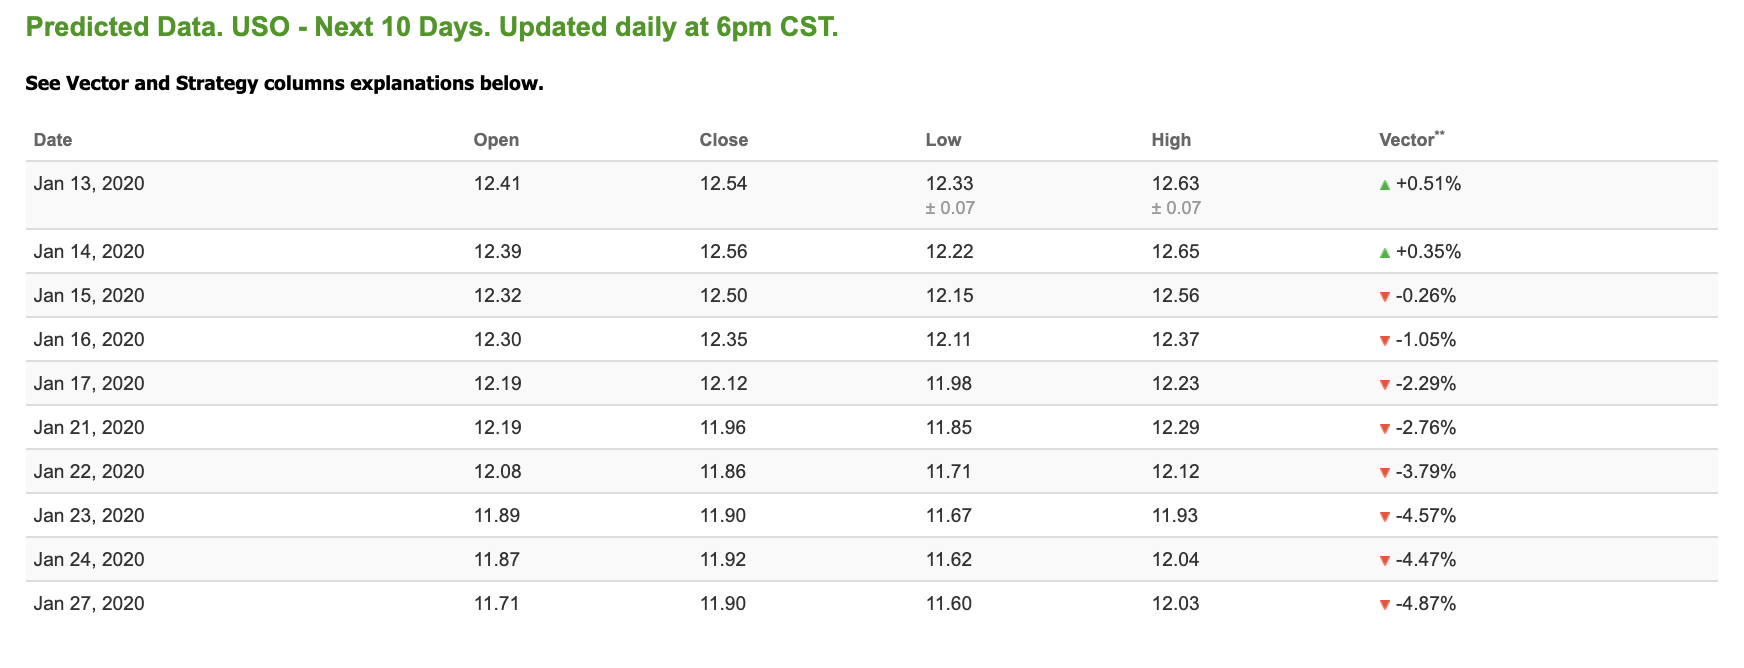
Looking at USO, a crude oil tracker, our 10-day prediction model shows mixed signals. The fund is trading at $12.2 at the time of publication. Vector figures show 0.51% today, which turns to -1.05% in three trading sessions. Prediction data is uploaded after the market close at 6 p.m., CST. Today’s data is based on market signals from the previous trading session.

Gold
The price for the Gold Continuous Contract (GC00) is down 0.72% at $1,548.70 at the time of publication.
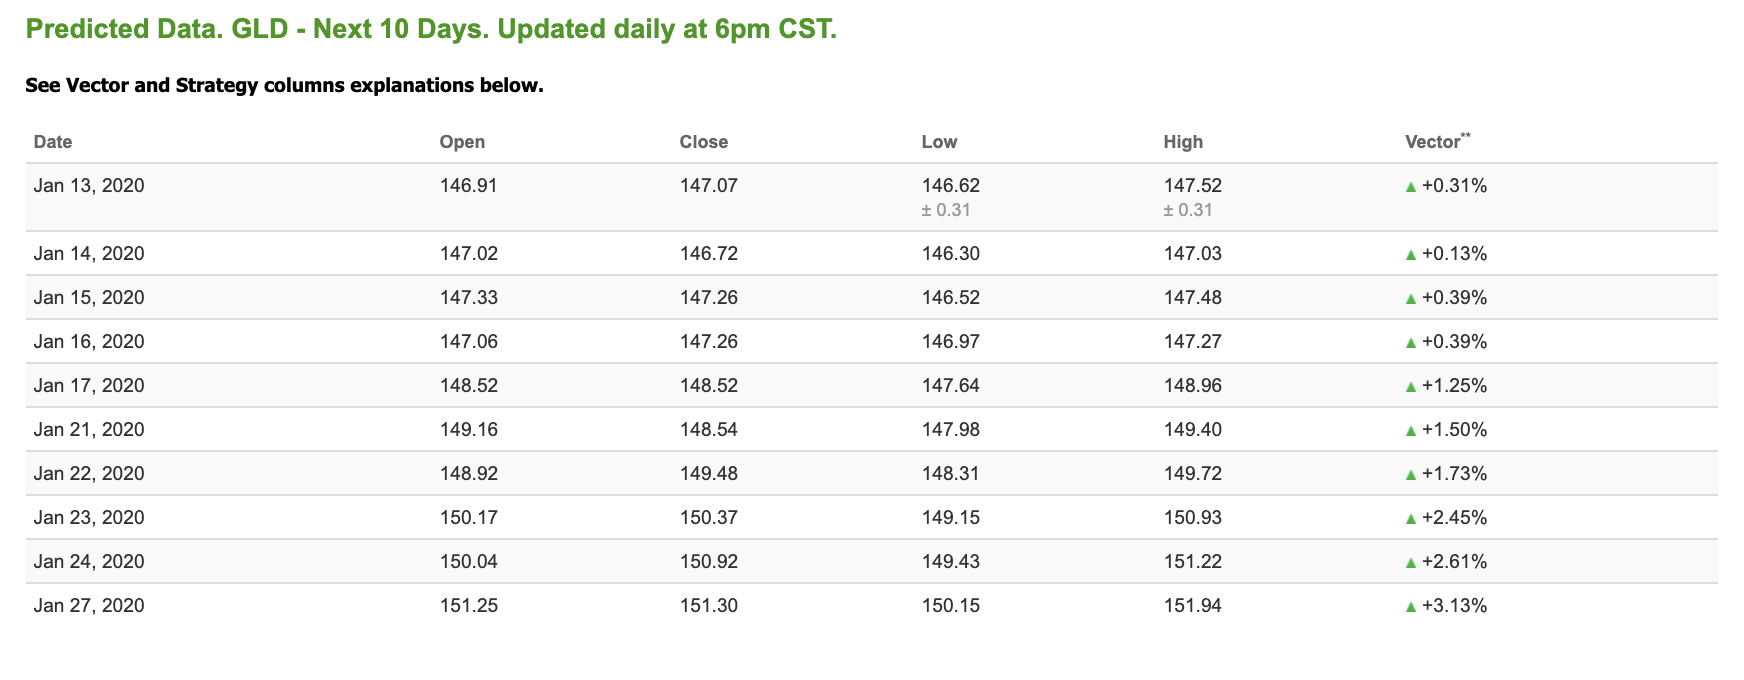
Using SPDR GOLD TRUST (GLD) as a tracker in our Stock Forecast Tool, the 10-day prediction window shows positive signals. The gold proxy is trading at $145.82, at the time of publication. Vector signals show +0.31% for today. Prediction data is uploaded after the market close at 6 p.m., CST. Today’s data is based on market signals from the previous trading session.

Treasuries
The yield on the 10-year Treasury note is up 1.54% at 1.85% at the time of publication.
The yield on the 30-year Treasury note is up 1.10% at 2.30% at the time of publication.
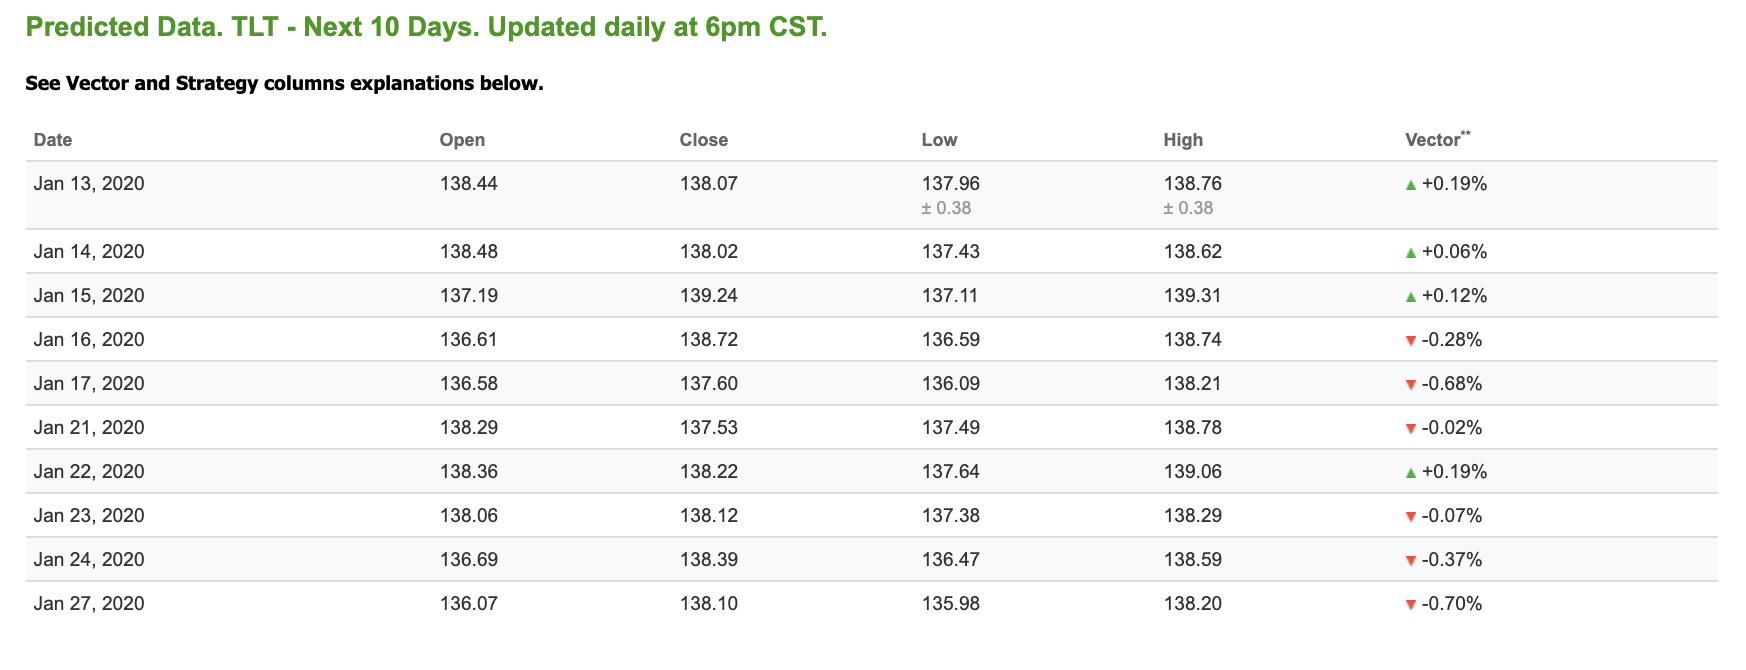
Using the iShares 20+ Year Treasury Bond ETF (TLT) as a proxy for bond prices in our Stock Forecast Tool, we see mixed signals in our 10-day prediction window. Today’s vector of +0.19% moves to -0.68% in four sessions. Prediction data is uploaded after the market close at 6 p.m., CST. Today’s data is based on market signals from the previous trading session.
(Want free training resources? Check our our training section for videos and tips!)

Volatility
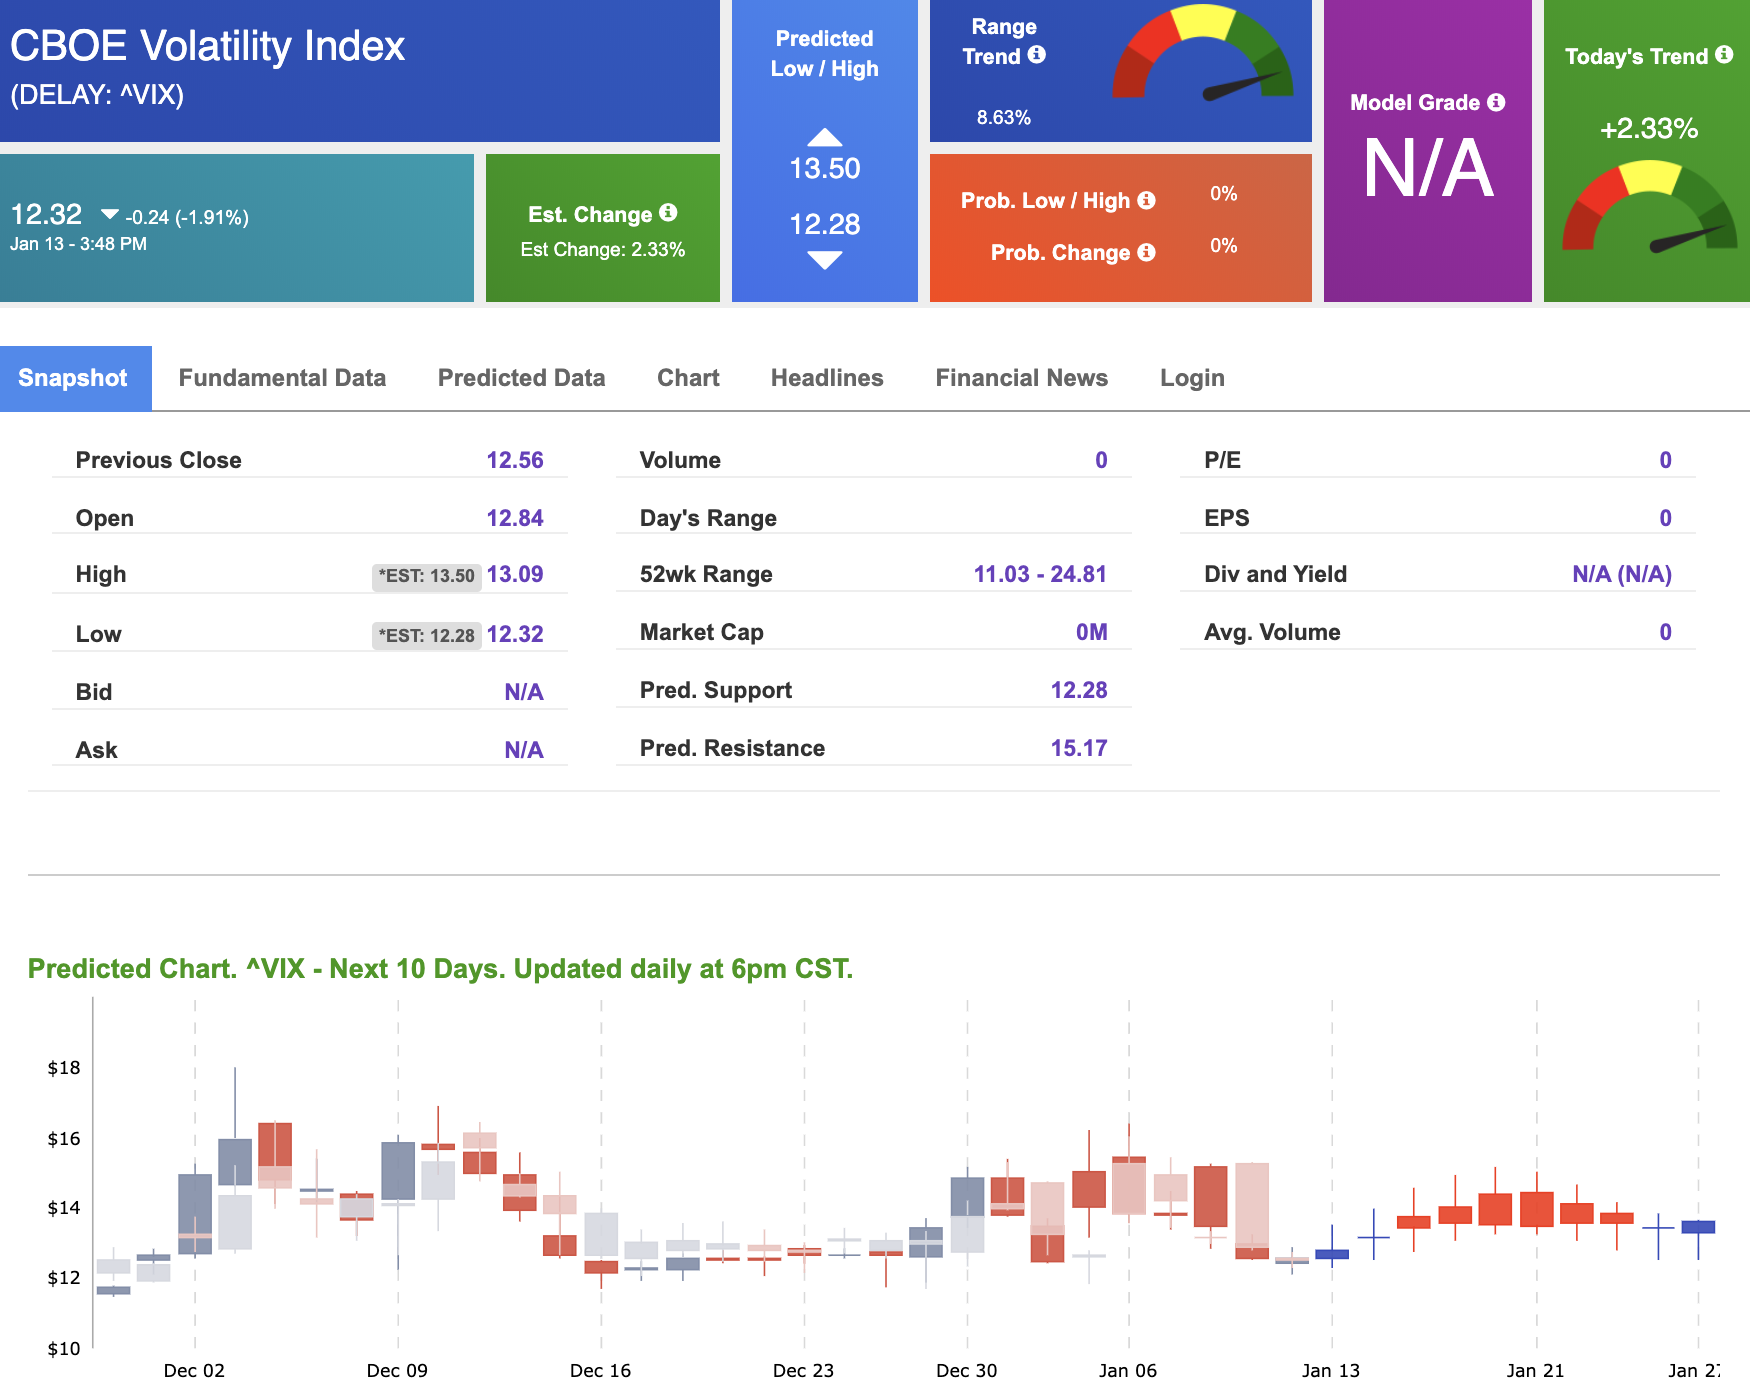
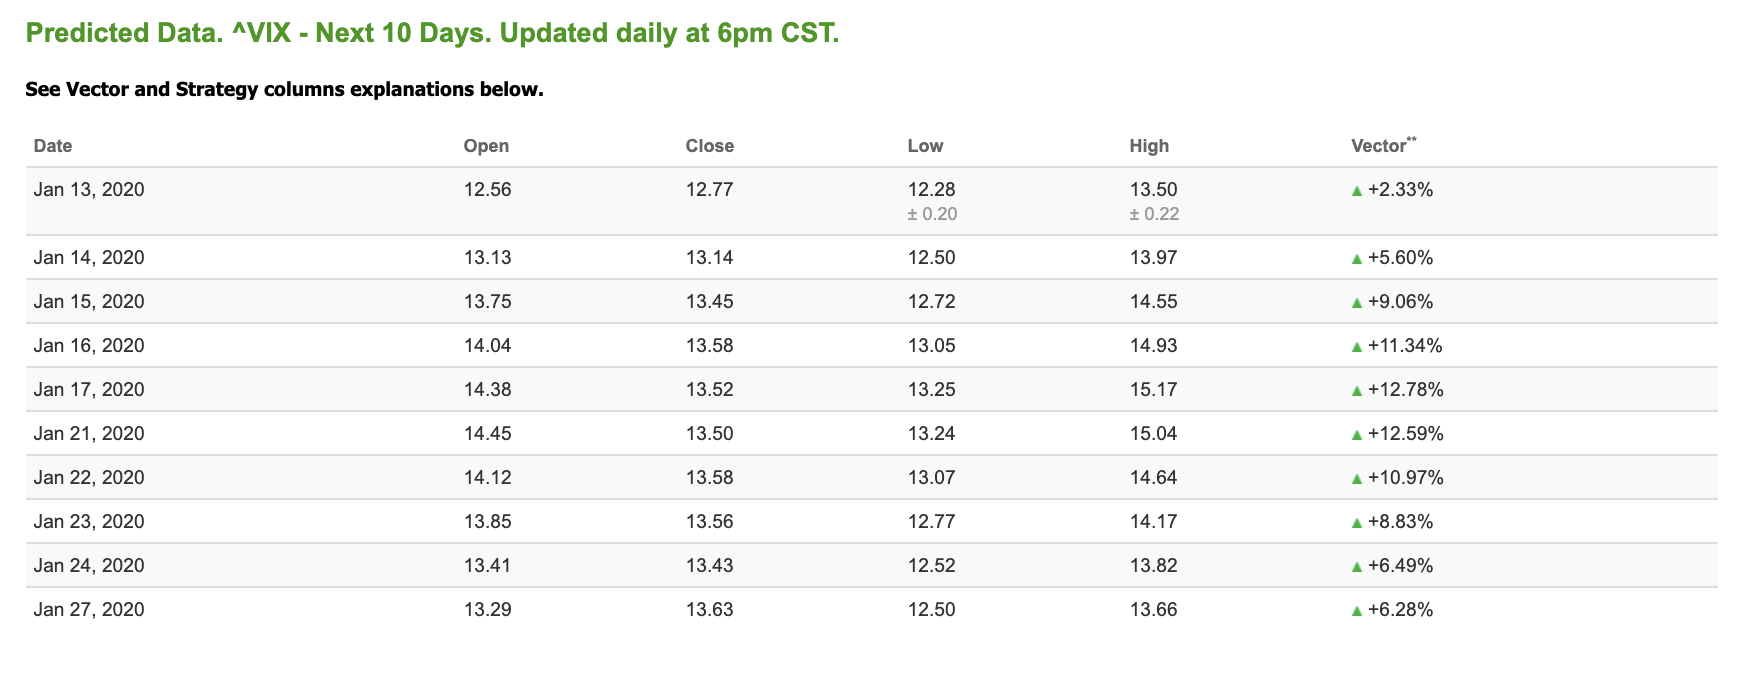
The CBOE Volatility Index (^VIX) is $12.32 at the time of publication, and our 10-day prediction window shows positive signals. Prediction data is uploaded after the market close at 6 p.m., CST. Today’s data is based on market signals from the previous trading session.
