
Positive Q2 Earnings and The Latest Beige Book Support U.S. Markets
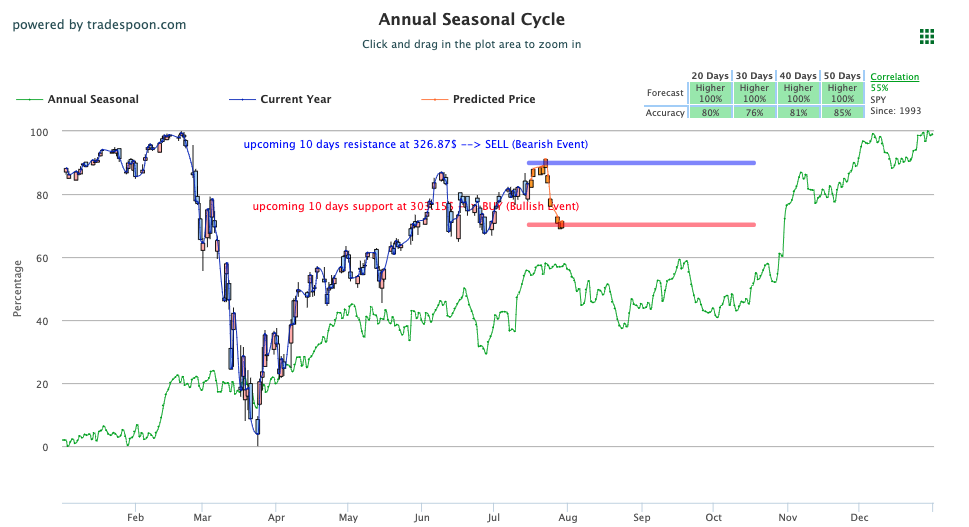
Our models are projecting the SPY to trade between $296-$330 level; we are raising our “worst-case” short-term scenario to $296 as sector leadership widens and China continues to break out from their recent trading channel. All three major U.S. indices traded higher Tuesday and Wednesday following positive news regarding a COVID vaccine from Moderna.
Earnings season continue with full speed
Corporate earnings season got off to a good start yesterday as major banks Chase, Citi, and Wells Fargo reported Q2 data that topped expectations. Today’s before market-open releases were also well-received with shares of Goldman Sachs and IBM rising, while UnitedHealth Group saw shares lower after beating profit expectations but falling short on revenue.
Latest Beige Book reported an increase in economic activity throughout the twelve Federal districts
Another key release today came from the Fed as the latest Beige Book reported an increase in economic activity throughout the twelve Federal districts. An increase in employment, as well as some additional layoffs, was noted while consumer spending showed a robust rebound in the last quarter. Keeping this in mind, we still believe the market is overbought. We will continue monitoring VIX, as the market can overshoot support and resistance levels when VIX is trading near $30 level. Aggressive traders can consider adding to their positions until the market reaches $320 level for SPY and we will look to be buyers into any short-term corrections. Short-term traders could consider adding to positions when SPY nears $293 and reduce exposure to the market at $320. We encourage maintaining clearly defined stop-levels for all positions. For reference, the SPY Seasonal Chart is shown below:

Key U.S. Economic Reports/Events This Week
- Beige Book – Wednesday, July 15th
- Weekly Jobless Claims (7/11) – Thursday, July 16th
- Retail Sales (June) – Thursday, July 16th
- Business Inventories (May) – Thursday, July 16th
- Housing Starts (June) – Friday, July 17th
- Building Permits (June) – Friday, July 17th
- Consumer Sentiment Index (July) – Friday, July 17th
Upcoming Earnings
- UNH – UnitedHealth Group – Wednesday, July 15th
- IBM – International Business Machines – Wednesday, July 15th
- UNH – UnitedHealth Group – Wednesday, July 15th
- GS – Goldman Sachs Group – Wednesday, July 15th
- PGR – The Progressive Corp. – Wednesday, July 15th
- PNC – The PNC Financial Services Group – Wednesday, July 15th
- EBAY – eBay Inc. – Wednesday, July 15th
- MSFT – Microsoft Corporation – Thursday, July 16th
- JNJ – Johnson & Johnson – Thursday, July 16th
- NFLX – Netflix – Thursday, July 16th
- BAC – Bank of America – Thursday, July 16th
- ABT – Abbott Laboratories – Thursday, July 16th
- HON – Honeywell International – Thursday, July 16th
- MS – Morgan Stanley – Thursday, July 16th
- HDFC – HDFC Bank – Friday, July 17th
- BLK – Blackrock, Inc. – Friday, July 17th
(Want free training resources? Check our our training section for videos and tips!)
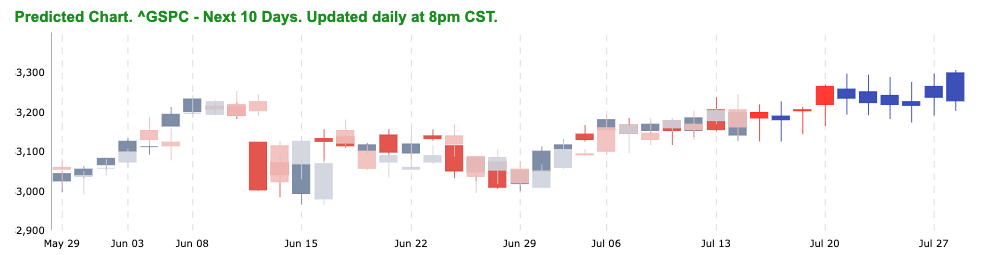
For reference, the S&P 10-Day Forecast is shown below:
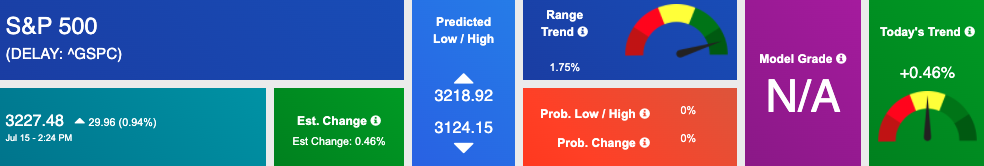
Using the “^GSPC” symbol to analyze the S&P 500 our 10-day prediction window shows a near-term positive outlook. Prediction data is uploaded after the market closes at 6 p.m. CST. Today’s data is based on market signals from the previous trading session.
Vlad’s Portfolio Lifetime Membership!
DO AS I DO… AS I DO IT WATCH LIVE AS I WORK THE MARKETS! TRY IT NOW RISK-FREE!
Click Here to Sign Up
Thursday Morning Featured Symbol
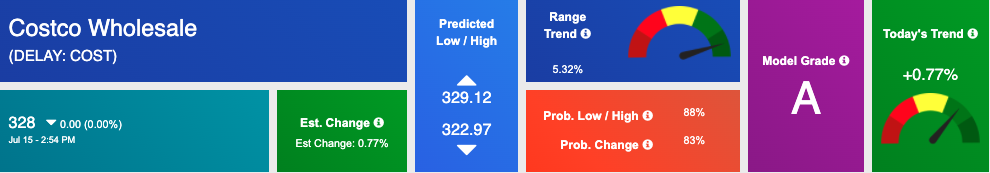
Our featured symbol for Thursday is Costco Wholesale (COST). COST is showing a steady vector in our Stock Forecast Toolbox’s 10-day forecast. This stock is assigned a Model Grade of (A) indicating it ranks in the top 10th percentile for accuracy for current-day predicted support and resistance, relative to our entire data universe.
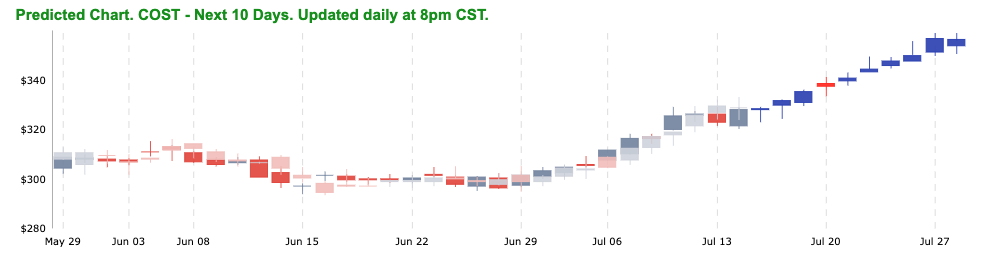
The stock is trading at $328.00, with a vector of 0.77% at the time of publication.
Prediction data is uploaded after the market close at 6 p.m., CST. Today’s data is based on market signals from the previous trading session.
(Want free training resources? Check our our training section for videos and tips!)
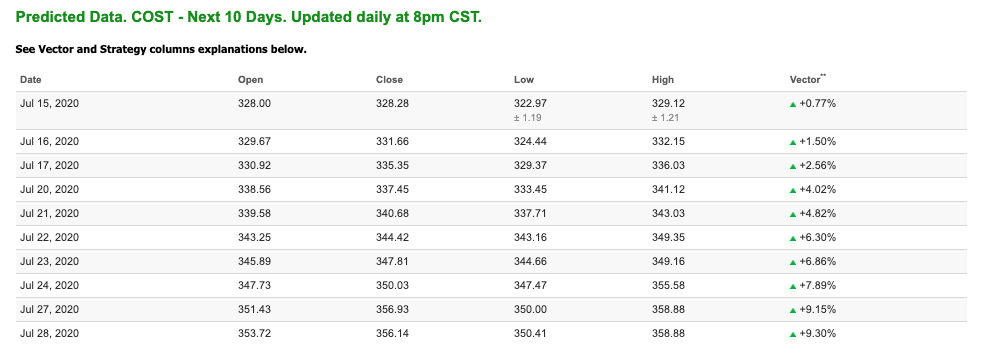
Note: The Vector column calculates the change of the Forecasted Average Price for the next trading session relative to the average of actual prices for the last trading session. The column shows the expected average price movement “Up or Down”, in percent. Trend traders should trade along the predicted direction of the Vector. The higher the value of the Vector the higher its momentum.
*Please note: At the time of publication Vlad Karpel does not have a position in the featured symbol, COST. Our featured symbol is part of your free subscription service. It is not included in any paid Tradespoon subscription service. Vlad Karpel only trades his money in paid subscription services. If you are a paid subscriber, please review your Premium Member Picks, ActiveTrader, or MonthlyTrader recommendations. If you are interested in receiving Vlad’s picks, please click here.
Highlight of a Winning Trade
On July 6th, our ActiveTrader service produced a bullish recommendation for PayPal Holdings (PYPL). ActiveTrader is included in several Tradespoon membership plans and is designed for day trading, with signals meant to last for 1-2 days.
Trade Breakdown
PYPL entered its forecasted Strategy B Entry 1 price range $177.21(± 1.24) in the second to last hour of trading that day(7/6/20) and passed through its Target price of $178.98 in the first hour of trading on 7/8/20. The Stop Loss price was set at $116.64.

Oil
West Texas Intermediate for Crude Oil delivery (CL.1) is priced at $41.01 per barrel, up 1.81% from the open, at the time of publication.
Looking at USO, a crude oil tracker, our 10-day prediction model shows mixed signals. The fund is trading at $28.88 at the time of publication. Prediction data is uploaded after the market close at 6 p.m., CST. Today’s data is based on market signals from the previous trading session.
(Want free training resources? Check our our training section for videos and tips!)

Gold
The price for the Gold Continuous Contract (GC00) is up 0.02% at $1,813.80 at the time of publication.
Using SPDR GOLD TRUST (GLD) as a tracker in our Stock Forecast Tool, the 10-day prediction window shows mixed signals. The gold proxy is trading at $170.35, at the time of publication. Vector signals show +0.19% for today. Prediction data is uploaded after the market close at 6 p.m., CST. Today’s data is based on market signals from the previous trading session.
(Want free training resources? Check our our training section for videos and tips!)

Treasuries
The yield on the 10-year Treasury note is up, at 0.634% at the time of publication.
The yield on the 30-year Treasury note is up, at 1.333% at the time of publication.
Using the iShares 20+ Year Treasury Bond ETF (TLT) as a proxy for bond prices in our Stock Forecast Tool, we see mixed signals in our 10-day prediction window. Prediction data is uploaded after the market close at 6 p.m., CST. Today’s data is based on market signals from the previous trading session.
(Want free training resources? Check our our training section for videos and tips!)

Volatility
The CBOE Volatility Index (^VIX) is $27.94 at the time of publication, and our 10-day prediction window shows mixed signals. Prediction data is uploaded after the market close at 6 p.m., CST. Today’s data is based on market signals from the previous trading session.
