Suez Canal Blockage Resolved, Volatility Concerns Pressure Markets
U.S. Benchmarks traded modestly to mixed results following U.S.-based hedge fund Archegos Capital Management selling over $30 billion in holdings, sparking international volatility concerns. To start the shortened trade week, markets will be closed on Friday in observance of Good Friday, both the S&P and Nasdaq closed marginally in the red while the Dow Jones finished 0.30% higher.
Globally, both Asian and European markets finished in the green as the large container-ship blocking the Suez Canal, responsible for 12% of global trade, was freed earlier today. On the COVID-front, vaccine distribution continues to increase both in the U.S. and globally, offering some positive market sentiment. President Joe Biden recently declared plans to increase vaccine eligibility, stating 90% of U.S. adults will be eligible in three weeks. Key March employment data will release this week with the ADP report on Wednesday, unemployment data on Friday.
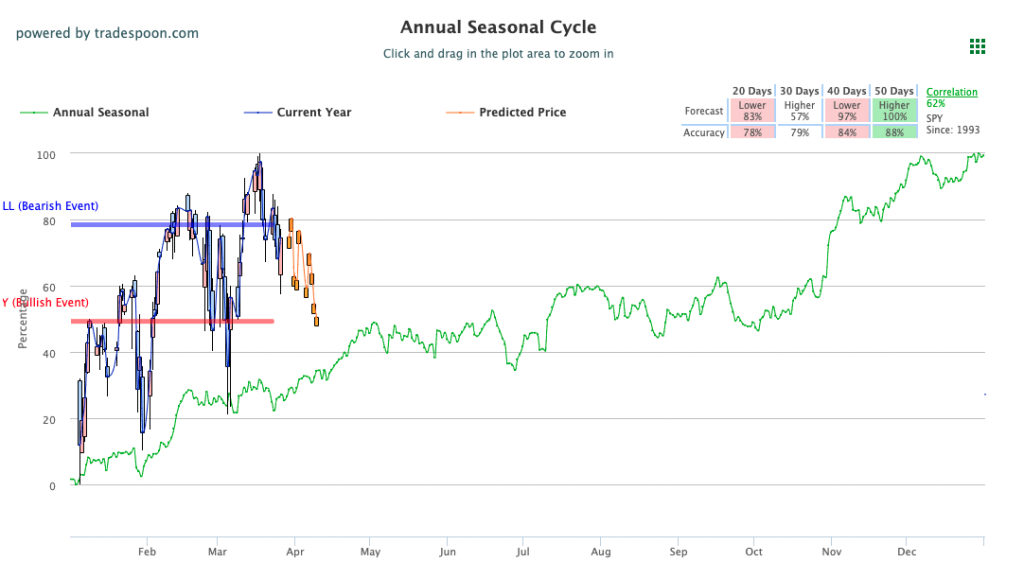
With the strong recent rebound and deteriorating momentum behind treasury and currency markets, it is only a matter of time for the $SPY to break above the $400 level. We continue seeing momentum behind the bulls deteriorating and we expect a short-term correction this week or the next, moving back to the 50-day moving average. Until an additional breakout is maintained, our models are projecting the SPY to trade in the range of $375-$397. The next level of support is set at the 50-day moving average of $380-$385 and we encourage all market commentary readers to maintain clearly defined stop-levels for all positions. For reference, the SPY Seasonal Chart is shown below:
Key U.S. Economic Reports/Events This Week:
- Consumer Confidence Index (March) – Tuesday
- ADP Employment Report (March) – Wednesday
- Weekly Jobless Claims (3/27) – Thursday
- Markit Manufacturing PMI (March) – Thursday
- Nonfarm Payrolls (March) – Friday
- Unemployment Rate (March) – Friday
- Average Hourly Earnings (March)
- U.S. Markets Closed (Good Friday)
‘If you’re looking for free trading resources… click here’
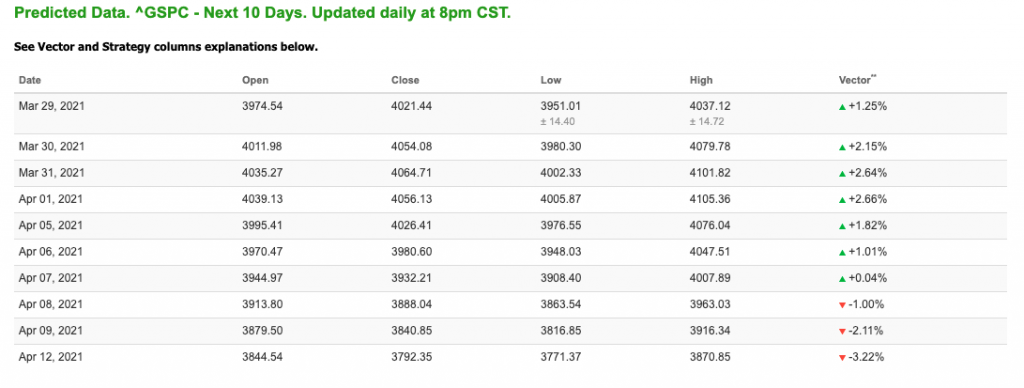
For reference, the S&P 10-Day Forecast is shown below:
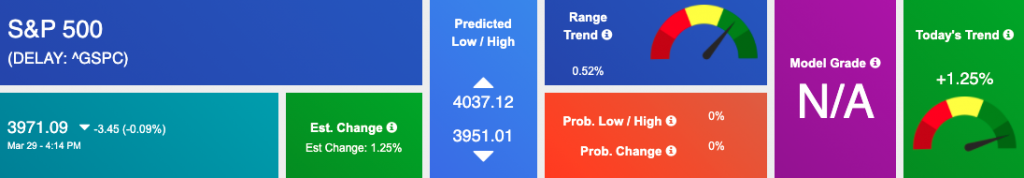
Using the “^GSPC” symbol to analyze the S&P 500 our 10-day prediction window shows a near-term mixed outlook. Prediction data uploaded after the market closes at 6 p.m. CST. Today’s data is based on market signals from the previous trading session.
Vlad’s Portfolio Lifetime Membership!
DO AS I DO… AS I DO IT WATCH LIVE AS I WORK THE MARKETS! TRY IT NOW RISK-FREE!
Click Here to Sign Up
Tuesday Morning Featured Symbol
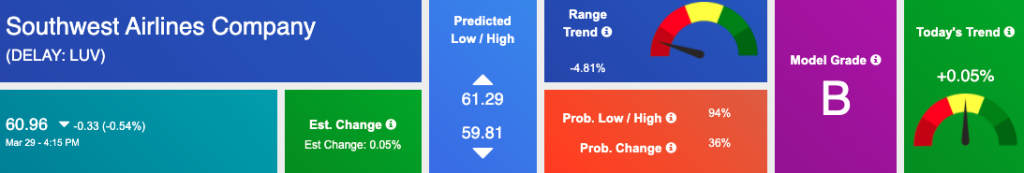
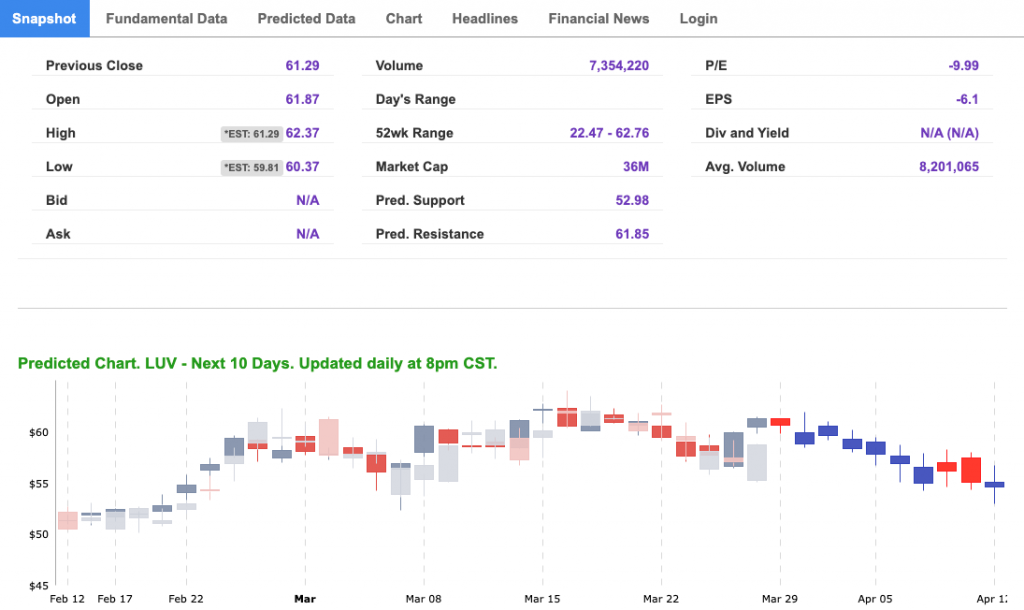
Our featured symbol for Tuesday is Southwest Airlines Company (LUV). LUV is showing a steady vector in our Stock Forecast Toolbox’s 10-day forecast.
The stock is trading at $60.96 with a vector of +0.05% at the time of publication.
10-Day Prediction data uploaded after the market close at 6 p.m., CST. Today’s data is based on market signals from the previous trading session.

Note: The Vector column calculates the change of the Forecasted Average Price for the next trading session relative to the average of actual prices for the last trading session. The column shows the expected average price movement “Up or Down”, in percent. Trend traders should trade along the predicted direction of the Vector. The higher the value of the Vector the higher its momentum.
*Please note: At the time of publication Vlad Karpel does have a position in the featured symbol, LUV. Our featured symbol is part of your free subscription service. Not included in any paid Tradespoon subscription service. Vlad Karpel only trades his money in paid subscription services. If you are a paid subscriber, please review your Premium Member Picks, ActiveTrader, or MonthlyTrader recommendations. If you are interested in receiving Vlad’s picks, please click here.
Oil
West Texas Intermediate for Crude Oil delivery (CL.1) is priced at $61.61 per barrel, up 1.05% at the time of publication.
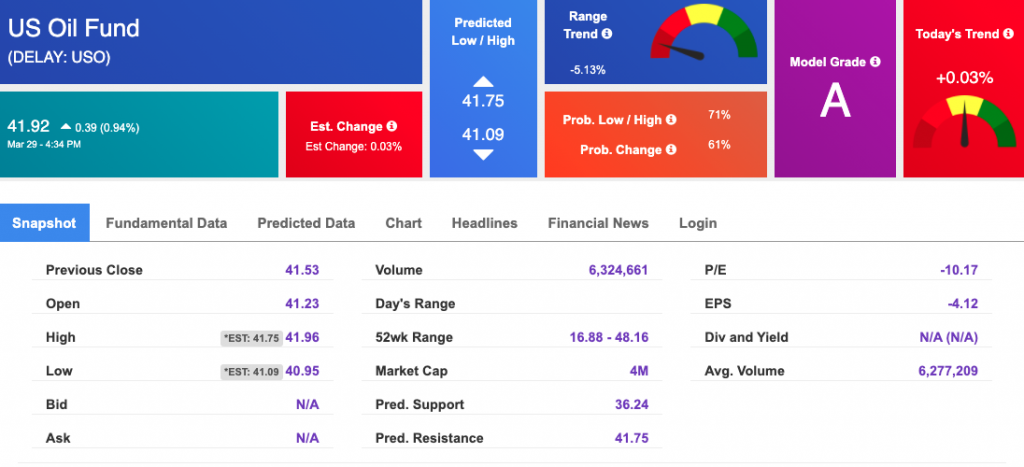
Looking at USO, a crude oil tracker, our 10-day prediction model shows mixed signals. The fund is trading at $41.92 at the time of publication. Prediction data uploaded after the market close at 6 p.m., CST. Today’s data is based on market signals from the previous trading session.
Gold
The price for the Gold Continuous Contract (GC00) is down 1.28% at $1710.10 at the time of publication.
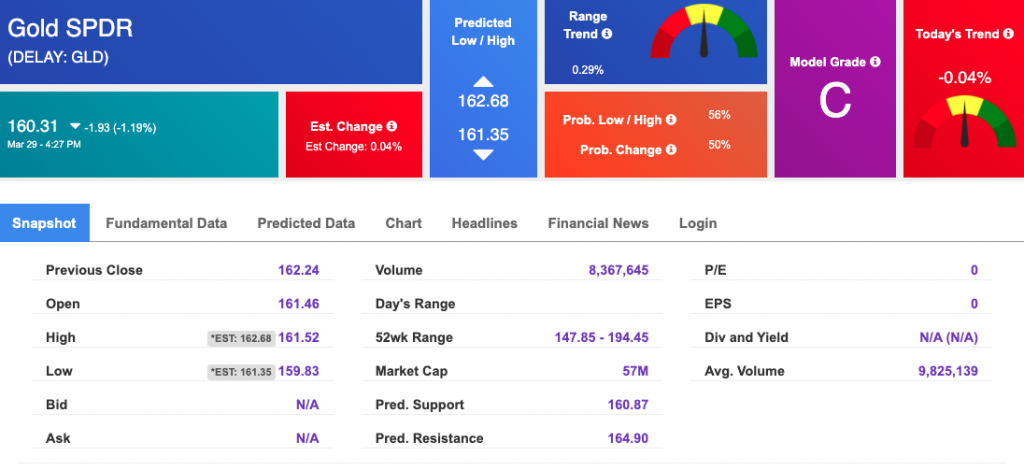
Using SPDR GOLD TRUST (GLD) as a tracker in our Stock Forecast Tool, the 10-day prediction window shows mixed signals. The gold proxy is trading at $160.31 at the time of publication. Vector signals show -0.04% for today. Prediction data uploaded after the market close at 6 p.m., CST. Today’s data is based on market signals from the previous trading session.
Treasuries
The yield on the 10-year Treasury note is up, at 1.715% at the time of publication.
The yield on the 30-year Treasury note is up, at 2.412% at the time of publication.
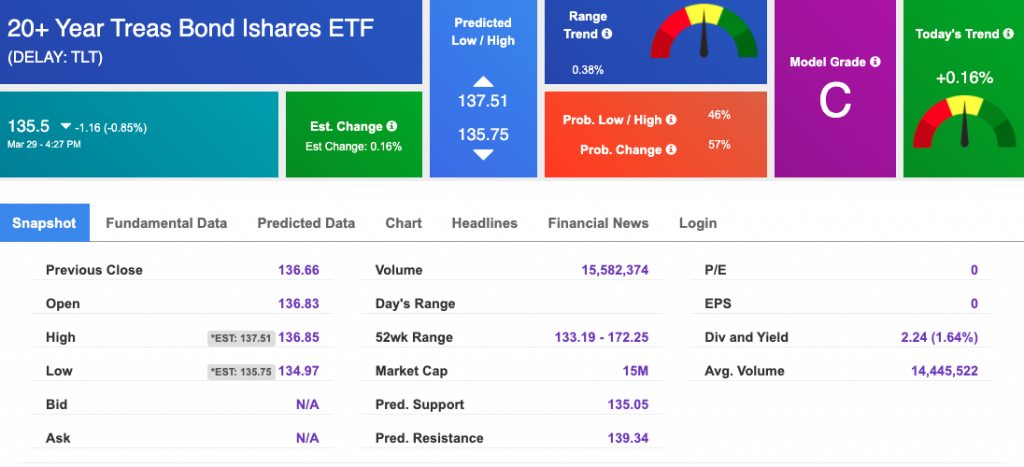
Using the iShares 20+ Year Treasury Bond ETF (TLT) as a proxy for bond prices in our Stock Forecast Tool, we see mixed signals in our 10-day prediction window. Prediction data uploaded after the market close at 6 p.m., CST. Today’s data is based on market signals from the previous trading session.
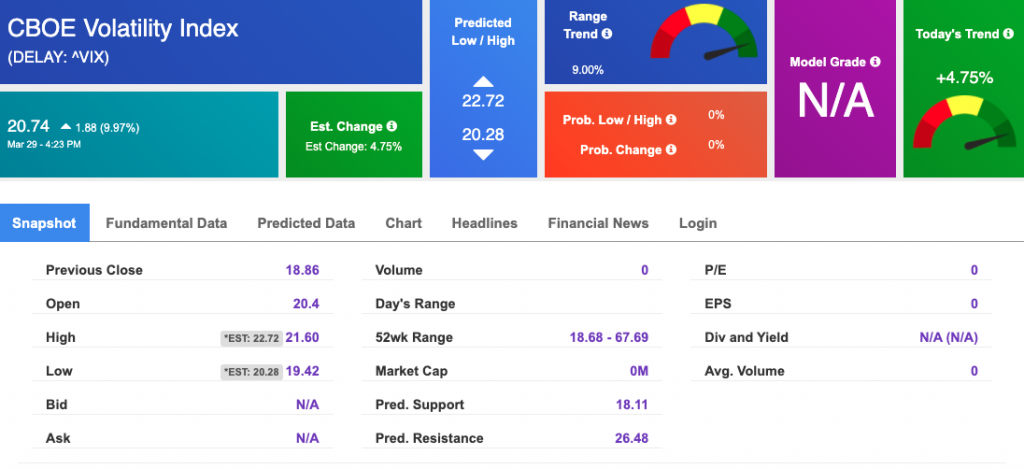
Volatility
The CBOE Volatility Index (^VIX) is $20.74 at the time of publication, and our 10-day prediction window shows positive signals. Prediction data uploaded after the market close at 6 p.m., CST. Today’s data is based on market signals from the previous trading session