Tech is on the Rebound, Monetary Policy Update at Earnings Mid-Point
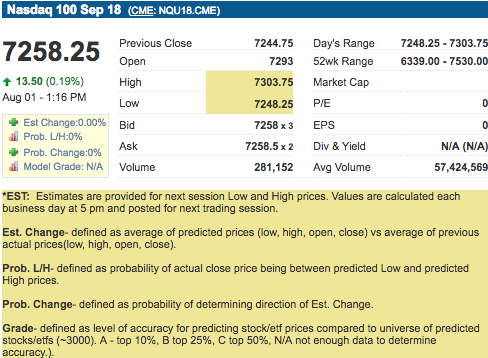
After some early-week struggles that saw Facebook, Netflix, Twitter and others down, most U.S. tech stocks are on the rebound today. Nasdaq touched 50-day moving average and is trading above the key support at the 50-day MA. Strong Apple iPhone sales helped the company report its highest-ever revenue for the second-quarter in earnings released yesterday, bringing it closer to becoming the first company ever valued at one trillion dollars. T-Mobile, Tesla, MetLife, and Allstate report today. AIG, Activision Blizzard, Berkshire, DuPont, Kraft, Siemens, to name a few, will round out the week in earnings reports.

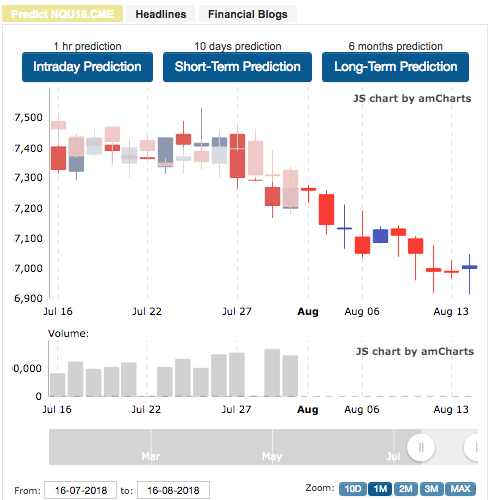
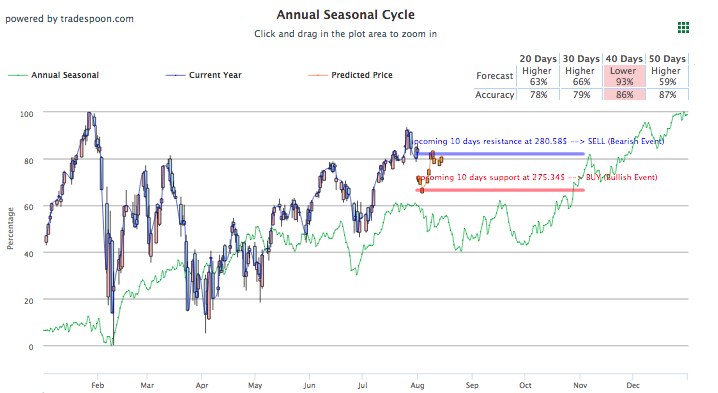
Activity today has been mostly modest though support and on the move up from positive labor data as well as a tech sector on the rebound behind Apple’s stronger than usual second-quarter earnings. With various 50-day moving averages being topped or reached it is crucial to keep up with Seasonal Charts as they update for new support and resistance levels, especially during earnings season.
Worries over U.S.-China trade relations remain but the market continues to find guidance in earnings and market data. Strong labor-market numbers have supported assets today as investors wait for monetary policy updates from the two-day FOMC meeting concluding today. With already $34 billion worth of Chinese imports tariffed, the U.S will consider an additional $16 billion while the Chinese will surely consider further reactionary tariffs. While there is no promised end in sight, the pace of tariffs has provided some promise to investors that a deal could get worked out before tariffs get out of hand.
Today’s conclusion of the FOMC meeting will likely not result in another interest rate hike, however, indicators on the next interest rate hike and a further review of the state of the market will come out as more and more updates are released from the meeting. Unlike past meetings, this one will not conclude in a press conference. On Friday, though, Chairman Jerome Powell will speak on labor market non-farm payroll reports.
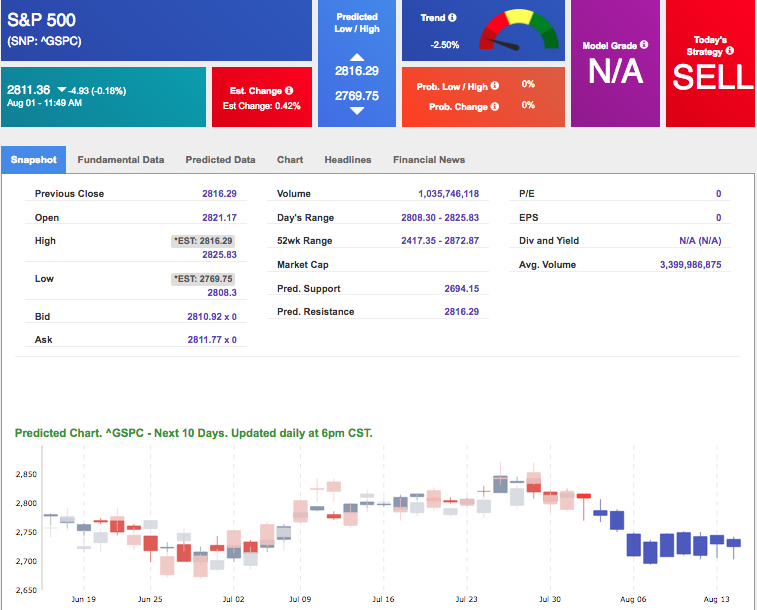
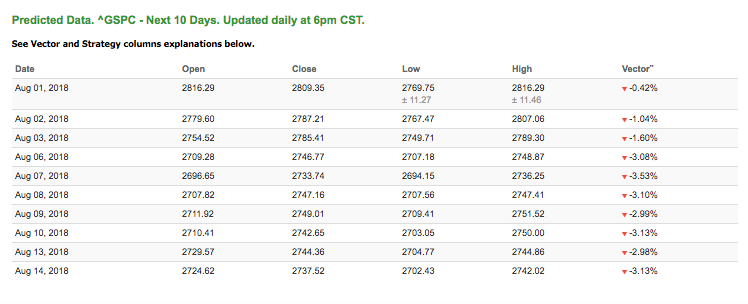
Using the ^GSPC symbol to analyze the S&P 500, our 10-day prediction window shows mixed signals. Today’s vector figure of -0.42% moves to -3.08% in three trading sessions. The predicted close for tomorrow is 2,787.21. Prediction data is uploaded after market close at 6 p.m., CST. Today’s data is based on market signals from the previous trading session.
Highlight of a Recent Winning Trade
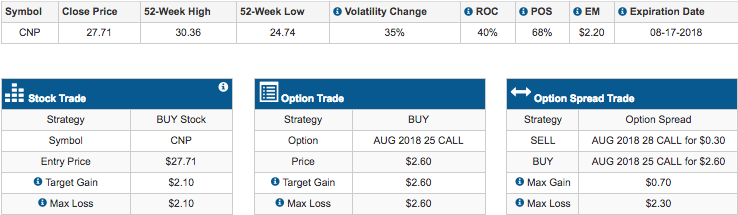
On July 2nd, our Premium Picks opened a recommendation for CenterPoint Energy(CNP), closing that position on July 26. Premium Picks are only included in Premium membership plans and are designed for swing-trading, holding positions from seven to thirty days.
Trade Breakdown

Thursday Morning Featured Stock
Our featured stock for Thursday is CitiGroup (C). C is showing a confident uptrend in our Stock Forecast Toolbox’s 10-day forecast. This stock is assigned a Model Grade of (A) indicating it ranks in the top 10th percentile for accuracy for predicted support and resistance, relative to our entire data universe. Our 10-day prediction model shows positive vector figure reaching +1.23% tomorrow. Our benchmark for vector figures is +1.00%.
*Please note: Our featured stock is part of your free subscription service. It is not included in any paid Tradespoon subscription service. Vlad Karpel only trades his own personal money in paid subscription services. If you are a paid subscriber, please review your Premium Member Picks, ActiveTrader or ActiveInvestor recommendations. If you are interested in receiving Vlad’s personal picks,please click here.
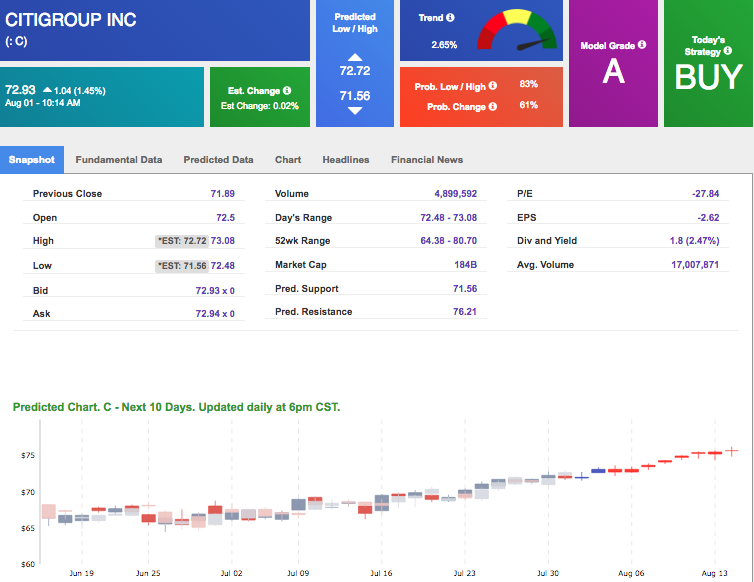
The stock is trading at $72.93 at the time of publication, up 1.45% from the open with a +0.02% vector figure.
Thursday’s prediction shows an open price of $72.63, a low of $72.59 and a high of $73.34.
The predicted close for tomorrow is $73.08. Vector figures stay positive tomorrow and drive upward throughout the 10-day forecast. This is a good signal for trading opportunities because we use vectors as a primary factor in determining price movements for stocks and ETF.
Prediction data is uploaded after market close at 6 p.m., CST. Today’s data is based on market signals from the previous trading session.
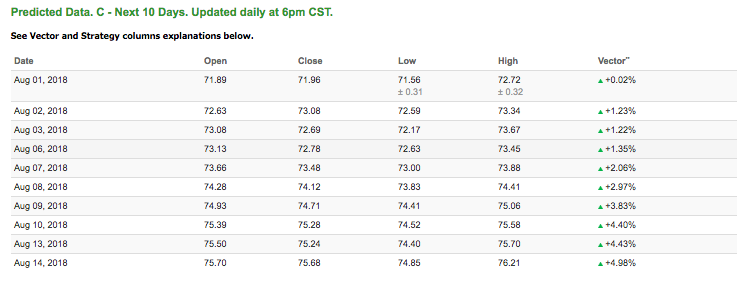
Note: The Vector column calculates the change of the Forecasted Average Price for next trading session relative to the average of actual prices for last trading session. The column shows expected average price movement “Up or Down”, in percent. Trend traders should trade along the predicted direction of the Vector. The higher the value of the Vector the higher its momentum.

Special Lifetime Offer – Watch where I trade my personal money, propose specific stop losses, time the market, show how I trade step-by-step, consider underlying volatility, and sell for big profits!
Click here for my Special Lifetime Offer!
Oil
West Texas Intermediate for September delivery (CLU8) is priced at $67.54 per barrel, down 1.88% from the open, at the time of publication. An unexpected rise in crude supplies has U.S oil trading lower today. Total crude production was also down from its recent record high per-day barrel count.
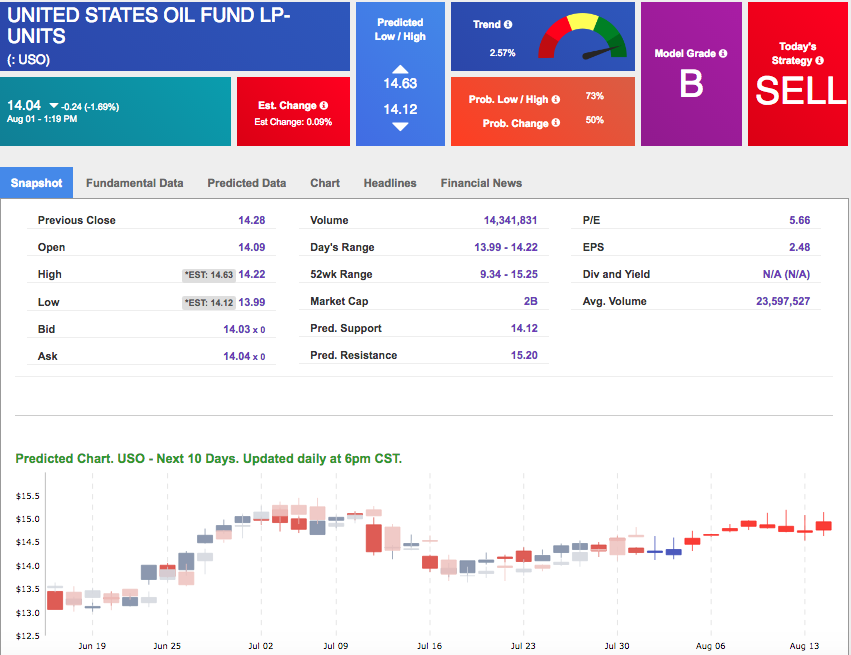
Looking at USO, a crude oil tracker, our 10-day prediction model mostly all positive signals. The fund is trading at $14.04 at the time of publication, down 1.69% from the open. Vector figures show 0.09% today, which turns +1.41% in two trading sessions. Prediction data is uploaded after market close at 6 p.m., CST. Today’s data is based on market signals from the previous trading session.

Gold
Gold continues to trade lower against a rising dollar as investor anticipate FOMC meeting updates throughout the day. The price for December gold (GCZ8) is down 0.46% at $1,227.10 at the time of publication. Although Gold began the day with modest gains, the strong dollar and U.S. bonds kept the commodity down as it has throughout the week.
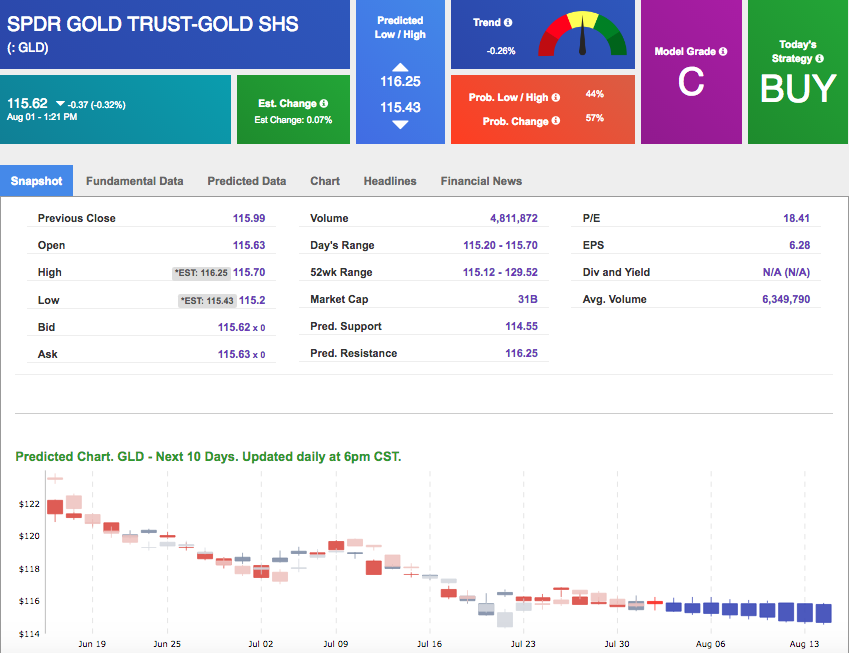
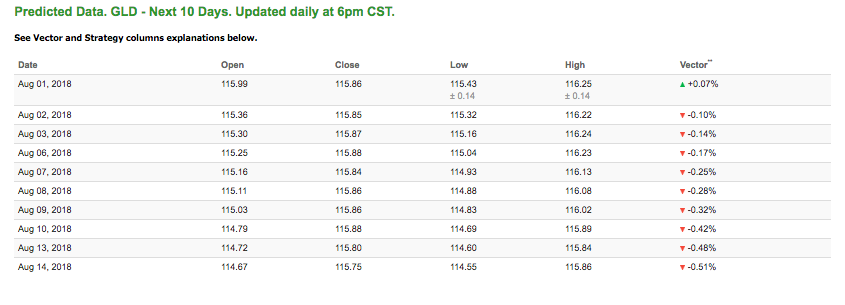
Using SPDR GOLD TRUST (GLD) as a tracker in our Stock Forecast Tool, the 10-day prediction window shows almost all negative signals. The gold proxy is trading at $115.62, down 0.32% at the time of publication. Vector signals show 0.07% for today. Prediction data is uploaded after market close at 6 p.m., CST. Today’s data is based on market signals from the previous trading session.
Treasuries
Once more, the 10-year note hit the 3% level, this time just ahead of the Fed monetary policy update to come at the conclusion of the two-day FOMC meeting. The yield on the 10-year Treasury note is up 1.16% at 3.00% at the time of publication. The yield on the 30-year Treasury note is up 1.23% at 3.12% at the time of publication.
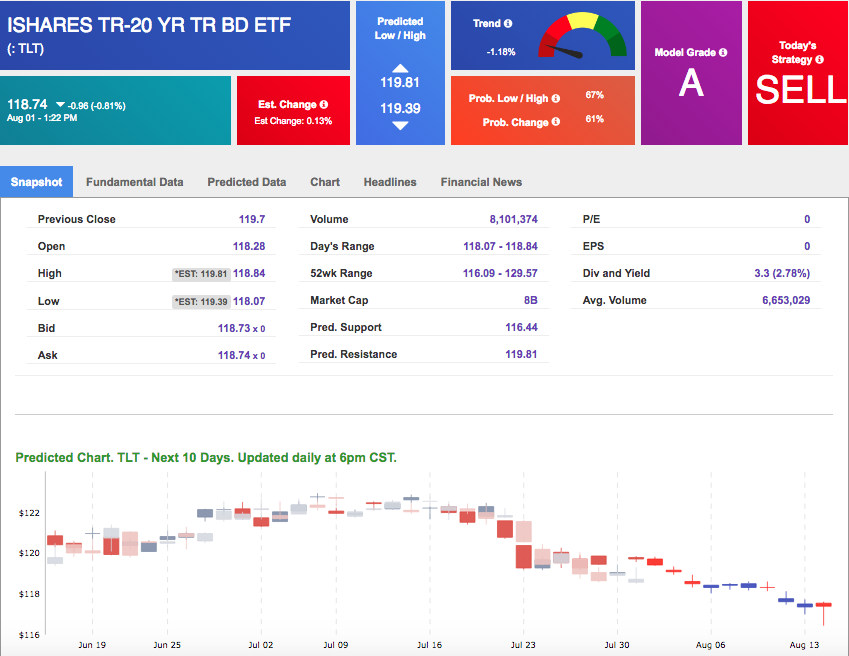
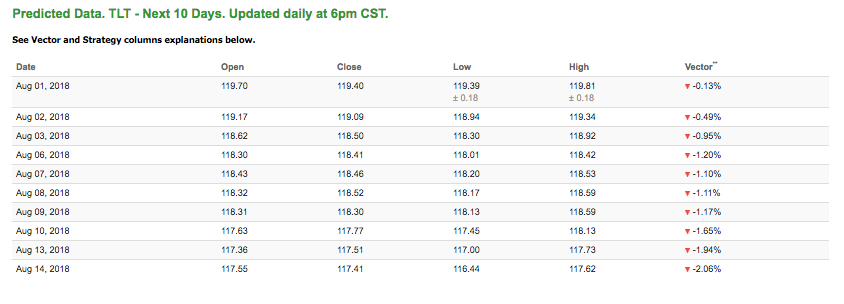
Using the iShares 20+ Year Treasury Bond ETF (TLT) as a proxy for bond prices in our Stock Forecast Tool, we see all negative signals in our 10-day prediction window. Today’s vector of -0.13% moves to -1.20% in three sessions. Prediction data is uploaded after market close at 6 p.m., CST. Today’s data is based on market signals from the previous trading session.
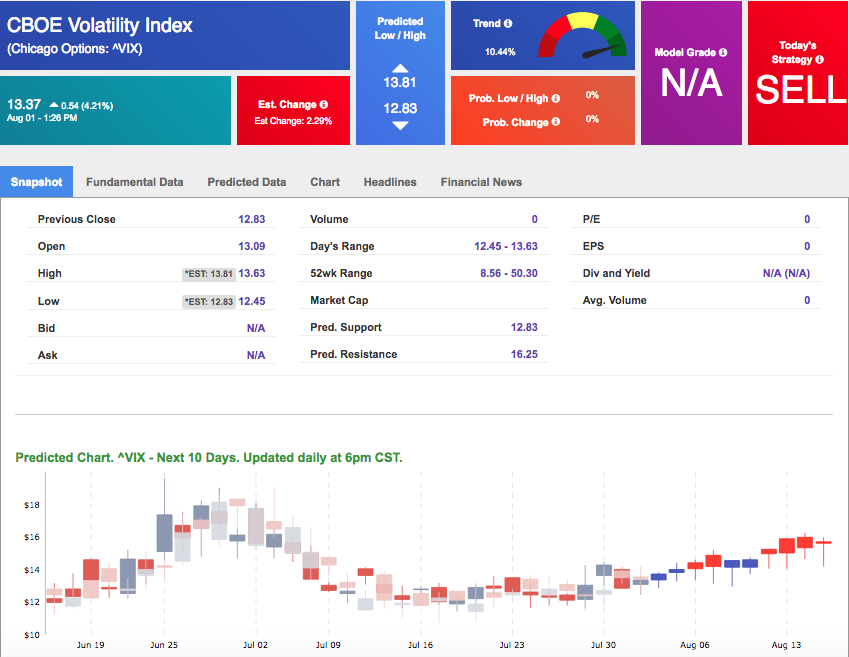
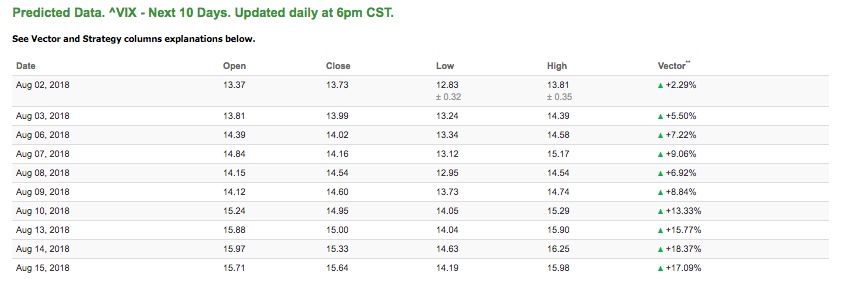
Volatility
The CBOE Volatility Index (^VIX) is up 4.21% at $13.37 at the time of publication, and our 10-day prediction window shows all positive signals. The predicted close for tomorrow is $13.99 with a vector of +5.50%. Prediction data is uploaded after market close at 6 p.m., CST. Today’s data is based on market signals from the previous trading session.