

Treasury Notes and Major Indices Lower, Global Central Banks Cut Rates
U.S.-China trade conflict shakes U.S. stocks
Major U.S. indices are on track to close in the red, erasing yesterday’s gains, following continued uncertainty and global reactions to U.S.-China trade conflict.
Adoption of easy-money policies across the globe
Several global central banks have begun adopting easy-money policies, cutting interest rates in response to the growing tensions and increase of tariffs between two of the world’s top economies.
Earnings season continues
Earnings season continues with Roku, Lyft, and Marathon Oil reporting today. Although the current earnings season has returned with mostly positive results several sectors, such as energy, small caps, banks, and biotech are sitting at multi-month lows.
(Want free training resources? Check our our training section for videos and tips!)
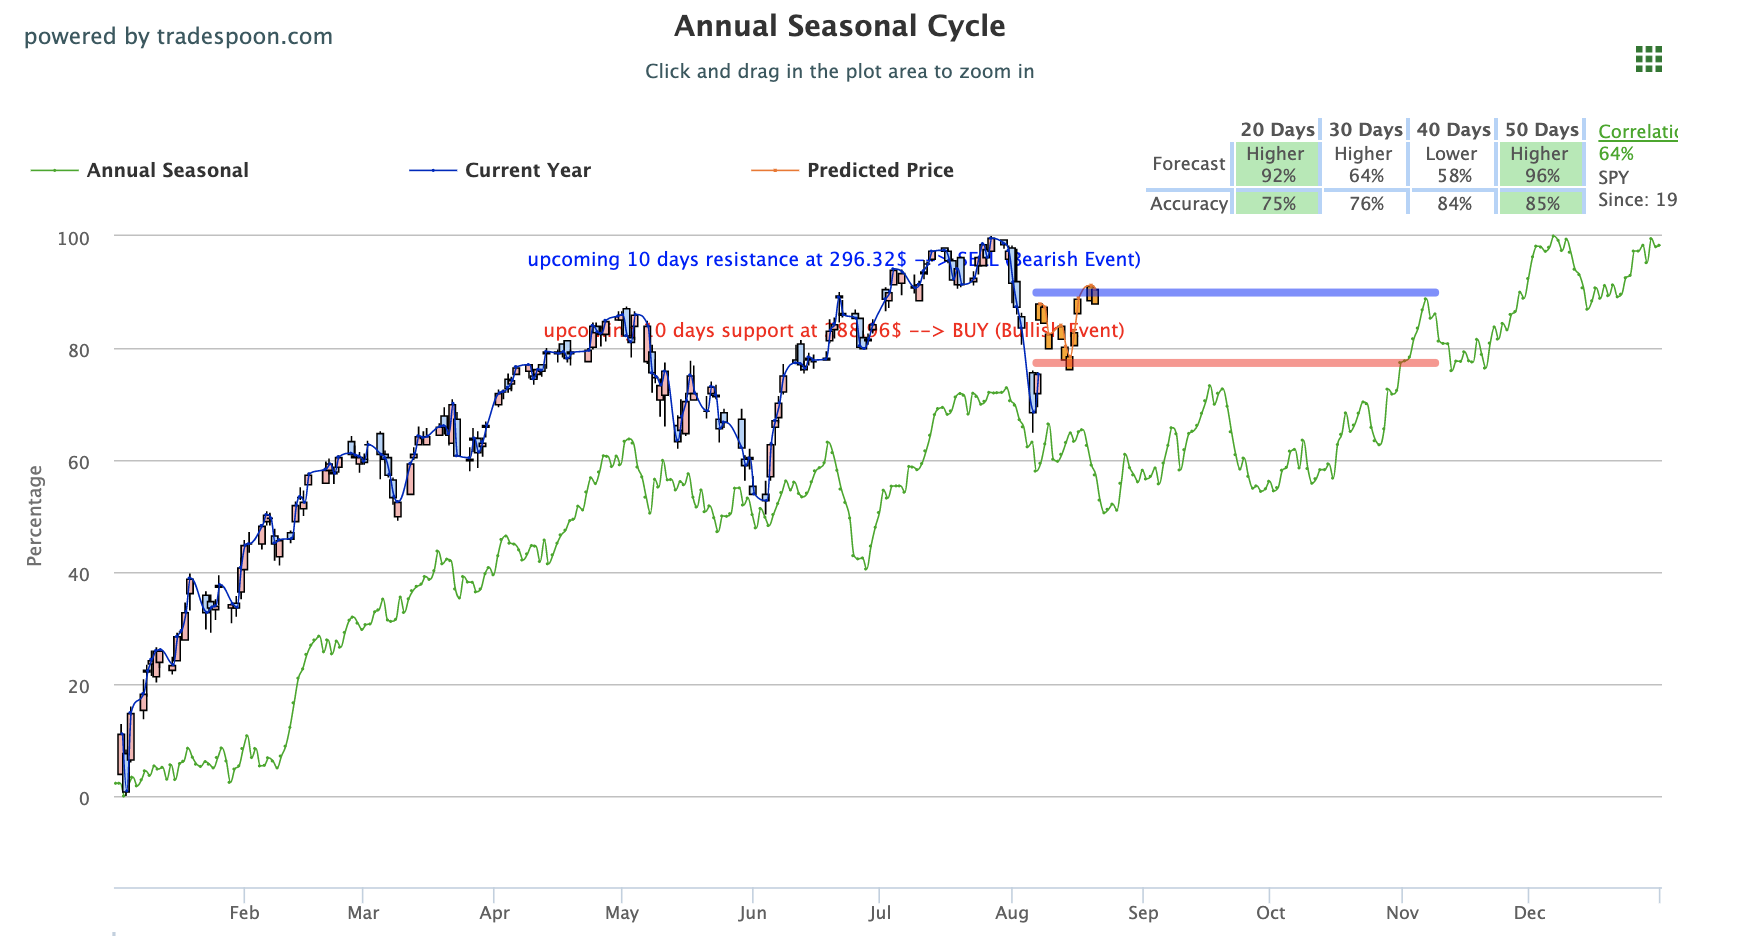
Short term SPY support at 277-$280 level
Short term SPY support is at 277-$280 level and at this time we do not see evidence for market capitulation. More volatility should be expected as uncertainty around U.S.-China relations, Brexit, and interest rates continue.
SPY Seasonal Chart
Taking this into consideration, we will sell when the market is near $290 and look to buy near $270 for the SPY. We urge our readers to have very clearly defined stop levels for all positions during this period of volatility. For reference, the SPY Seasonal Chart is shown below:
(Want free training resources? Check our our training section for videos and tips!)
U.S. and Chinese trade representatives talks continue on September 1
Also lowering alongside major indices are equity markets with both U.S. and European bonds lowering amidst global trade uncertainty. Next month, U.S. and Chinese trade representatives will meet to continue negotiations while the next set off tariffs are set to kick in on September 1st.
Global central banks follow FED actions
Last week, U.S. Federal Reserve agreed to cut interest rates. This week, several global central banks have followed suit in preemptive reaction to the growing divide between the U.S. and China. India, New Zealand, and Thailand have all lowered interest rates significantly while China has fixed the midpoint for yuan currency trading at 6.9996.
(Want free training resources? Check our our training section for videos and tips!)
Labeling China as “currency manipulator”
This move to adjust Chinese currency has recently been called out by President Trump as “currency manipulation,” addressing the Fed to take this into consideration. This was followed by a declaration from Trump that China is not the issue but rather the Federal Reserve is as they have not cut rates significantly enough. Look for more on this issue as the month progresses and we get closer to the U.S.-China meeting in September.
Walt Disney has bright future in the upcoming quarter
Yesterday, Walt Disney reported earnings that missed estimates and caused shares to lower by over 6%. With its new streaming service set to launch before the year’s end and the Fox acquisition still being implemented, Disney will look to rebound in the upcoming quarter.
Notable earnings reports today
Papa John’s missed estimates, causing shares to lower, although sales returned better than expected. Topping earnings expectations were CVS, which saw shares grow over 5% in response. Look for Lyft, Roku, Marathon Oil, Fox, Booking Holdings, and Zillow to report after the market closes today. Tomorrow’s earnings load will consist of Uber, Adidas, Keurig Dr. Pepper, Kraft-Heinz, and Activision.
July’s Federal Budget release on Friday
Look for last month’s Producer Price Index to release on Friday and July’s Federal Budget the following week.
(Want free training resources? Check our our training section for videos and tips!)
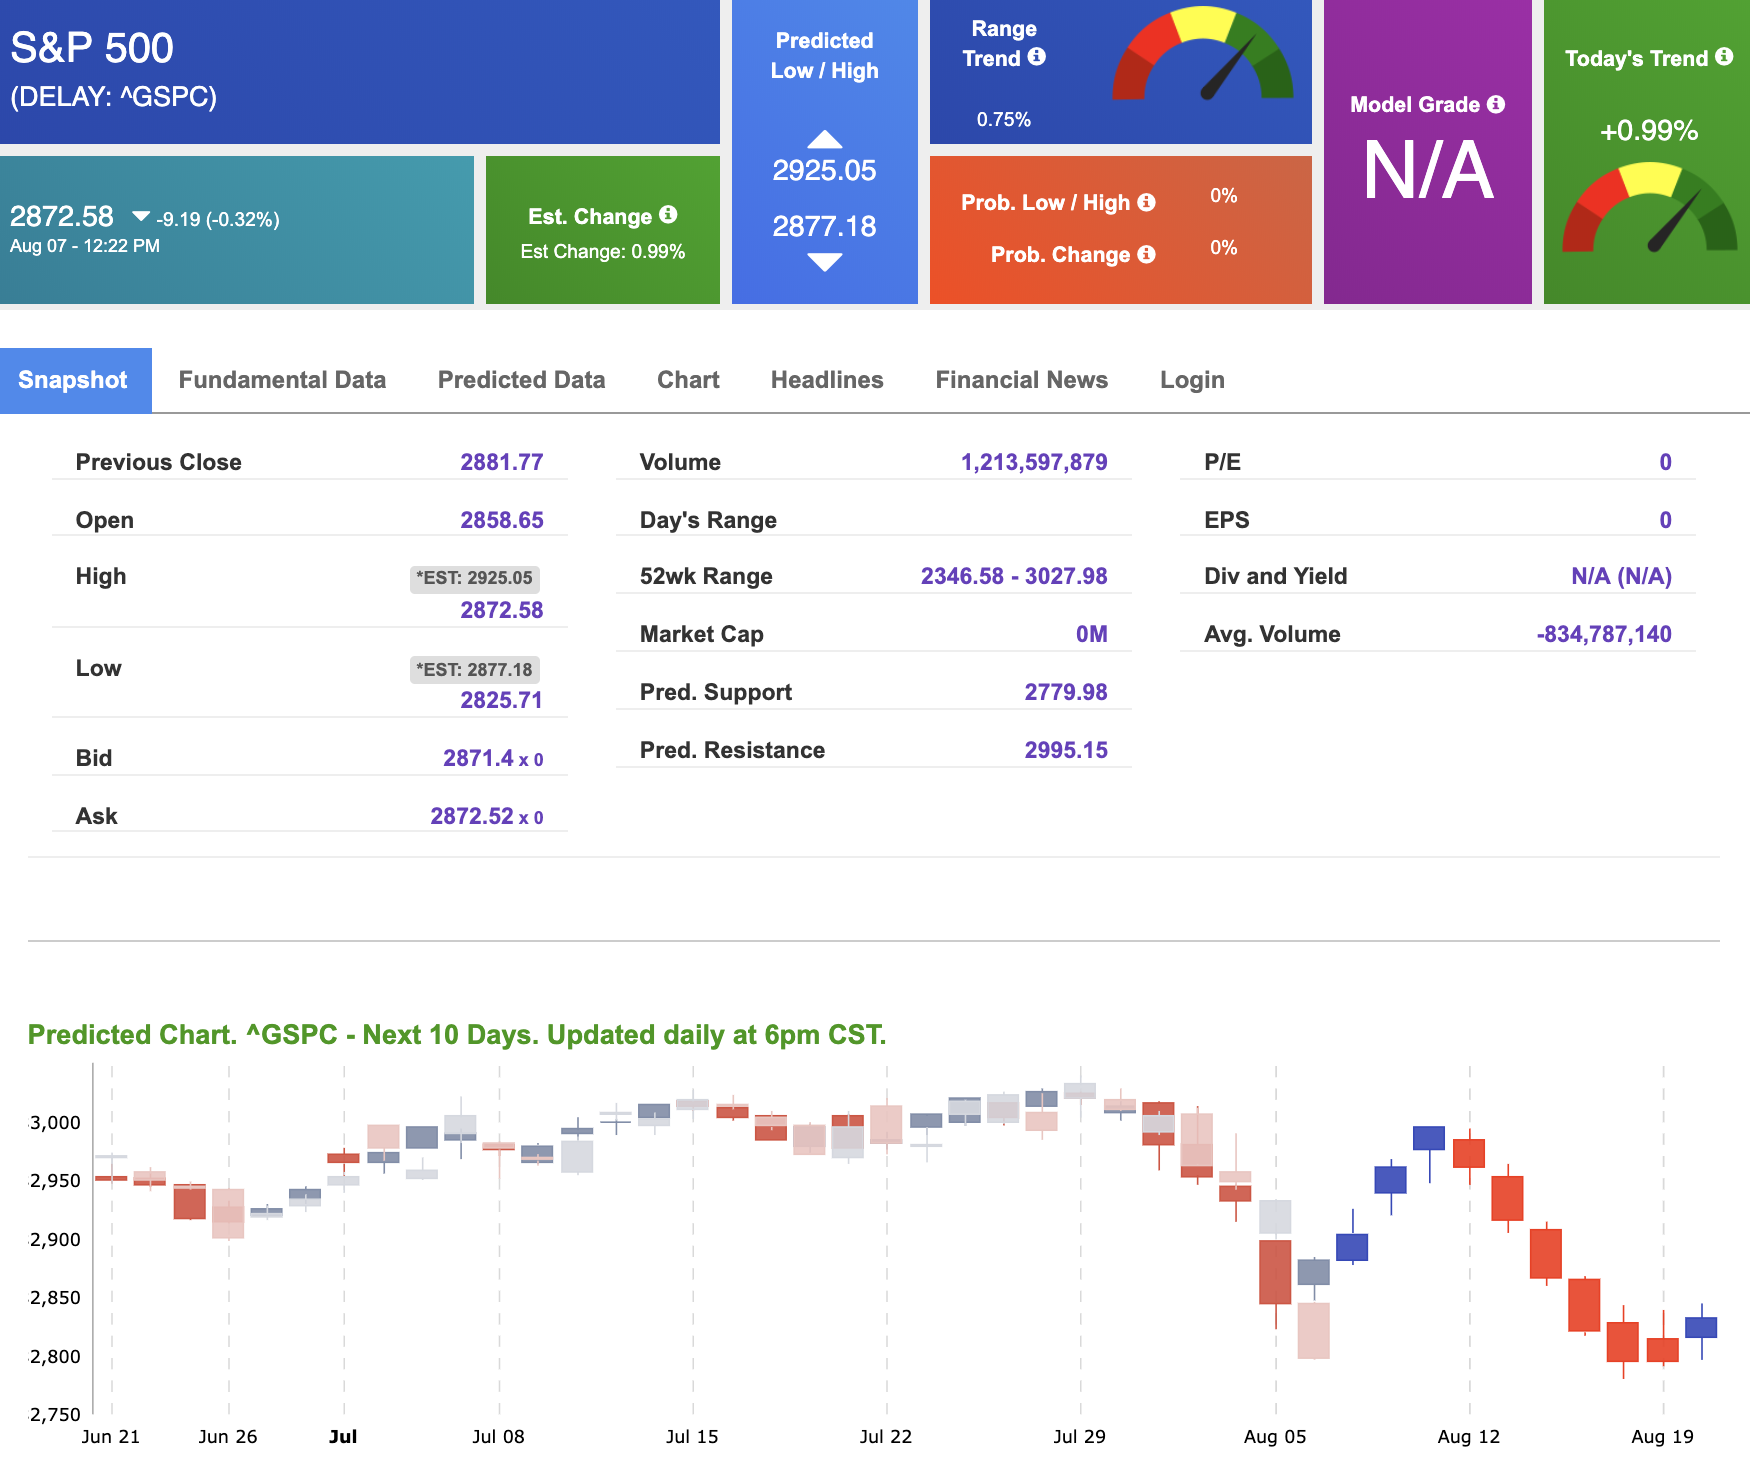
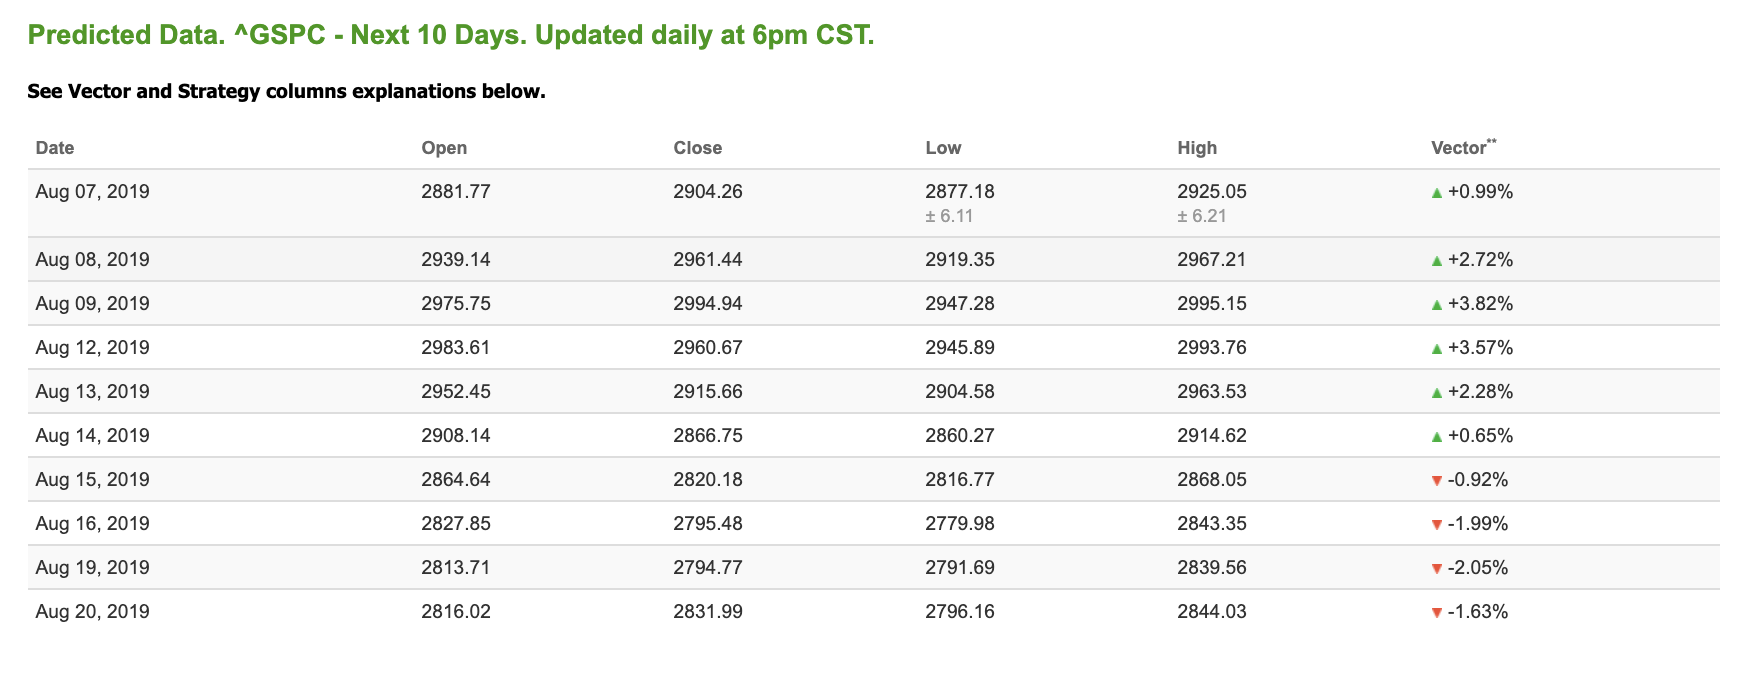
Using the “^GSPC” symbol to analyze the S&P 500 our 10-day prediction window shows positive signals. Today’s vector figure of +0.99% moves to +0.65% in five trading sessions. Prediction data is uploaded after the market close at 6pm, CST. Today’s data is based on market signals from the previous trading session.
(Want free training resources? Check our our training section for videos and tips!)
I’VE GOT SKIN IN THIS GAME!
Even in this wild market, you can do it too. This no-risk trial will empower you with the same incredible volatility tested “tools” I use to trade my own money! Our AI will forecast any “Buy-Sell” Signals with a stunning 75% win rate for both a short- and long-term investment strategy.
Click here for more info…
(Want free training resources? Check our our training section for videos and tips!)
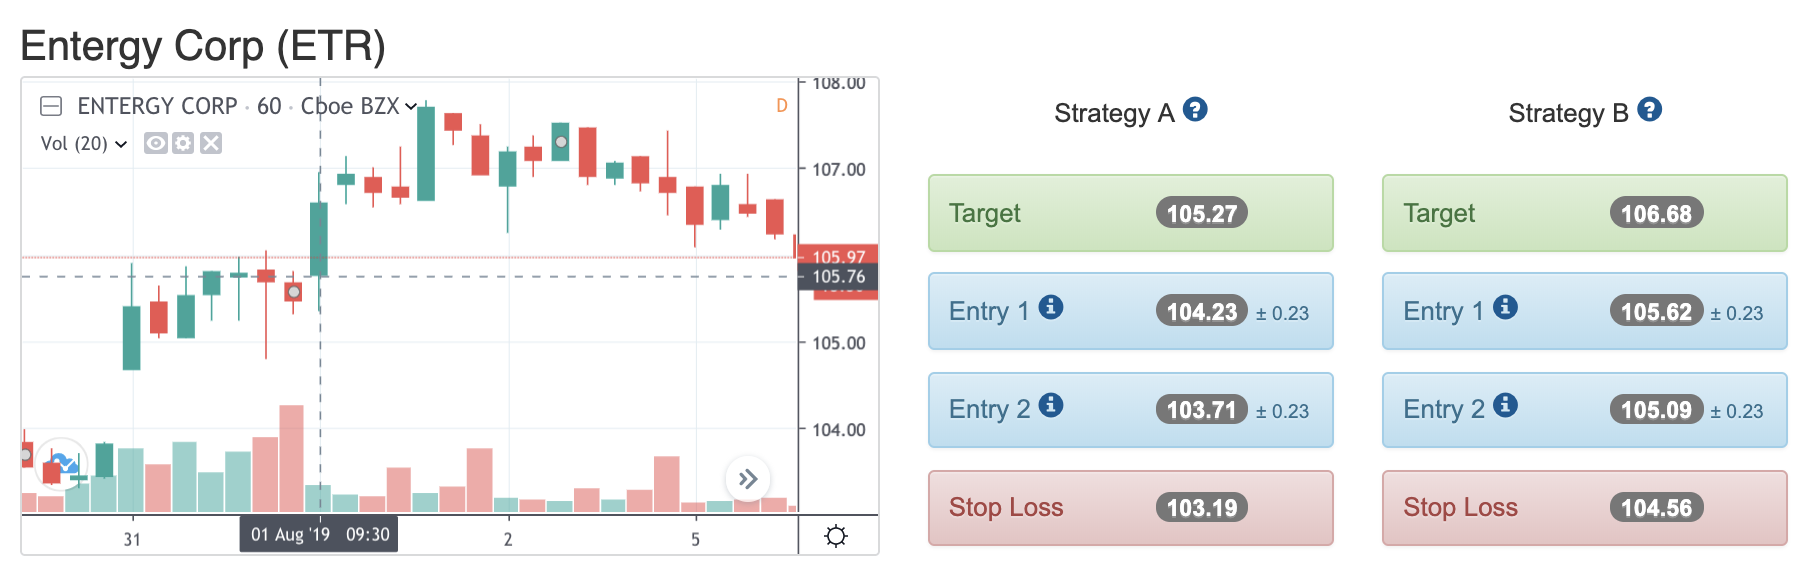
Highlight of a Recent Winning Trade
On August 1st, our ActiveTrader service produced a bullish recommendation for Entergy Corp (ETF). ActiveTrader is included in all paid Tradespoon membership plans and is designed for day trading.
Trade Breakdown
ETR entered its forecasted Strategy B Entry 1 price range $105.62 (± 0.23) in its first hour of trading and passed through its Target price $106.68 in the second hour of trading that day. The Stop Loss price was set at $104.56
(Want free training resources? Check our our training section for videos and tips!)
Thursday Morning Featured Symbol
*Please note: At the time of publication we do own the featured symbol, VXX. We are long on VXX. Our featured symbol is part of your free subscription service. It is not included in any paid Tradespoon subscription service.
Vlad Karpel only trades his own personal money
Vlad Karpel only trades his own personal money in paid subscription services. If you are a paid subscriber, please review your Premium Member Picks, ActiveTrader or MonthlyTrader recommendations. If you are interested in receiving Vlad’s personal picks, please click here.
(Want free training resources? Check our our training section for videos and tips!)
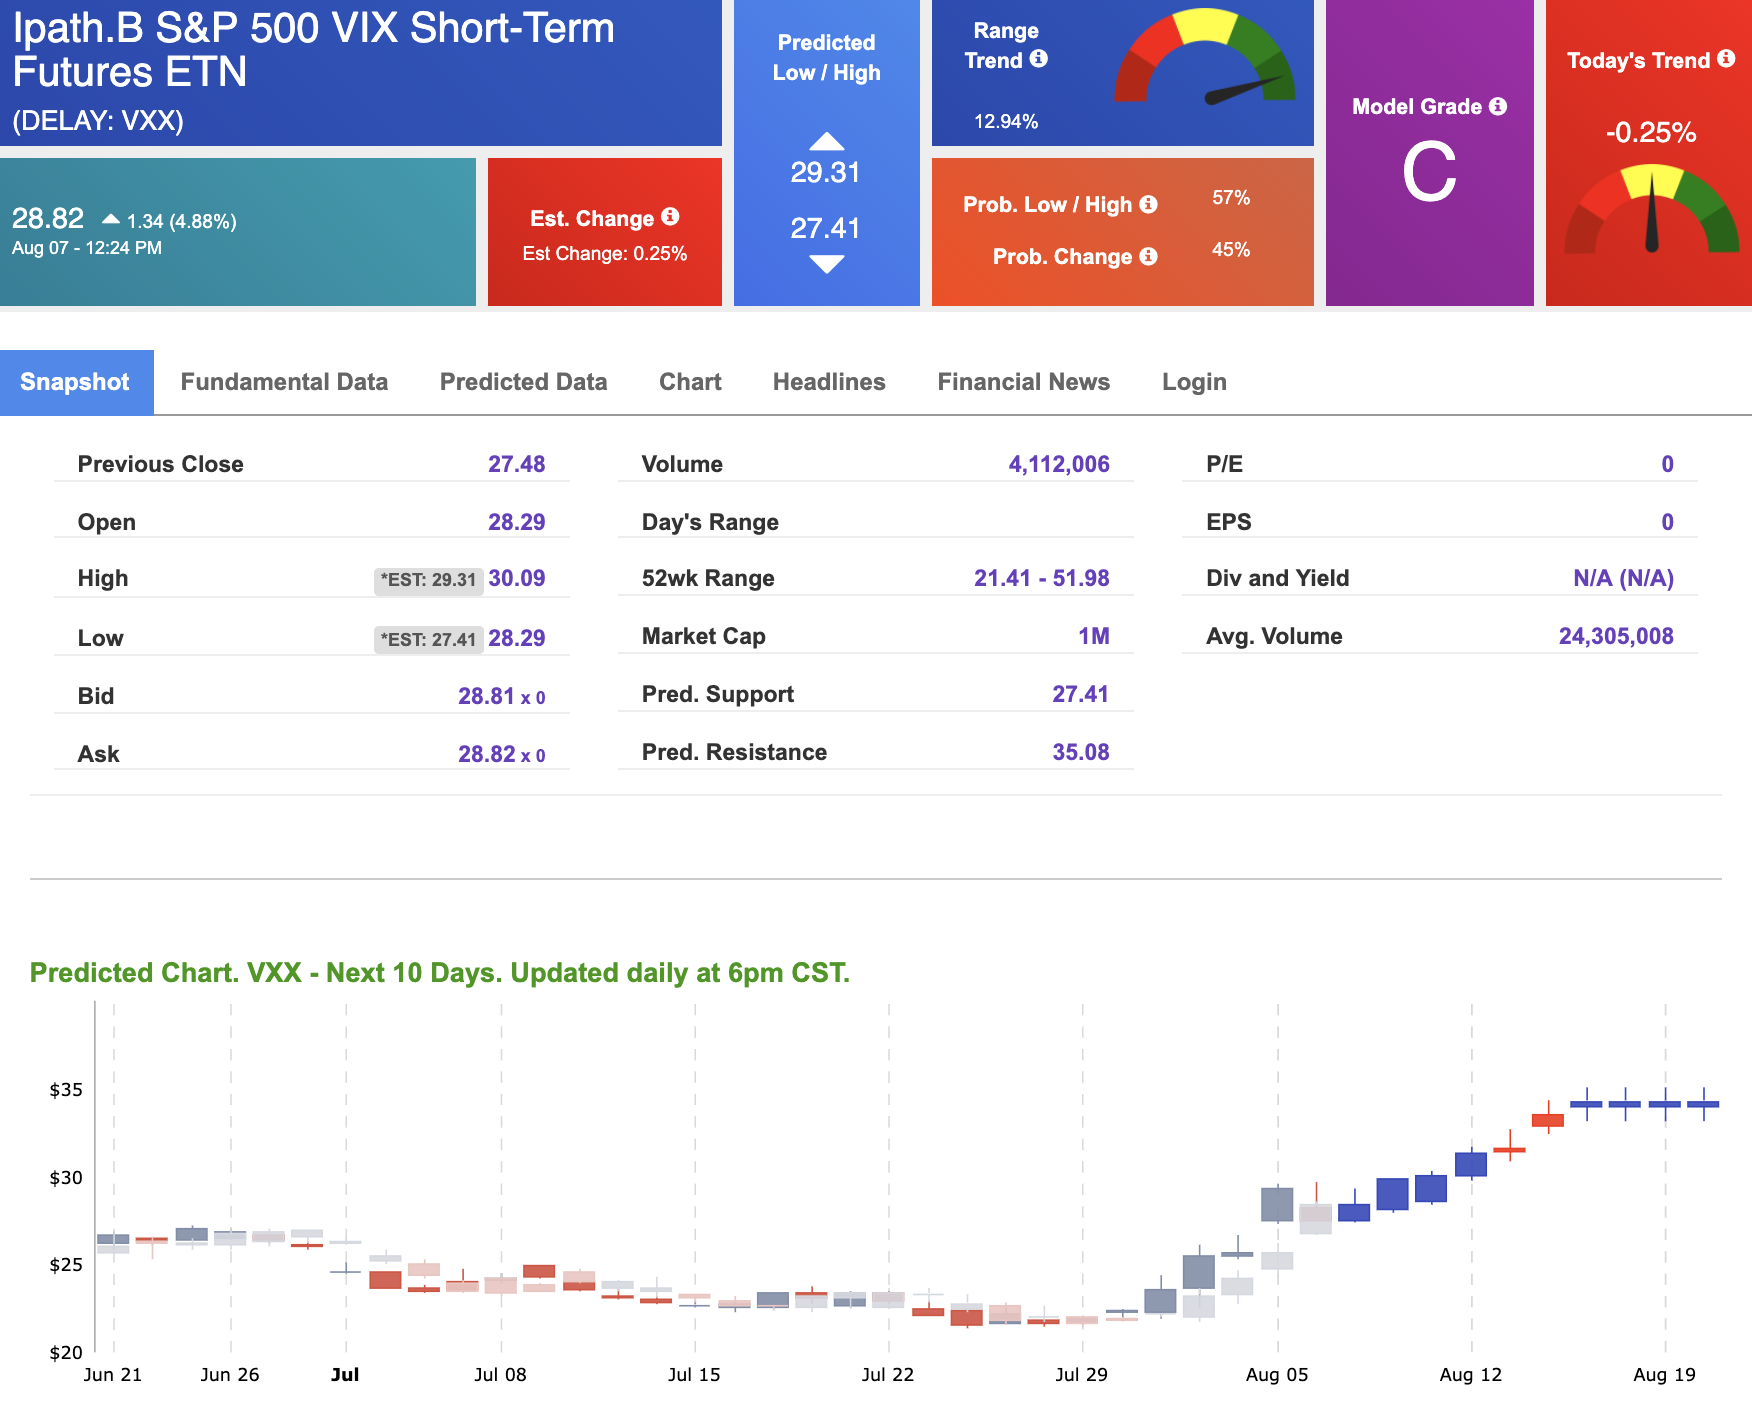
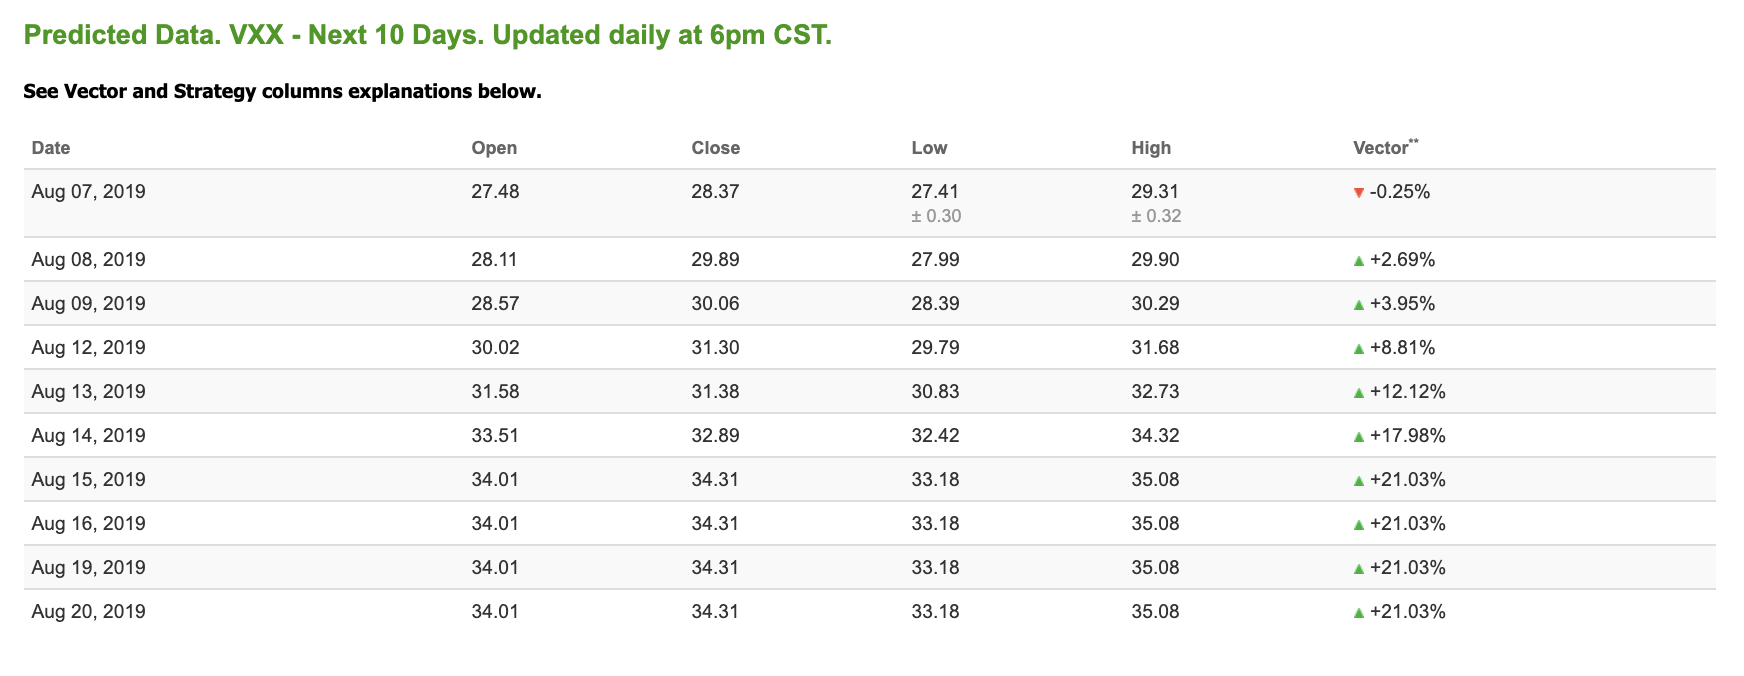
Our featured symbol for Thursday is iPath S&P 500 VIX (VXX). VXX is showing a confident vector trend in our Stock Forecast Toolbox’s 10-day forecast. This stock is assigned a Model Grade of (C) indicating it ranks in the top 50th percentile for accuracy for predicted support and resistance, relative to our entire data universe.
(Want free training resources? Check our our training section for videos and tips!)
(Want free training resources? Check our our training section for videos and tips!)
The stock is trading at $28.82 at the time of publication, up 4.88% from the open with a -0.25% vector figure.
Prediction data is uploaded after market close at 6 p.m., CST. Today’s data is based on market signals from the previous trading session.
Note: The Vector column calculates the change of the Forecasted Average Price for the next trading session relative to the average of actual prices for the last trading session. The column shows expected average price movement “Up or Down”, in percent. Trend traders should trade along the predicted direction of the Vector. The higher the value of the Vector the higher its momentum.
(Want free training resources? Check our our training section for videos and tips!)
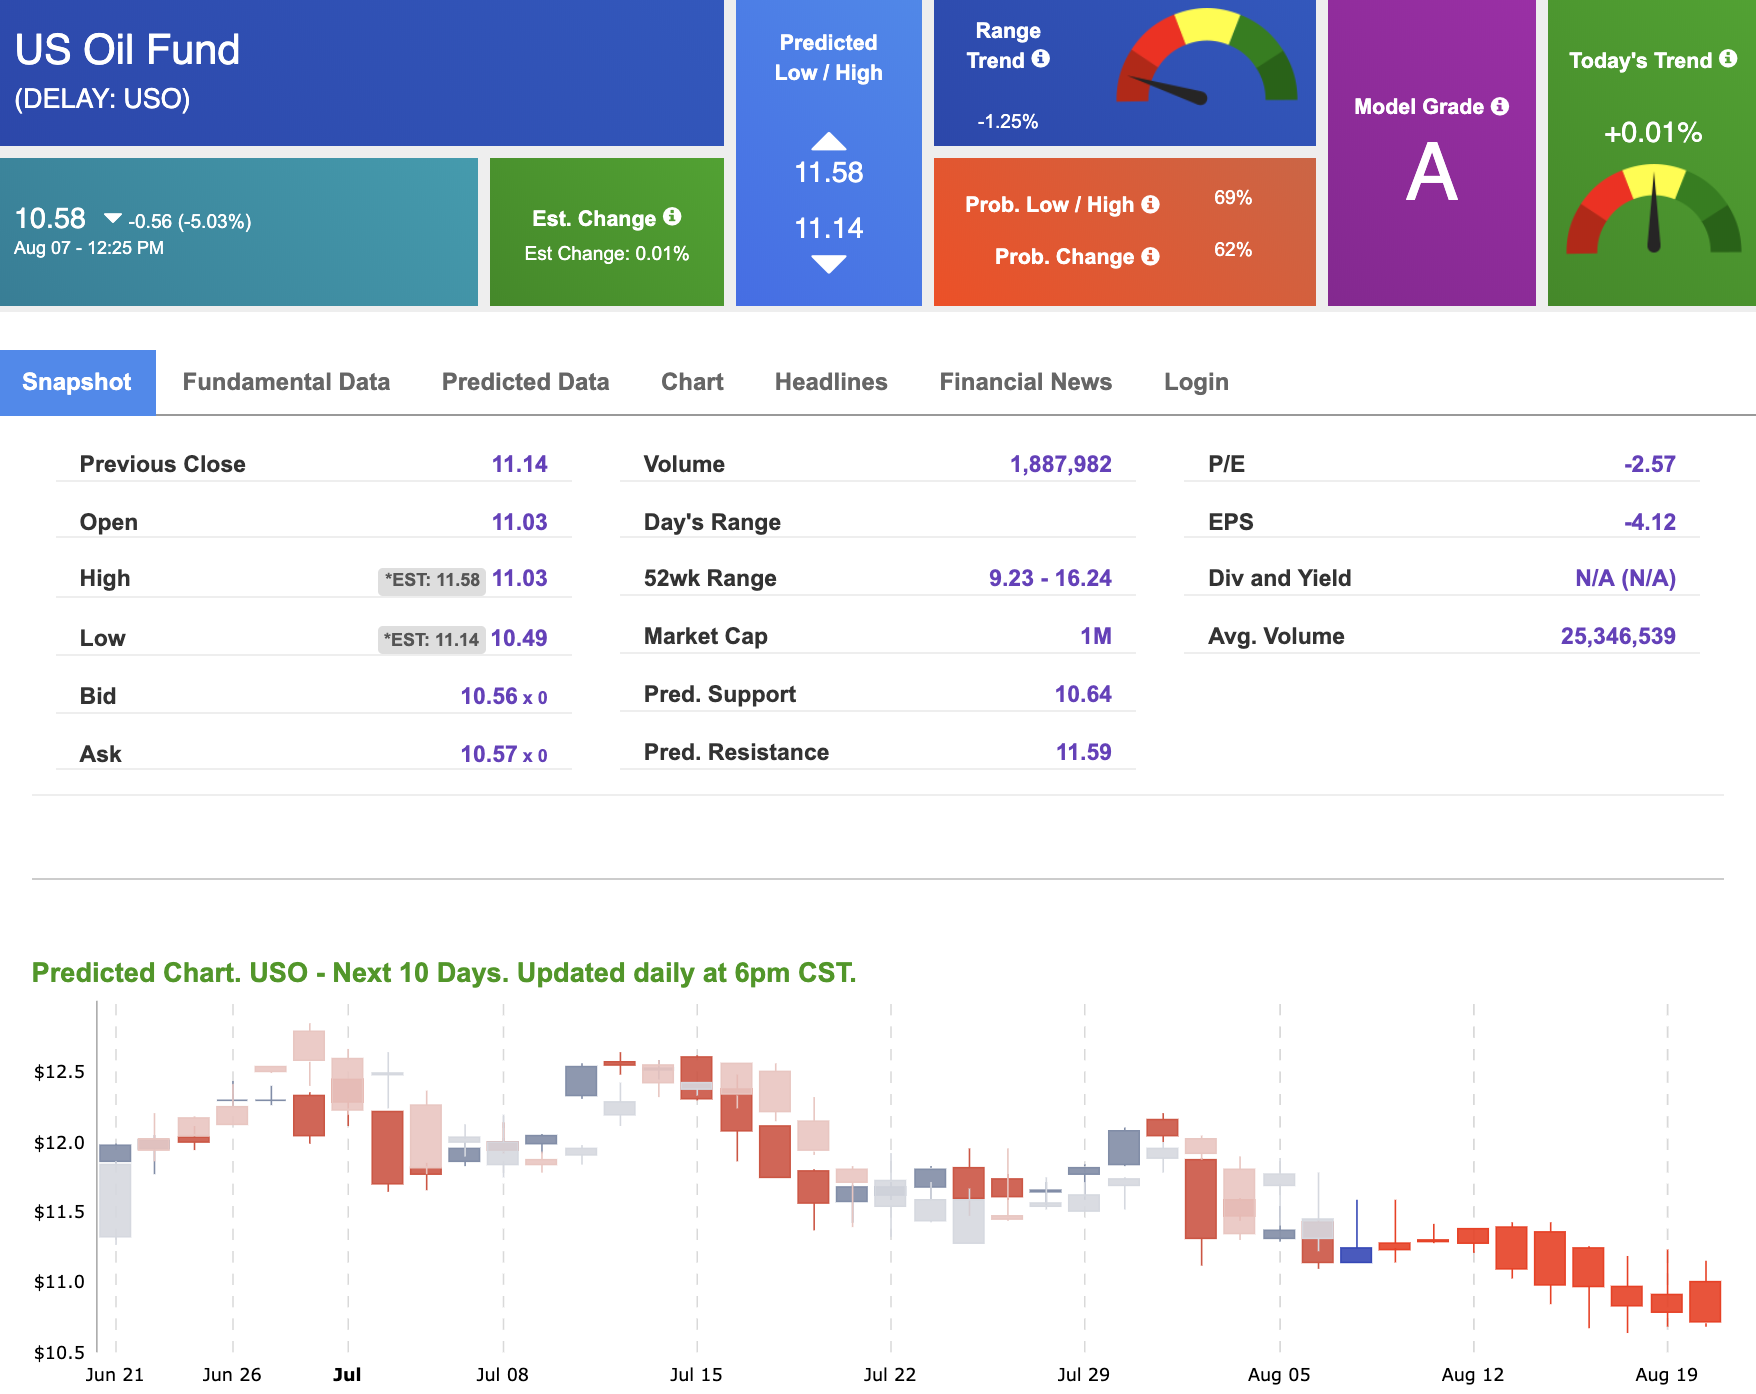
Oil
West Texas Intermediate for Crude Oil delivery (CL.1) is priced at $51.09 per barrel, down 4.75% from the open, at the time of publication.
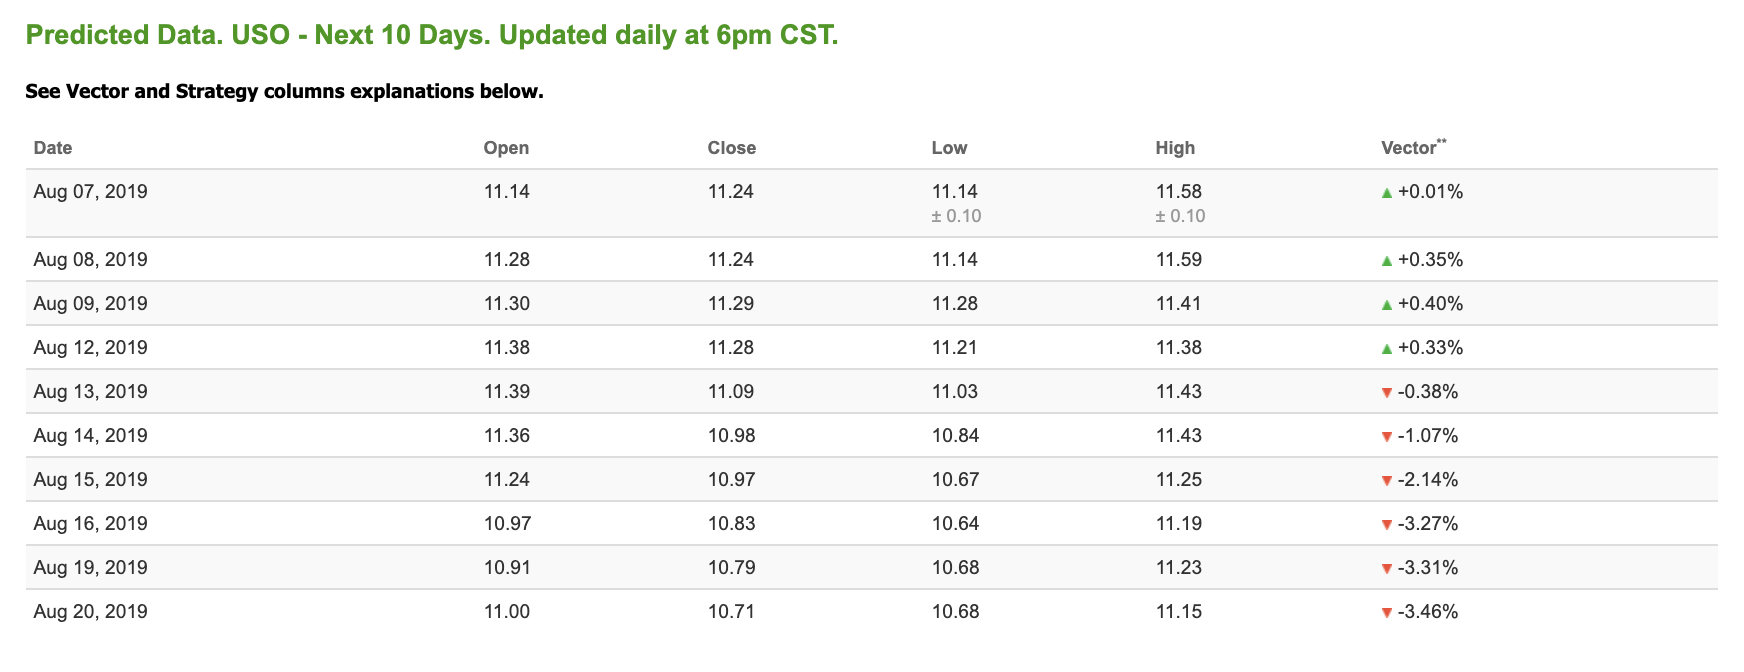
Looking at USO, a crude oil tracker, our 10-day prediction model shows mixed signals. The fund is trading at $10.58 at the time of publication, down 5.03% from the open. Vector figures show +0.01% today, which turns -1.07% in five trading sessions. Prediction data is uploaded after market close at 6 p.m., CST. Today’s data is based on market signals from the previous trading session.
(Want free training resources? Check our our training section for videos and tips!)
Gold
The price for the Gold Continuous Contract (GC00) is up 02.06% at $1,514.20 at the time of publication.
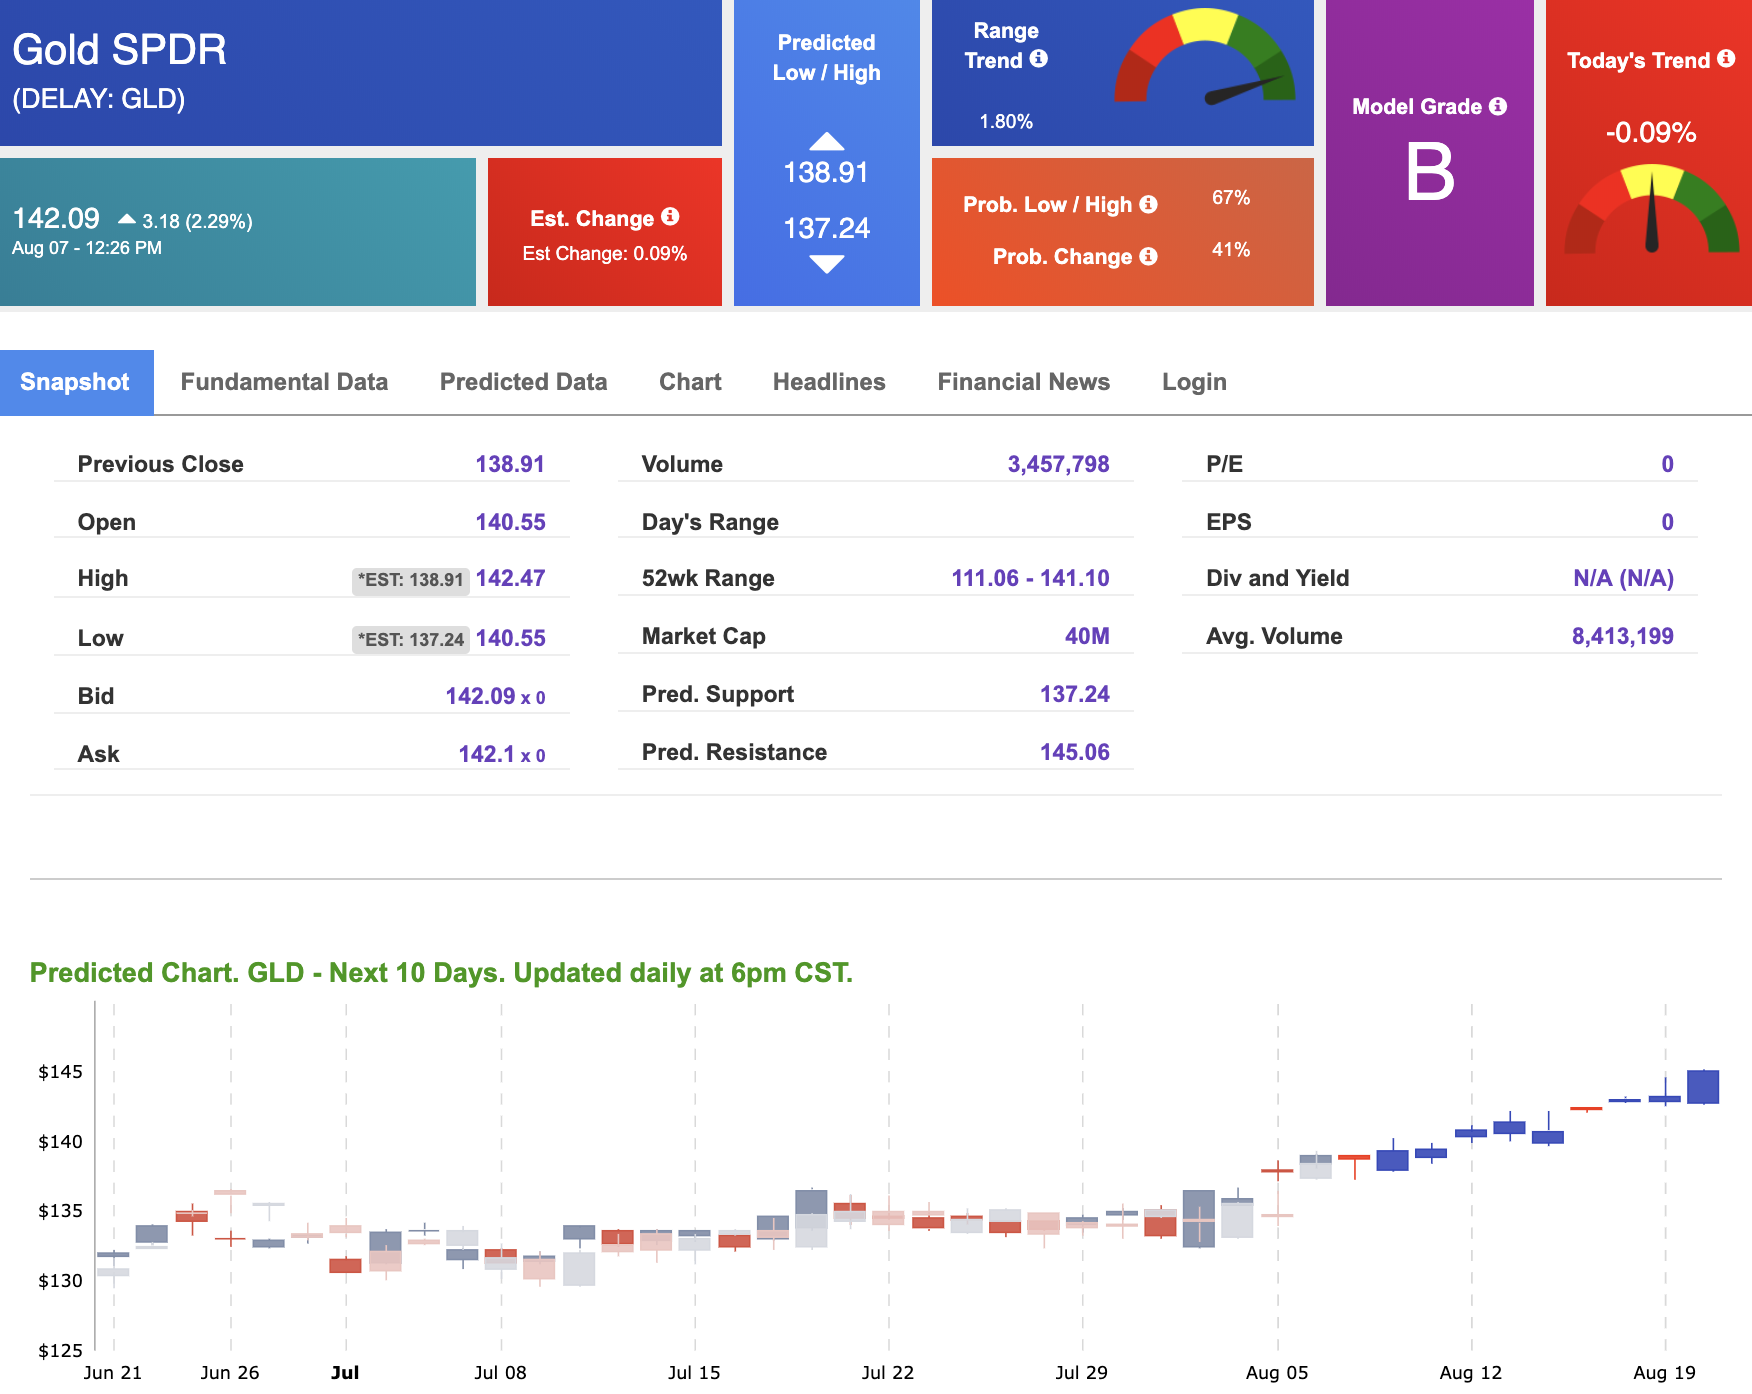
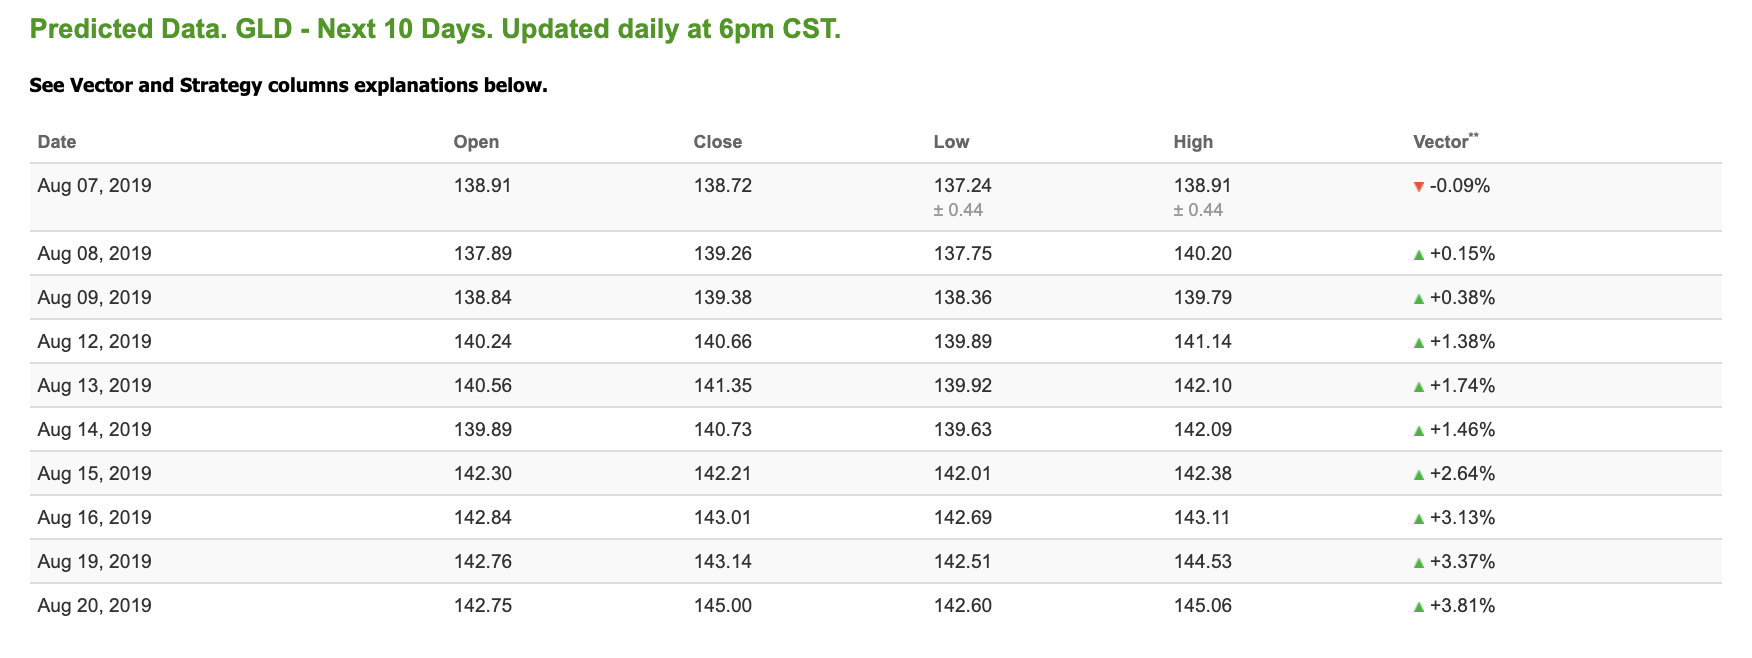
Using SPDR GOLD TRUST (GLD) as a tracker in our Stock Forecast Tool, the 10-day prediction window shows mostly positive signals. The gold proxy is trading at $142.09, up 2.29% at the time of publication. Vector signals show -0.09% for today. Prediction data is uploaded after market close at 6 p.m., CST. Today’s data is based on market signals from the previous trading session.
(Want free training resources? Check our our training section for videos and tips!)
(Want free training resources? Check our our training section for videos and tips!)
Treasuries
The yield on the 10-year Treasury note is down 2.03% at 1.67% at the time of publication. The yield on the 30-year Treasury note is down 2.38% at 2.18% at the time of publication.
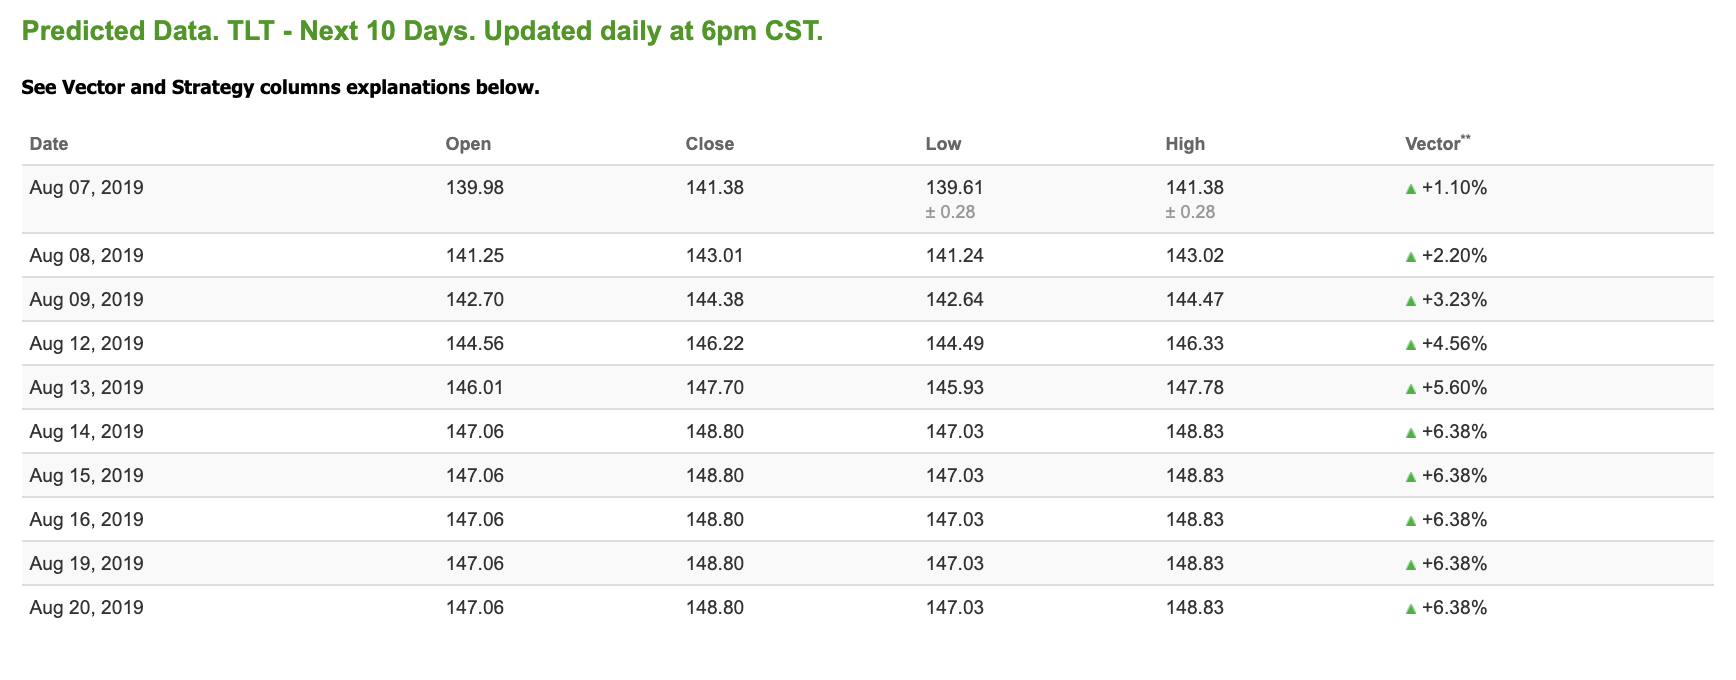
Using the iShares 20+ Year Treasury Bond ETF (TLT) as a proxy for bond prices in our Stock Forecast Tool, we see positive signals in our 10-day prediction window. Today’s vector of +1.10% moves to +4.56% in three sessions. Prediction data is uploaded after market close at 6 p.m., CST. Today’s data is based on market signals from the previous trading session.
(Want free training resources? Check our our training section for videos and tips!)

(Want free training resources? Check our our training section for videos and tips!)
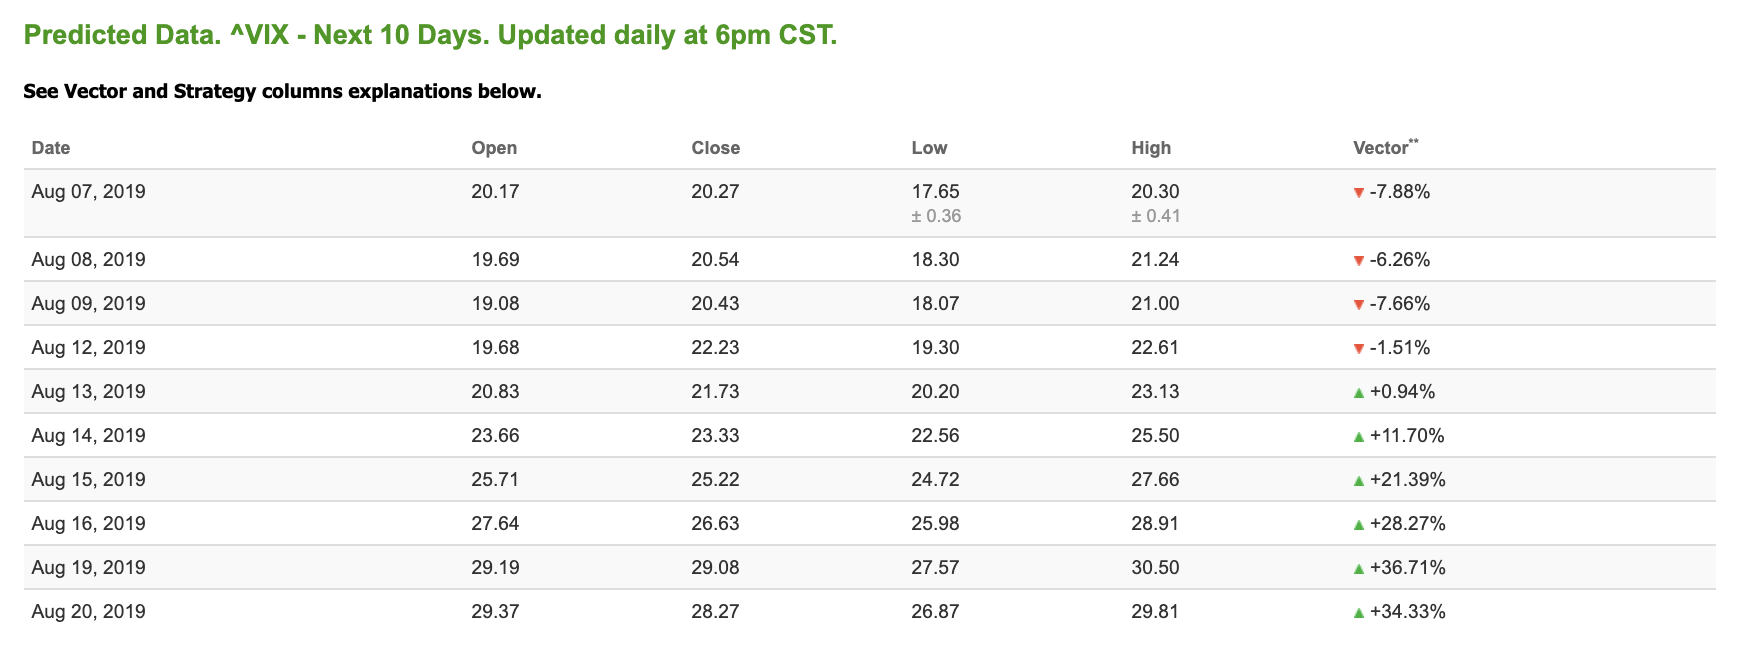
Volatility
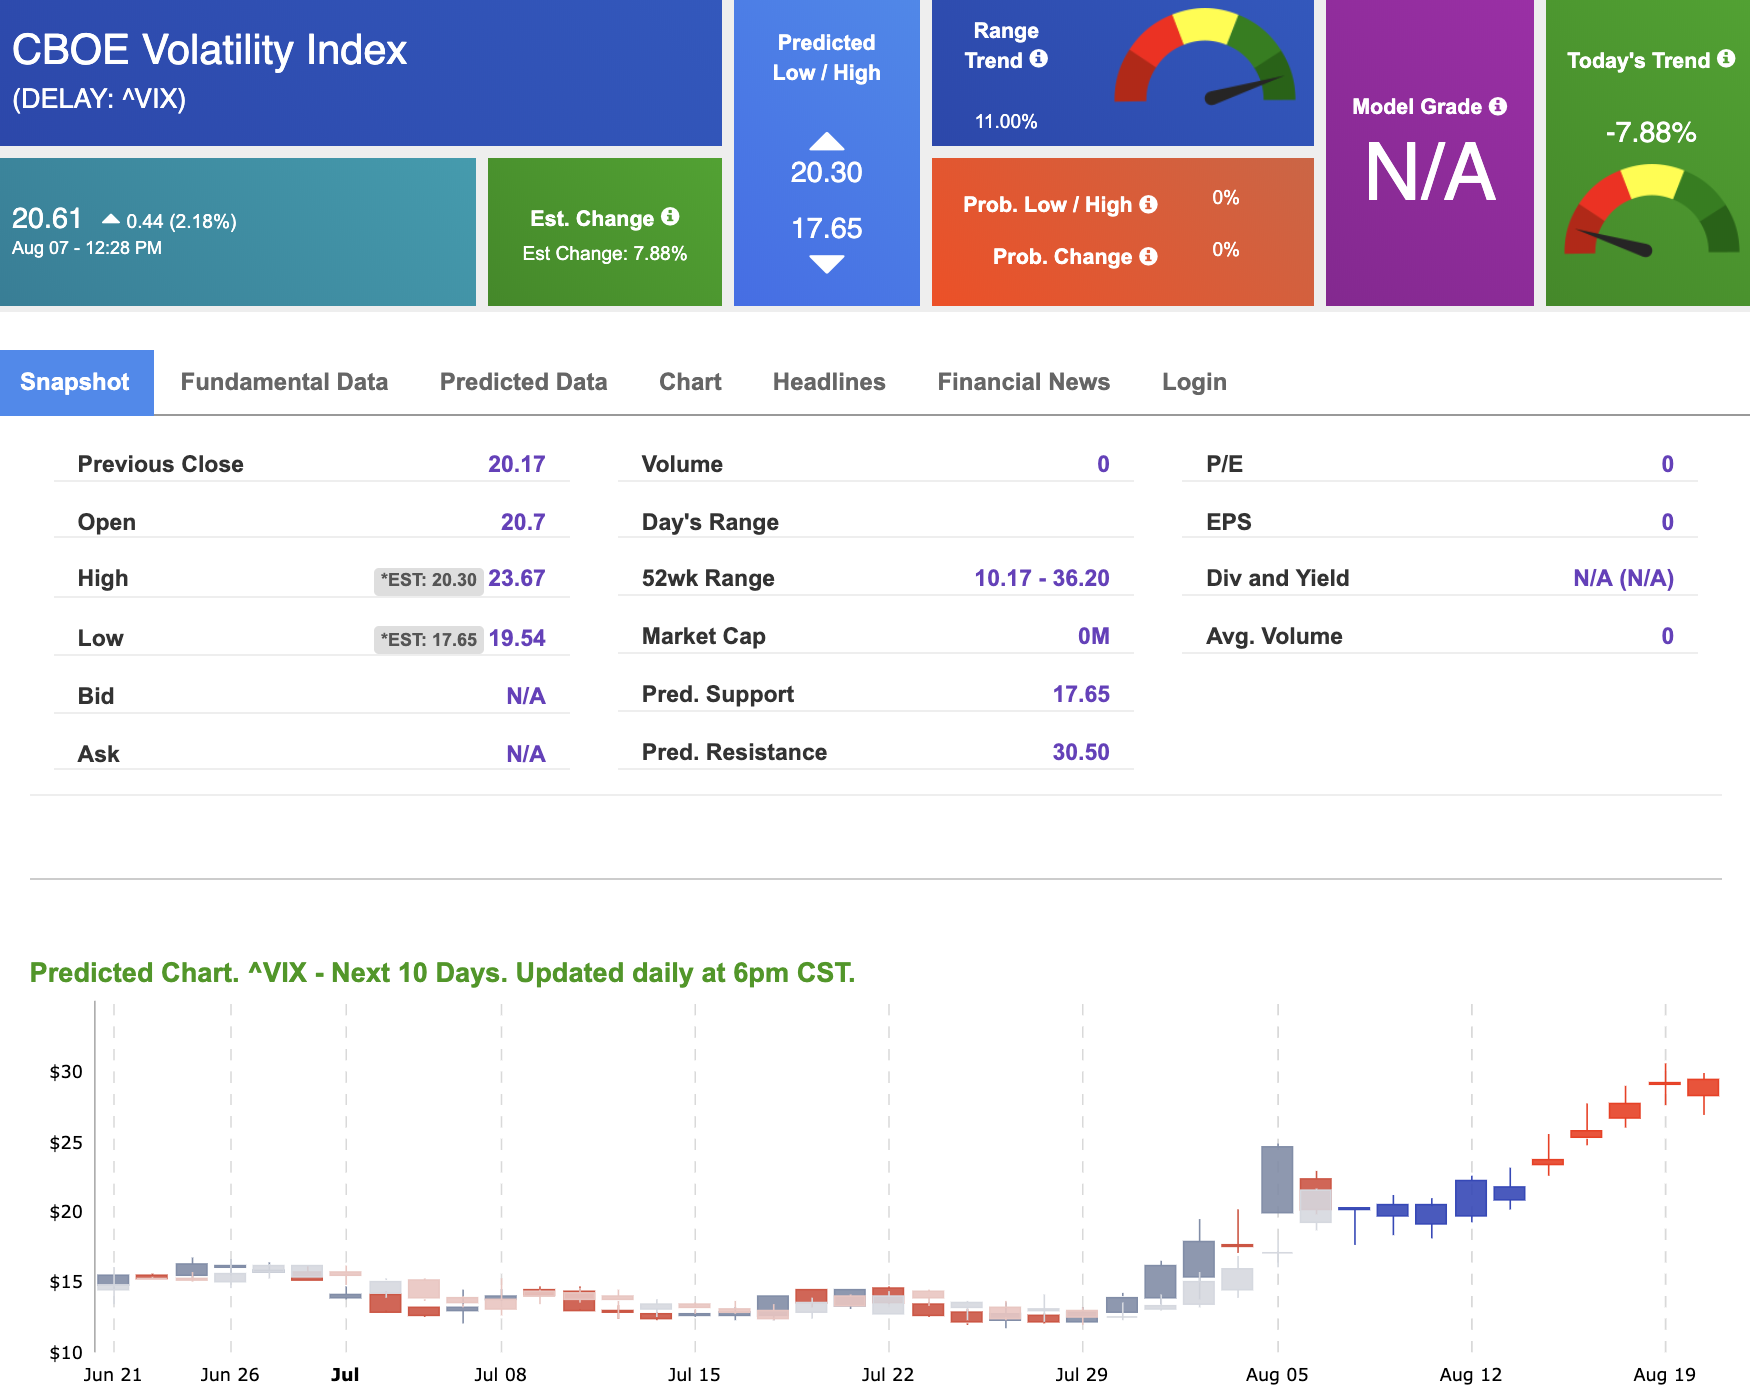
The CBOE Volatility Index (^VIX) is up 2.18% at $20.61 at the time of publication, and our 10-day prediction window shows mixed signals. The predicted close for tomorrow is $20.61 with a vector of -7.88%. Prediction data is uploaded after market close at 6 p.m., CST. Today’s data is based on market signals from the previous trading session.
(Want free training resources? Check our our training section for videos and tips!)
I’VE GOT SKIN IN THIS GAME!
Even in this wild market, you can do it too. This no-risk trial will empower you with the same incredible volatility tested “tools” I use to trade my own money! Our AI will forecast any “Buy-Sell” Signals with a stunning 75% win rate for both a short- and long-term investment strategy.
Click here for more info…
(Want free training resources? Check our our training section for videos and tips!)