U.S. Markets Rebound After One Of The Worst Weeks Of 2018
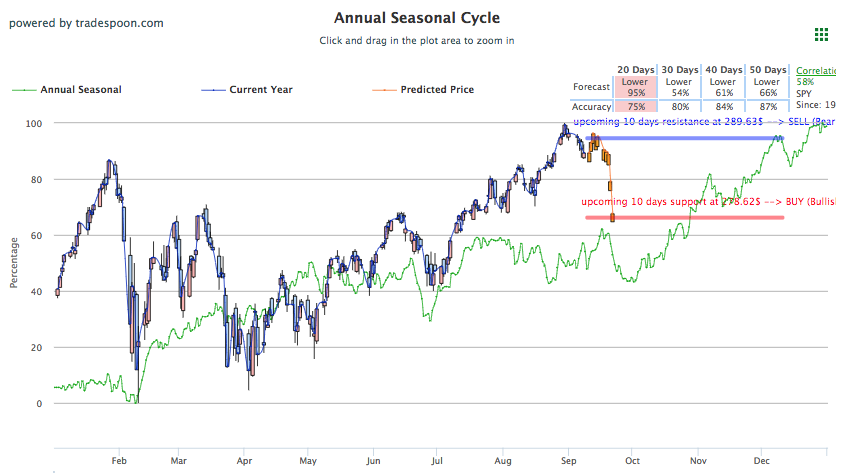
U.S. Markets are on the rebound today after four straight losses for the S&P and Nasdaq to end last week. The slide last week was fueled by recoil in trade-related optimism that fueled stocks to all-time highs the week before only to slump strongly after escalating Chinese trade tension returns and a lack of a Canada deal that has yet to be worked out. To end the week, President Trump threatened China with additional tariffs on over $250 billion in Chinese goods, which comes on top of already-proposed $200 billion in tariffs. Tech faced the biggest drop in shares in last week’s decline with added attention as tech-execs made their way to D.C. to testify on misinformation while Apple commented on the growing rate of tariffs indicating it would hurt business; while President Trump responded by encouraging Apple to move its factories from China to the U.S. in a tweet. Readjusted SPY seasonal chart, below, reflects new support and resistance levels:

Globally, European stocks were slightly higher while Asian markets felt the pressure from escalating tariffs and trading significantly lower. With China and Canada trade-related issues still unresolved, movement has been slight today. The Dow Jones rose in early morning trading only to drop later to remain unmoved for the day. All eleven sectors of the S&P are up today, bringing the index up 0.21%, while the Nasdaq is holding a slight gain of 0.13%. Still, all three indices are up for the year, and although the tech sector took the biggest hit last week it is still by far the biggest gaining sector of 2018. Look for the August consumer expectation survey to be released today while a July reading of consumer credit is expected shortly after that.
Tesla suffered a horrendous drop last week, adding to its troublesome month which has seen company’s share drop from a high of $379 in August, to its current $260-270 level. Worrisome actions by CEO Musk after the infamous “going private at $420” have propelled shares to trade lower. The bleeding seems to have stopped after Musk announced a couple management shake-ups on Friday, coupled with today’s successful rocket launch, that has the stock up 6%. Other big movers include Snap Inc. and Alibaba Group Holding, both dropping slightly after news that executives from both companies are expected to step down. CBS also fell in large part due to long-time CEO Les Moonves departure amid misconduct allegations.
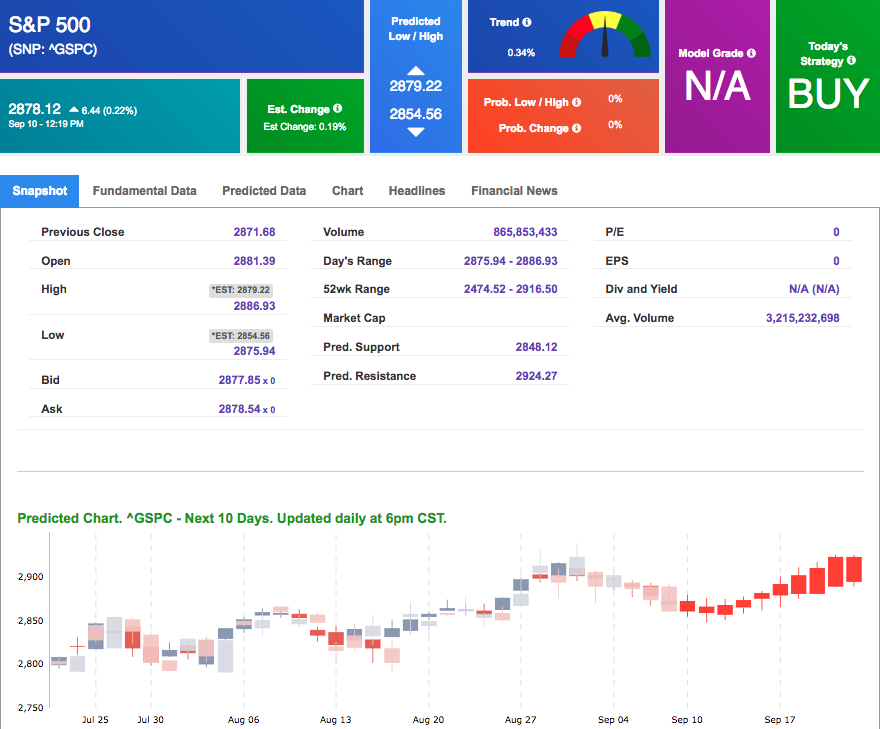
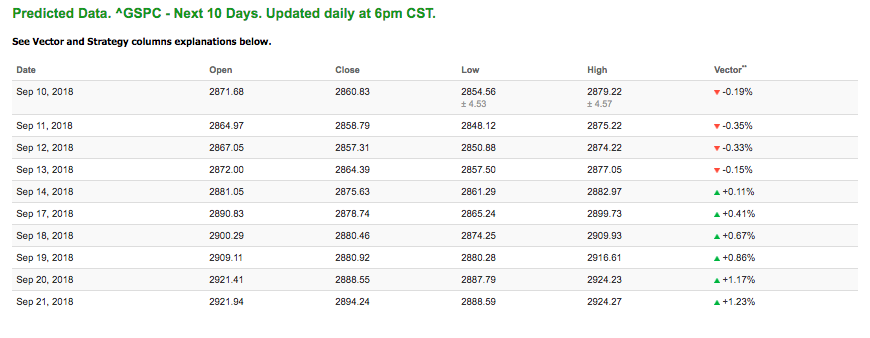
Using the ^GSPC symbol to analyze the S&P 500, our 10-day prediction window shows mixed signals. Today’s vector figure of -0.19% moves to +0.41% in five trading sessions. The predicted close for tomorrow is 2,858.79. Prediction data is uploaded after market close at 6 p.m., CST. Today’s data is based on market signals from the previous trading session.
Highlight of a Recent Winning Trade
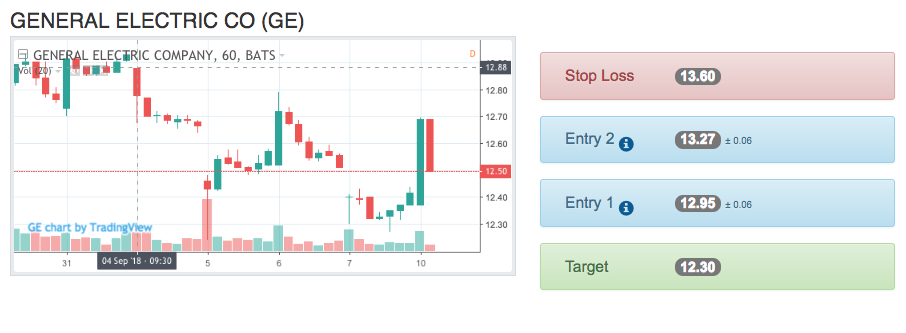
On September 4th, our ActiveInvestor service produced a bearish recommendation for General Electric Co. (GE). ActiveInvestor is included in Tradespoon Tools and Premium membership plans and is designed for swing trading.
Trade Breakdown
GE entered the forecasted Entry 1 price range of $12.95 (± 0.06) in its first hour of trading 9/4/18 and moved through its Target price of $12.30 in its third hour of trading on 9/7/18. The Stop Loss was set at $13.60.
We are offering a HUGE DISCOUNT on our Tools Membership!
Click here to read more…
Tuesday Morning Featured Stock
Our featured stock for Tuesday is Starbucks Corp (SBUX). COST is showing a confident vector trend in our Stock Forecast Toolbox’s 10-day forecast. This stock is assigned a Model Grade of (B) indicating it ranks in the top 25th percentile for accuracy for predicted support and resistance, relative to our entire data universe.
*Please note: Our featured stock is part of your free subscription service. It is not included in any paid Tradespoon subscription service. Vlad Karpel only trades his own personal money in paid subscription services. If you are a paid subscriber, please review your Premium Member Picks, ActiveTrader or ActiveInvestor recommendations. If you are interested in receiving Vlad’s personal picks, please click here.
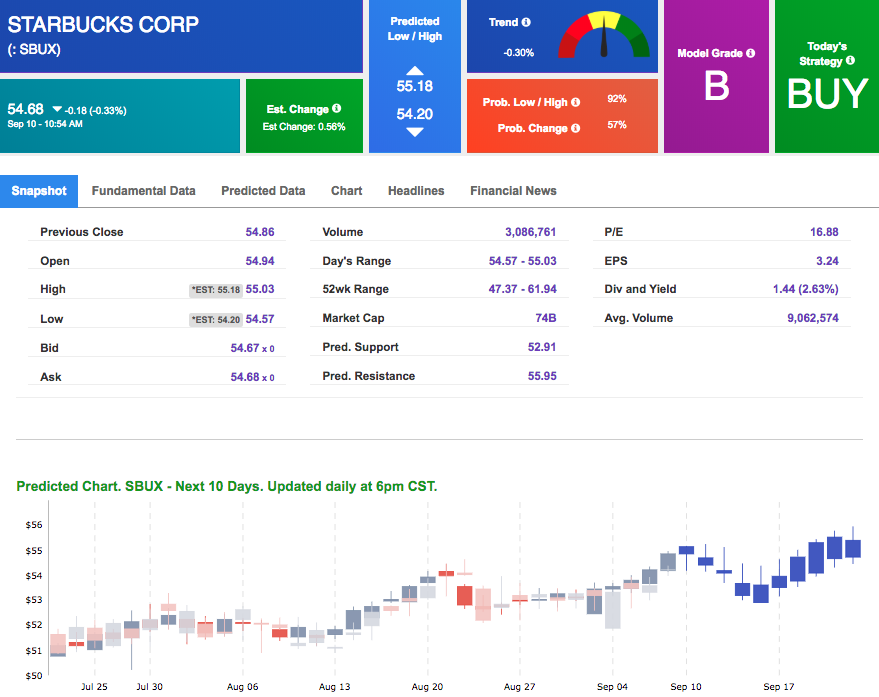
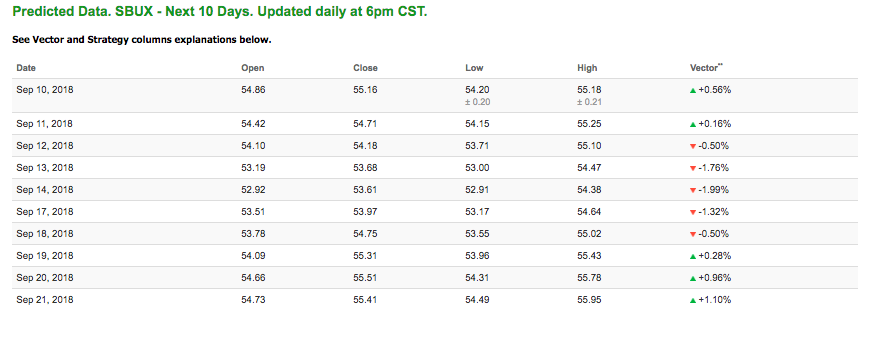
The stock is trading at $54.68 at the time of publication, down 0.33% from the open with a +0.56% vector figure.
Tuesday’s prediction shows an open price of $54.42, a low of $54.15 and a high of $55.25.
Prediction data is uploaded after market close at 6 p.m., CST. Today’s data is based on market signals from the previous trading session.
Note: The Vector column calculates the change of the Forecasted Average Price for next trading session relative to the average of actual prices for last trading session. The column shows expected average price movement “Up or Down”, in percent. Trend traders should trade along the predicted direction of the Vector. The higher the value of the Vector the higher its momentum.
Oil
West Texas Intermediate for October delivery (CLV8) is priced at $67.60 per barrel, down 0.22% from the open, at the time of publication. Prices lowered amid worries of storms in the Atlantic which could energy demand and cause other problems for producers. Global benchmarks, however, have gone higher behind expectations that Iranian sanctions will tighten the world’s oil supply.
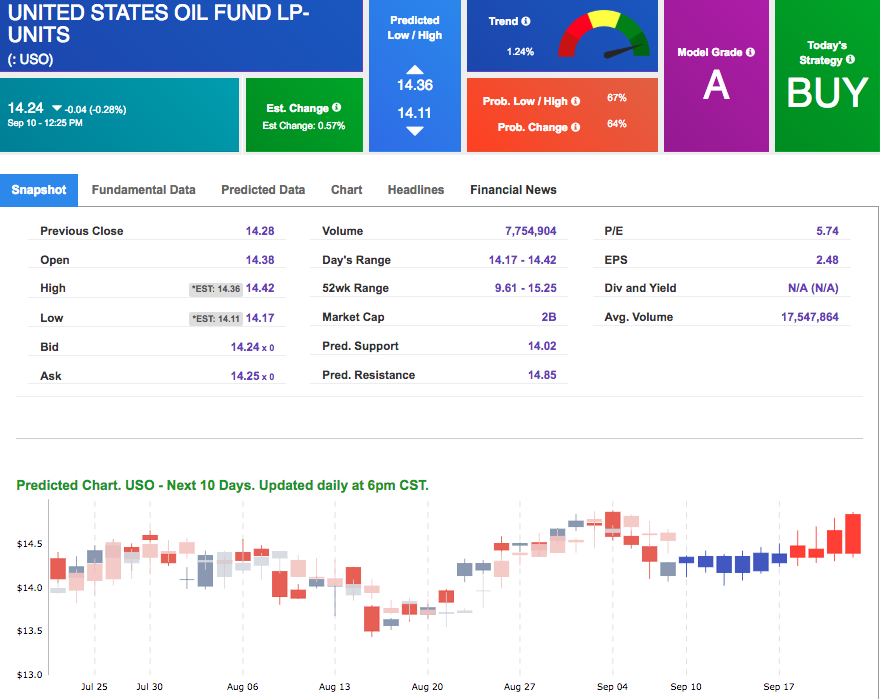
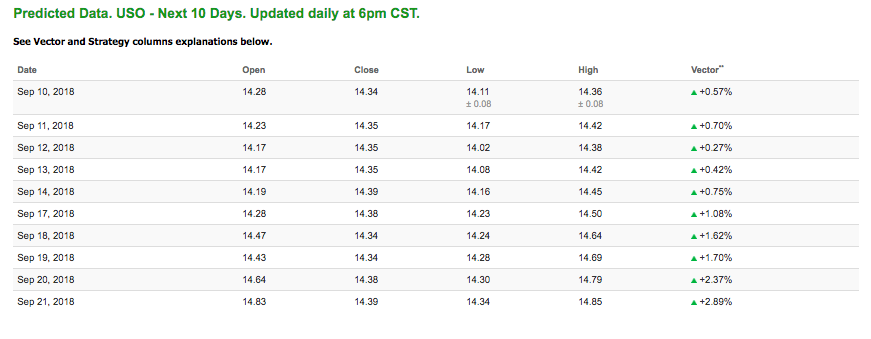
Looking at USO, a crude oil tracker, our 10-day prediction model mostly all positive signals. The fund is trading at $14.24 at the time of publication, down 0.28% from the open. Vector figures show +0.57% today, which turns +0.27% in two trading sessions. Prediction data is uploaded after market close at 6 p.m., CST. Today’s data is based on market signals from the previous trading session.
Gold
The price for December gold (GCZ8) is down 0.08% at $1,200.80 at the time of publication. After steep drops for the commodity last week, gold sees modest movement today behind a weakened dollar, which is unusual for the commodity. Probably pulling the metal in the negative direction is the positive jobs report which was released on Friday for the month of August and displayed good, growing data.
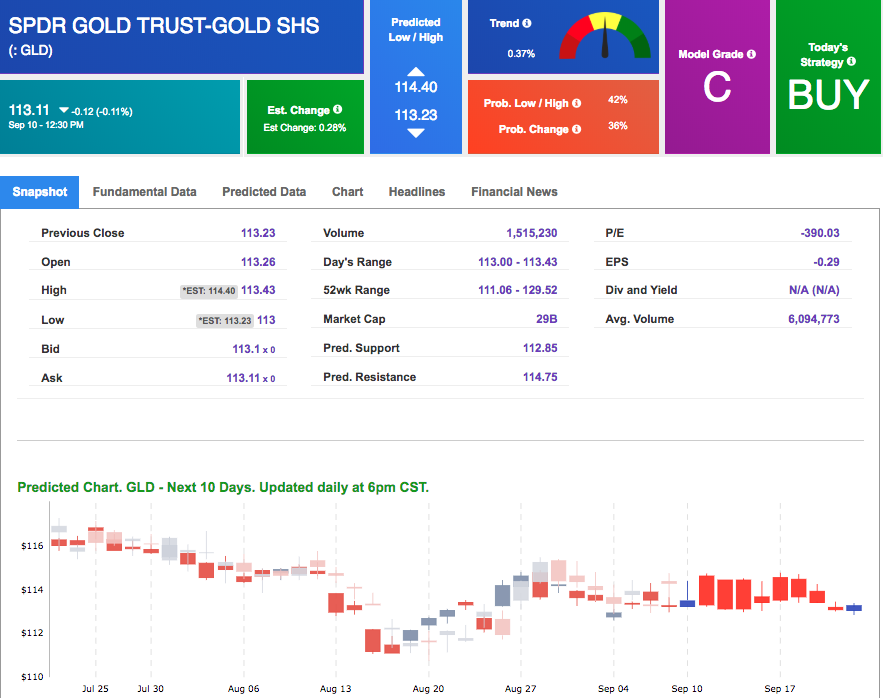
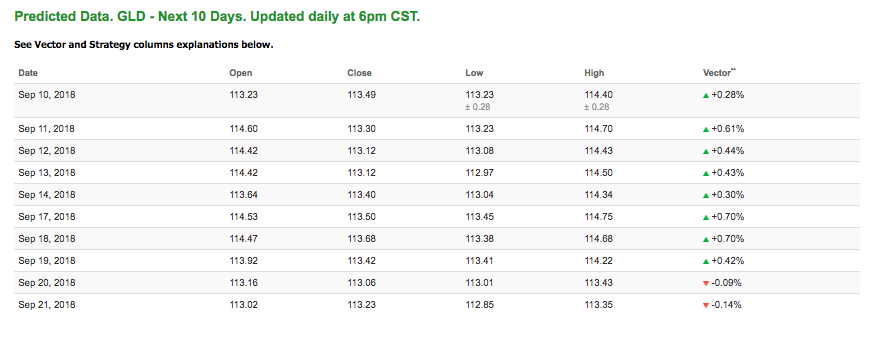
Using SPDR GOLD TRUST (GLD) as a tracker in our Stock Forecast Tool, the 10-day prediction window shows mostly positive signals. The gold proxy is trading at $113.11, down 0.11% at the time of publication. Vector signals show +0.28% for today. Prediction data is uploaded after market close at 6 p.m., CST. Today’s data is based on market signals from the previous trading session.
Treasuries
The yield on the 10-year Treasury note is down 0.28% at 2.93% at the time of publication. Yields are modestly moving today as investors monitor market conditions behind the already implemented tariffs, and look for indicators on how future tariffs can affect markets. Long-dated notes such as 10 and 30-year are currently seeing yields lower while shorter-dated notes are rising.
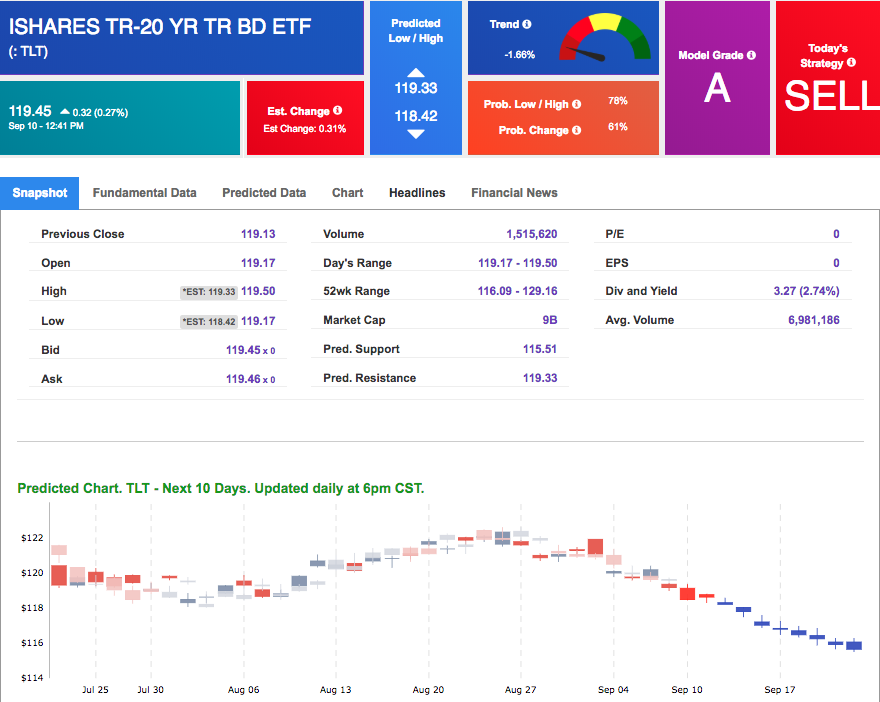
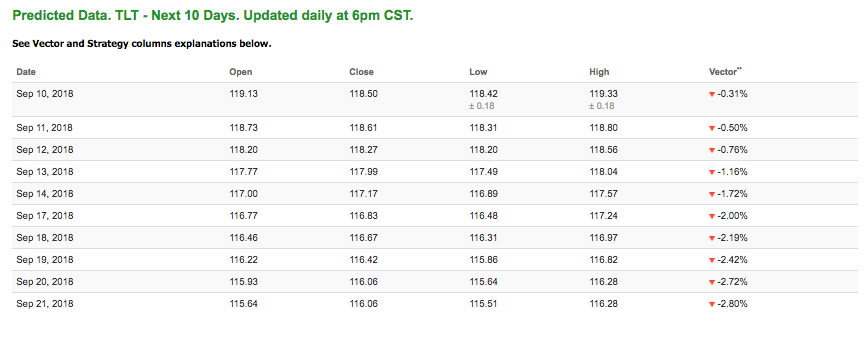
Using the iShares 20+ Year Treasury Bond ETF (TLT) as a proxy for bond prices in our Stock Forecast Tool, we see negative signals in our 10-day prediction window. Today’s vector of -0.31% moves to -1.16% in three sessions. Prediction data is uploaded after market close at 6 p.m., CST. Today’s data is based on market signals from the previous trading session.
Volatility
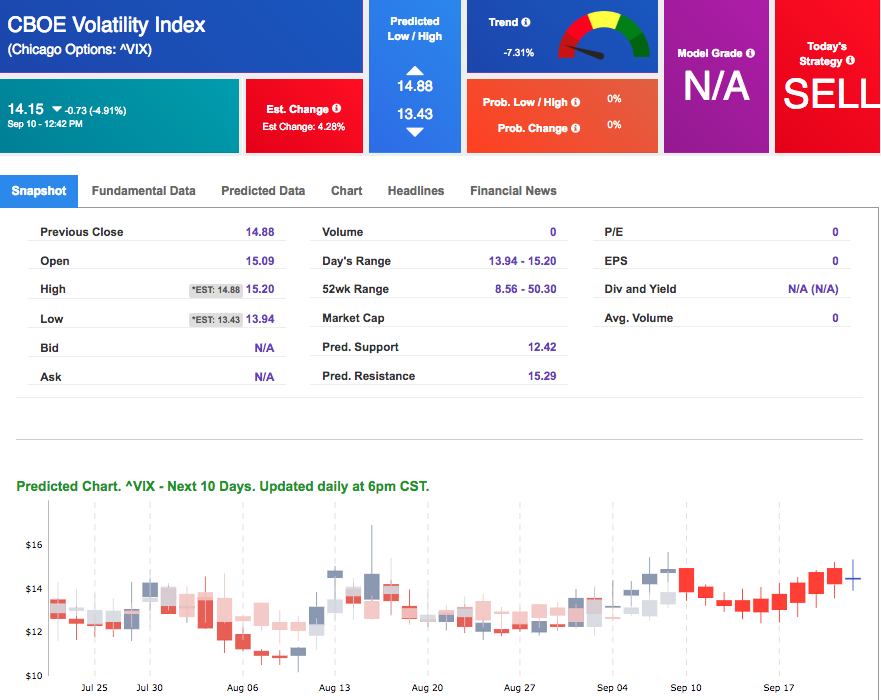
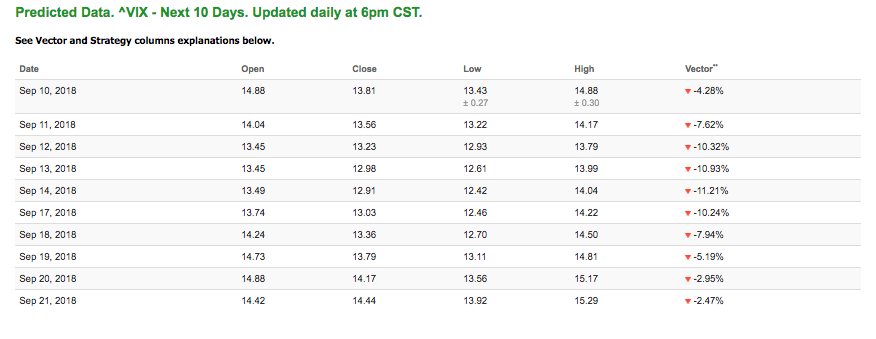
The CBOE Volatility Index (^VIX) is up 9.88% at $14.15 at the time of publication, and our 10-day prediction window shows all negative signals. The predicted close for tomorrow is $13.56 with a vector of -7.62%. Prediction data is uploaded after market close at 6 p.m., CST. Today’s data is based on market signals from the previous trading session.