U.S. Markets Reverse Course, Oil Sees Historic Drop
COVID’s impact on the economy add pressure to most sectors
Following a strong week for U.S. benchmarks, all three major indices turned lower today. Although talks of an additional stimulus package have begun making rounds, the latest economic data is illumining COVID’s impact on the economy and adding pressure to most sectors. This week, key earnings will be seen from IBM, Netflix, AT&T, and Intel. Elsewhere, oil is seeing a sharp drop, with prices plunging into the negative territory, as producers continue to face a lack of demand. The latest swing in prices reaffirms our notion that the market is susceptible to a 10-20% selloff and investors should consider hedging portfolios into the rallies. Although talks of an additional stimulus package began making rounds, the latest economic reports and corporate earnings continue are illuminating COVID’s impact on the economy.
(Want free training resources? Check our our training section for videos and tips!)
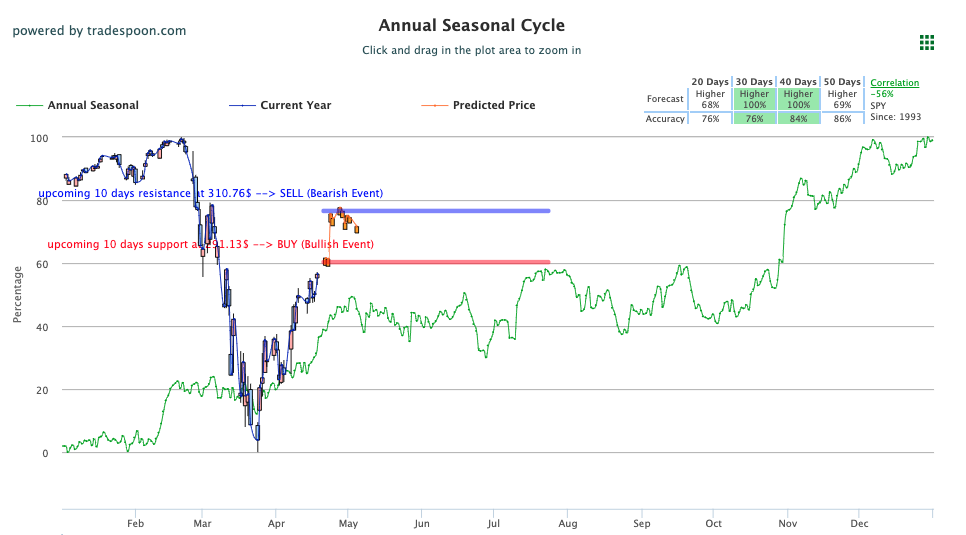
At this point, we do not see the market retesting recent lows and could realistically reach 50% retracement on SPY $250-$260 level. Our opinion remains: the market is overbought in the short term and long-term investors can consider buying equities with dollar-cost averaging in mind. Market Commentary readers are encouraged to maintain clearly defined stop-levels for all positions. For reference, the SPY Seasonal Chart is shown below:

Oil drops over 300%
Oil saw the biggest movement today with May-contracts that are set to expire dropping over 300% as oil producers continue dealing with a lack of demand. Talks of an additional stimulus package are on-going while at the same time several sectors of the economy are looking to reopen in the near future when lockdown could be loosened. Globally, Asian markets closed to mixed results while Europe traded higher. Gold and the dollar saw slight gains today while U.S. treasury yields lowered. The latest COVID data shows over 70,000 successful recoveries in the U.S., while the death toll sits at 42,000.
Symbols making significant moves today include:
- CL.1 -187% West Texas Intermediate Oil contracts dropped in record rates ahead of their expiration dates with global oil demanding severely lower
- SHAK +6% Shake Shack shares traded higher after the company announced it would return its $10 million loan it received from the government intended for small business
Key U.S. Economic Reports Out This Week:
- Existing Home Sales (March) – Tuesday
- Weekly Jobless Claims (4/11) – Thursday
- New Home Sales (March) – Thursday
- Consumer Sentiment Index (April) – Friday
- Durable Goods Orders (March) – Friday
- Core Capital Goods Orders (March) – Friday
Key Corporate Earnings Out This Week:
- IBM – International Business Machines – Monday, April 20th
- NFLX – Netflix – Tuesday, April 21st
- KO – Coca-Cola Company – Tuesday, April 21st
- PM – Philip Morris – Tuesday, April 21st
- T – AT&T – Wednesday, April 22nd
- PYPL – PayPal Holdings – Wednesday, April 22nd
- INTC – Intel Corporation – Thursday, April 23rd
- MMM – 3M Company – Thursday, April 23rd
- VZ – Verizon Communications – Friday, April 24th
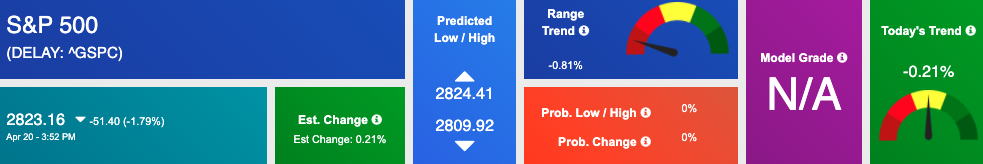
Using the “^GSPC” symbol to analyze the S&P 500 our 10-day prediction window shows a near-term mixed outlook. Prediction data is uploaded after the market closes at 6 p.m. CST. Today’s data is based on market signals from the previous trading session.
Vlad’s Portfolio Lifetime Membership!
DO AS I DO… AS I DO IT WATCH LIVE AS I WORK THE MARKETS! TRY IT NOW RISK-FREE!
Click Here to Sign Up
Highlight of a Recent Winning Trade
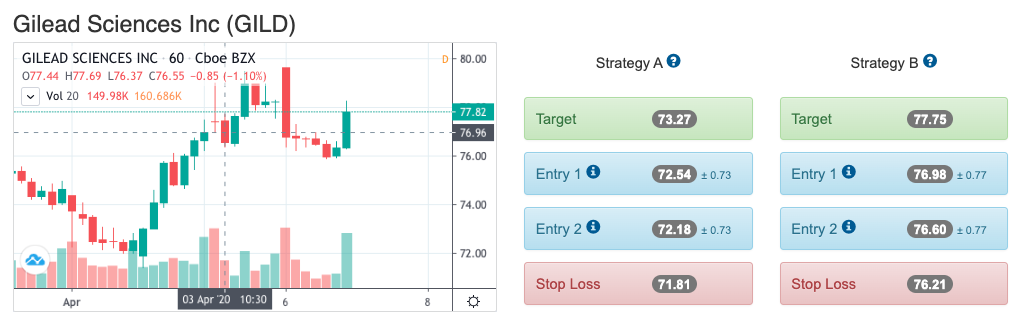
On April 3rd, our ActiveTrader service produced a bullish recommendation for Gilead Sciences Inc (GILD). ActiveTrader is included in several Tradespoon membership plans and is designed for day trading, with signals meant to last for 1-2 days.
Trade Breakdown
GILD entered its forecasted Strategy B Entry 1 price range $76.98(± 0.77) in the second hour of trading that day and passed through its Target price of $77.75 in the fourth hour of trading that day. The Stop Loss price was set at $76.21.
Tuesday Morning Featured Symbol
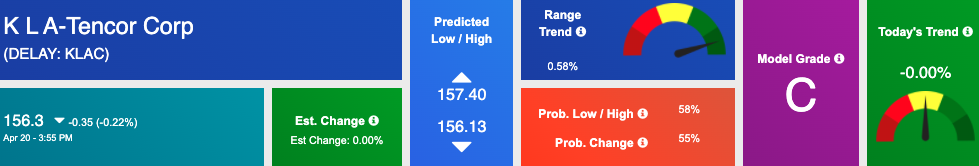
Our featured symbol for Tuesday is KLA – Tencor (KLAC). KLAC is showing a steady vector in our Stock Forecast Toolbox’s 10-day forecast. This stock is assigned a Model Grade of (C) indicating it ranks in the top 50th percentile for accuracy for current-day predicted support and resistance, relative to our entire data universe.
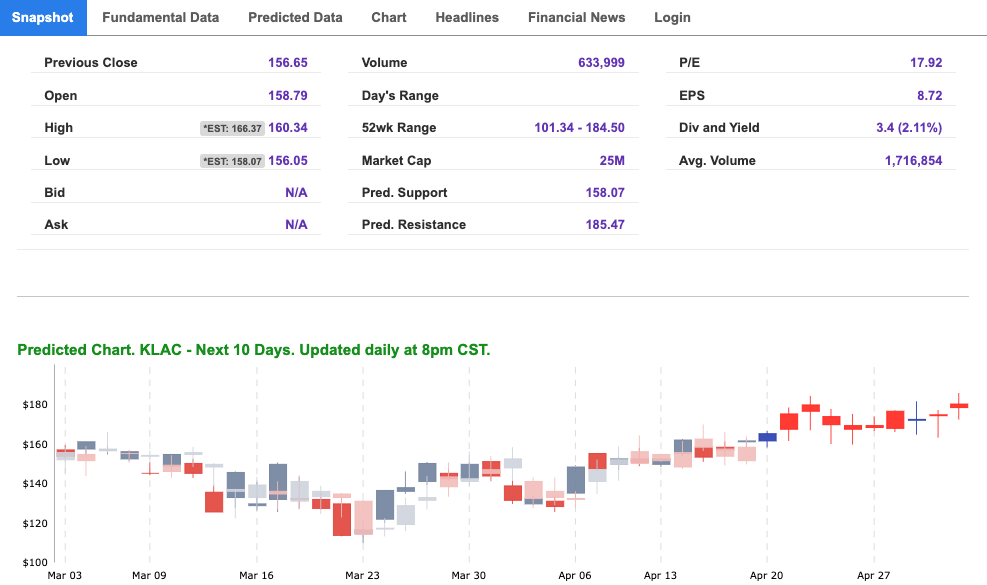
The stock is trading at $156.3, with a vector of +1.29% at the time of publication.
Prediction data is uploaded after the market close at 6 p.m., CST. Today’s data is based on market signals from the previous trading session.

Note: The Vector column calculates the change of the Forecasted Average Price for the next trading session relative to the average of actual prices for the last trading session. The column shows the expected average price movement “Up or Down”, in percent. Trend traders should trade along the predicted direction of the Vector. The higher the value of the Vector the higher its momentum.
*Please note: At the time of publication Vlad Karpel does not have a position in the featured symbol, KLAC. Our featured symbol is part of your free subscription service. It is not included in any paid Tradespoon subscription service. Vlad Karpel only trades his own personal money in paid subscription services. If you are a paid subscriber, please review your Premium Member Picks, ActiveTrader or MonthlyTrader recommendations. If you are interested in receiving Vlad’s personal picks, please click here.
Oil
West Texas Intermediate for Crude Oil delivery (CL.1) is priced at $-13.10 per barrel, down 171% from the open, at the time of publication.
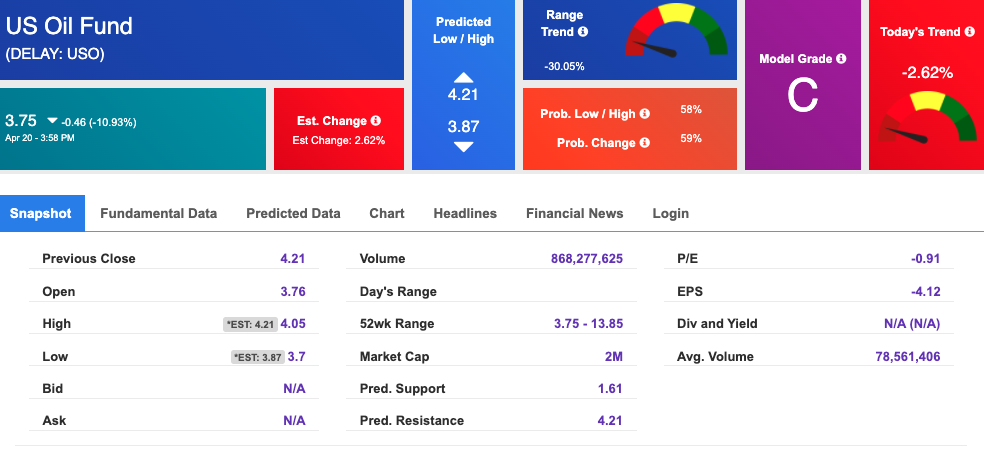
Looking at USO, a crude oil tracker, our 10-day prediction model shows mixed signals. The fund is trading at $3.75 at the time of publication. Prediction data is uploaded after the market close at 6 p.m., CST. Today’s data is based on market signals from the previous trading session.
Gold
The price for the Gold Continuous Contract (GC00) is up 0.80% at $1,712.40 at the time of publication.
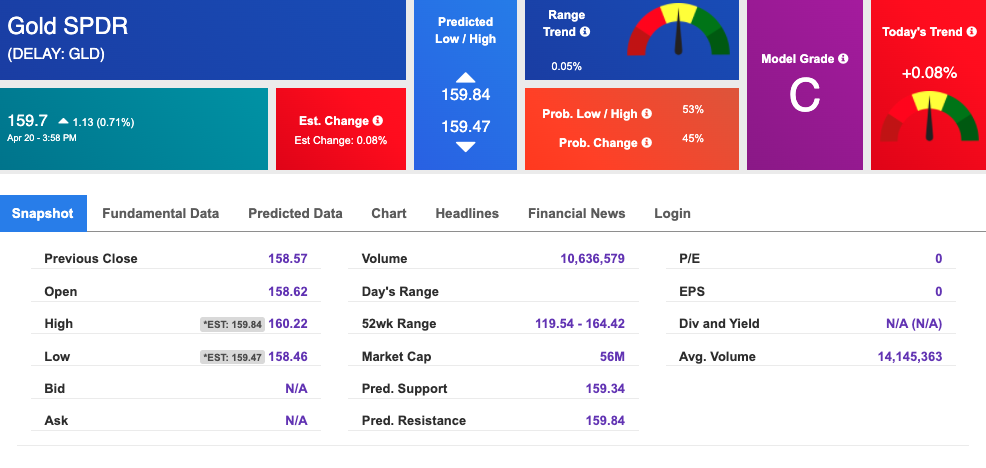
Using SPDR GOLD TRUST (GLD) as a tracker in our Stock Forecast Tool, the 10-day prediction window shows mixed signals. The gold proxy is trading at $159.7, at the time of publication. Vector signals show -0.08% for today. Prediction data is uploaded after the market close at 6 p.m., CST. Today’s data is based on market signals from the previous trading session.
Treasuries
The yield on the 10-year Treasury note is down to 0.64% at the time of publication.
The yield on the 30-year Treasury note is down to 1.273% at the time of publication.
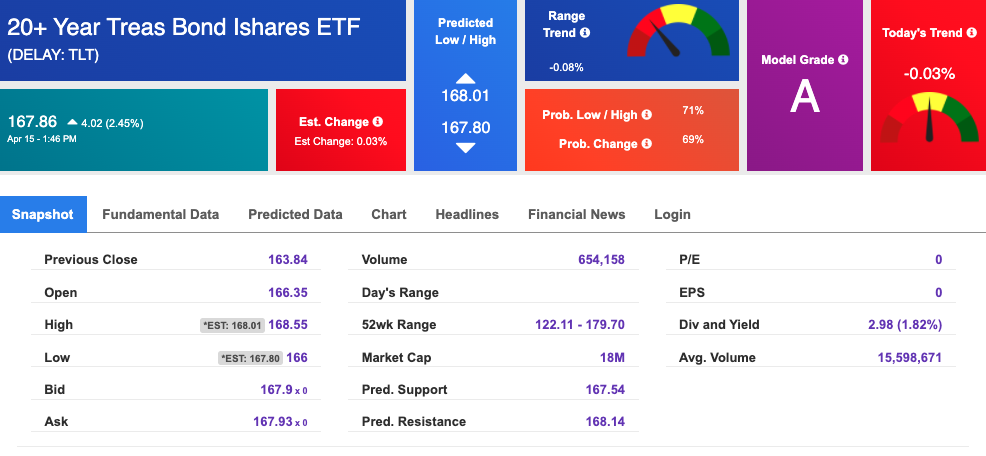
Using the iShares 20+ Year Treasury Bond ETF (TLT) as a proxy for bond prices in our Stock Forecast Tool, we see negative signals in our 10-day prediction window. Prediction data is uploaded after the market close at 6 p.m., CST. Today’s data is based on market signals from the previous trading session.
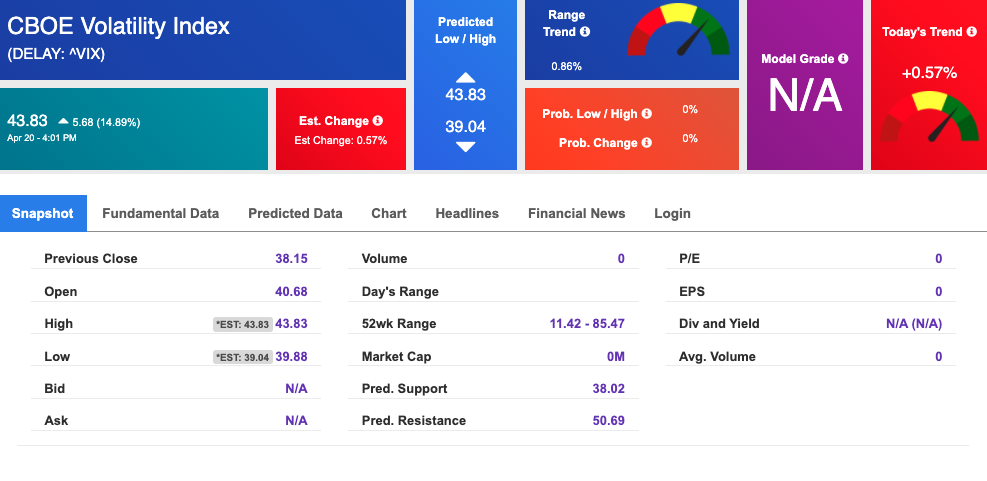
Volatility
The CBOE Volatility Index (^VIX) is $43.83 at the time of publication, and our 10-day prediction window shows mixed signals. Prediction data is uploaded after the market close at 6 p.m., CST. Today’s data is based on market signals from the previous trading session.