S&P Tops 6,000 Level
We mentioned the RSI levels for the major indexes in our opening writeup so let’s start there. For new subscribers, when a stock or index clears RSI levels above 70, it is considered oversold. On the flip side, when RSI levels are at 30 and below, a stock or index is considered oversold.
It is important to note that overbought and oversold conditions can remain in play for days and weeks with levels reaching 80 and 90, or 20 and the low teens. The Nasdaq, for example, was overbought in June and July and pushed 80 both months. On the August 5th market lows, RSI kissed 30 before a sharp rebound.
RSI closed at 68 for both the Nasdaq and the S&P on Friday. The Russell is at 72 but tagged 80 in July and the Dow’s RSI went out at 68 after flatlining at 66 on Thursday.
At some point this month, or next, RSI levels will likely give hints of when the market is topping, especially if 70 holds in the upcoming week. This would then be considered the start of a back-and-fill process following last week’s breakout to higher highs. The key for the bulls will be to hold fresh support levels that served as prior resistance and we will cover that in a moment.
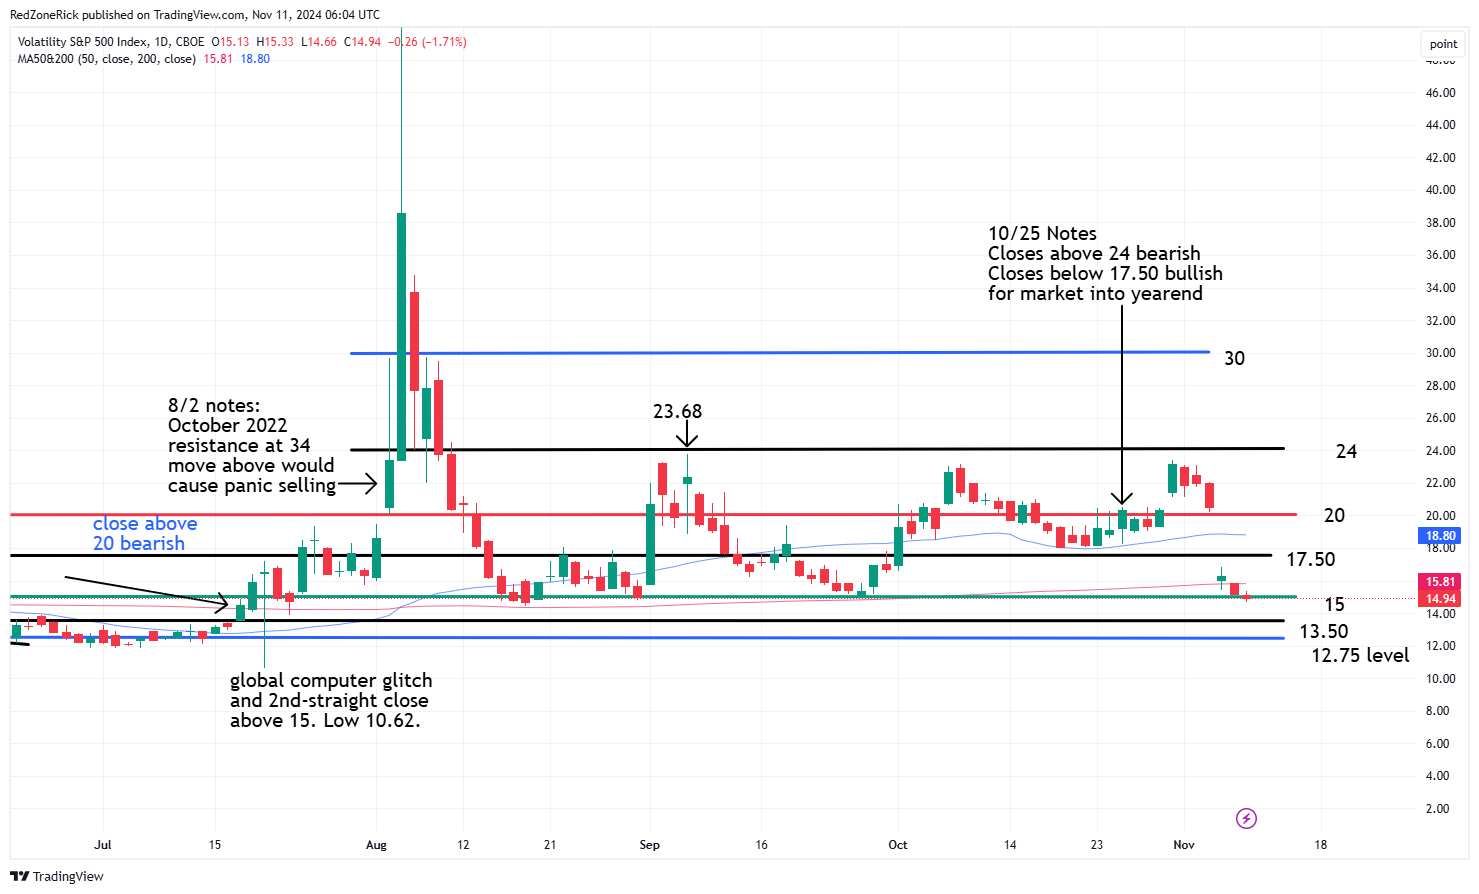
Once again, the action on the Volatility Index (VIX) was money after the close below 20 AND 17.50 on Wednesday. The prior Thursday, Friday, and Monday peaks failed to clear 24 which would have been a bearish signal ahead of the election. Tuesday’s low on the VIX was at 20.20 and basically a half-point close above key support at 20.
We had repeatedly said throughout October, a close back below 17.50 during the 3Q earnings season would be super bullish for a retest towards 15. On Wednesday, after the election results, the VIX sank over 20% while closing at 16.27. Thursday’s close at 15.20 recovered the 200-day moving average and Friday’s close at 14.94 recovered the 15 level.
Our feeling over the near-term is that the VIX could trade down to 13.50-12.75 on continued closes below 15. This would be bullish for the market but where we would look for signs of a market top. We will turn slightly bearish again on the market once the bears recover 17.50 and then 19-20.

The only index out of the four horseman that hasn’t traded to an all-time high this year is the Russell 2000. Our notes from October 9th said a breakout could occur on closes above 2,260. Tuesday’s close ahead of the election was right at 2,260 with Wednesday’s 5.8% surge to 2,393 getting 2,400 in focus.
We said a run to the all-time at 2,444 from November 2021 could come quickly with Thursday and Friday’s highs at 2,402 and 2,401. The close at 2,399 keeps a 2% move to fresh record highs in play.

In late February, with the index at 2,016, we penciled 25% upside to 2,500 at some point this year, or next. This is basically 4% away from happening. On the flip-side, shaky support is at 2,375 with gap down potential to 2,300. A close below this level might signal a near-term top but we would wait for a break below 2,260 before we would turn bearish on the small-caps.
From our February 26th market update:
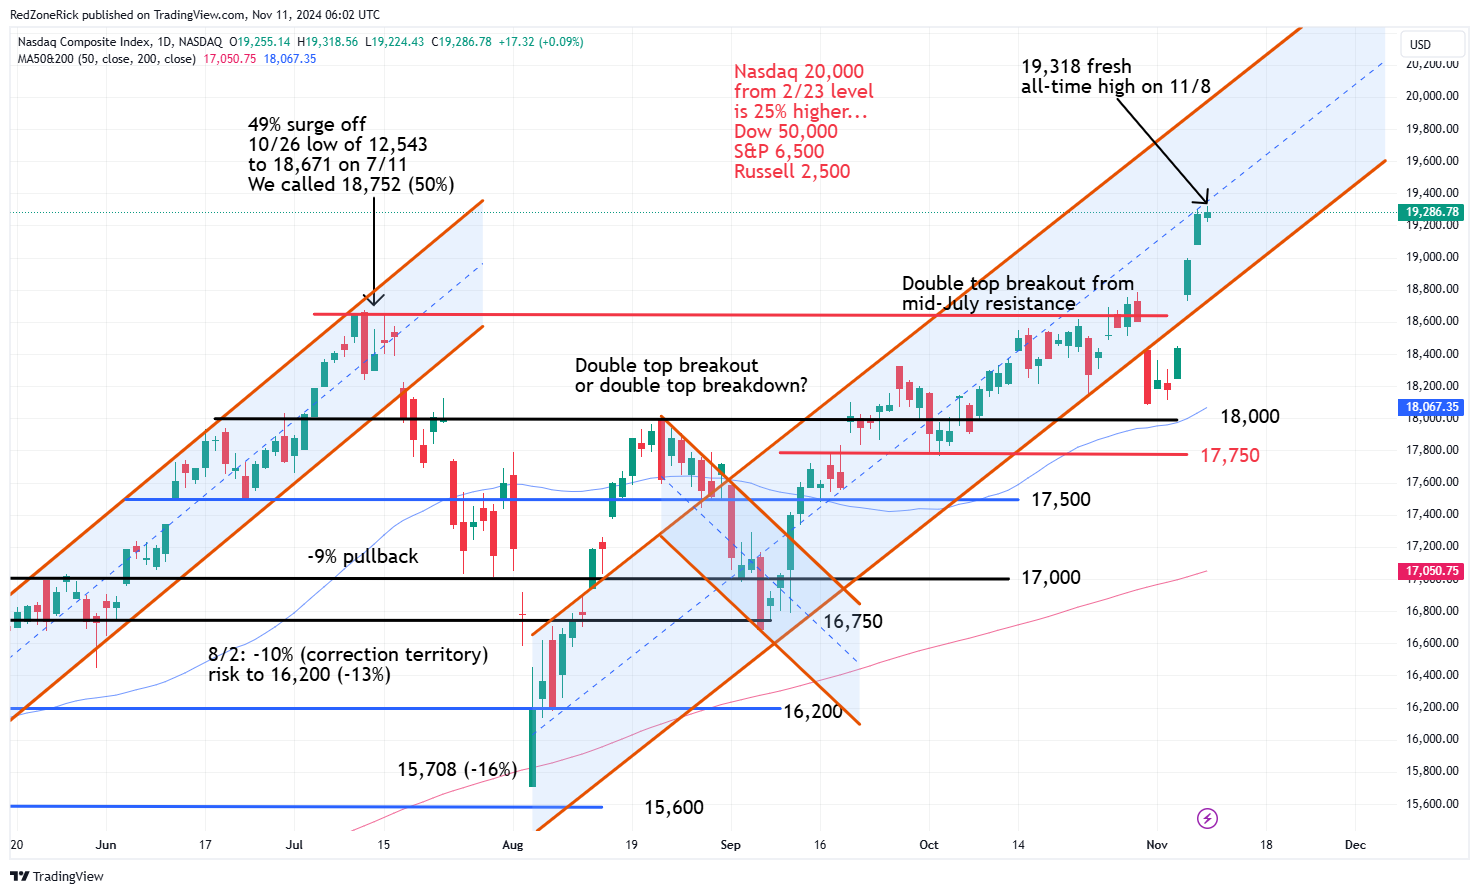
“The Nasdaq’s all-time intraday high is at 16,212 from November 22nd 2021 and where we have talked about a possible double-top forming if there is not a strong breakout from current levels. However, if the “AI” rally remains strong over the near-term, and this year, dare we say Nasdaq 20,000?
At current levels, this would represent another 25% upside but can this type of rally be sustained? While we are at it, 25% for the Dow from our near-term price target of 40,000 target would be 50,000 and for the S&P we would have to raise our near-term target from 5,100 to 6,500.
That would be amazing if those targets trip this year, but more likely in 2025, and that’s assuming there are no major corrections, or world disasters.”
The Nasdaq made a double-top breakout last week after teasing us the week before. The chart shows Friday’s close in the middle of the uptrend channel off the August 5th lows with the top of the channel now pushing 20,000. Key support is now at 19,000 with a close back below 18,800 and out of the bottom of the uptrend channel would be a warning sign. Continued closes back below 18,600 and the double top breakout level would likely suggest a near-term top.

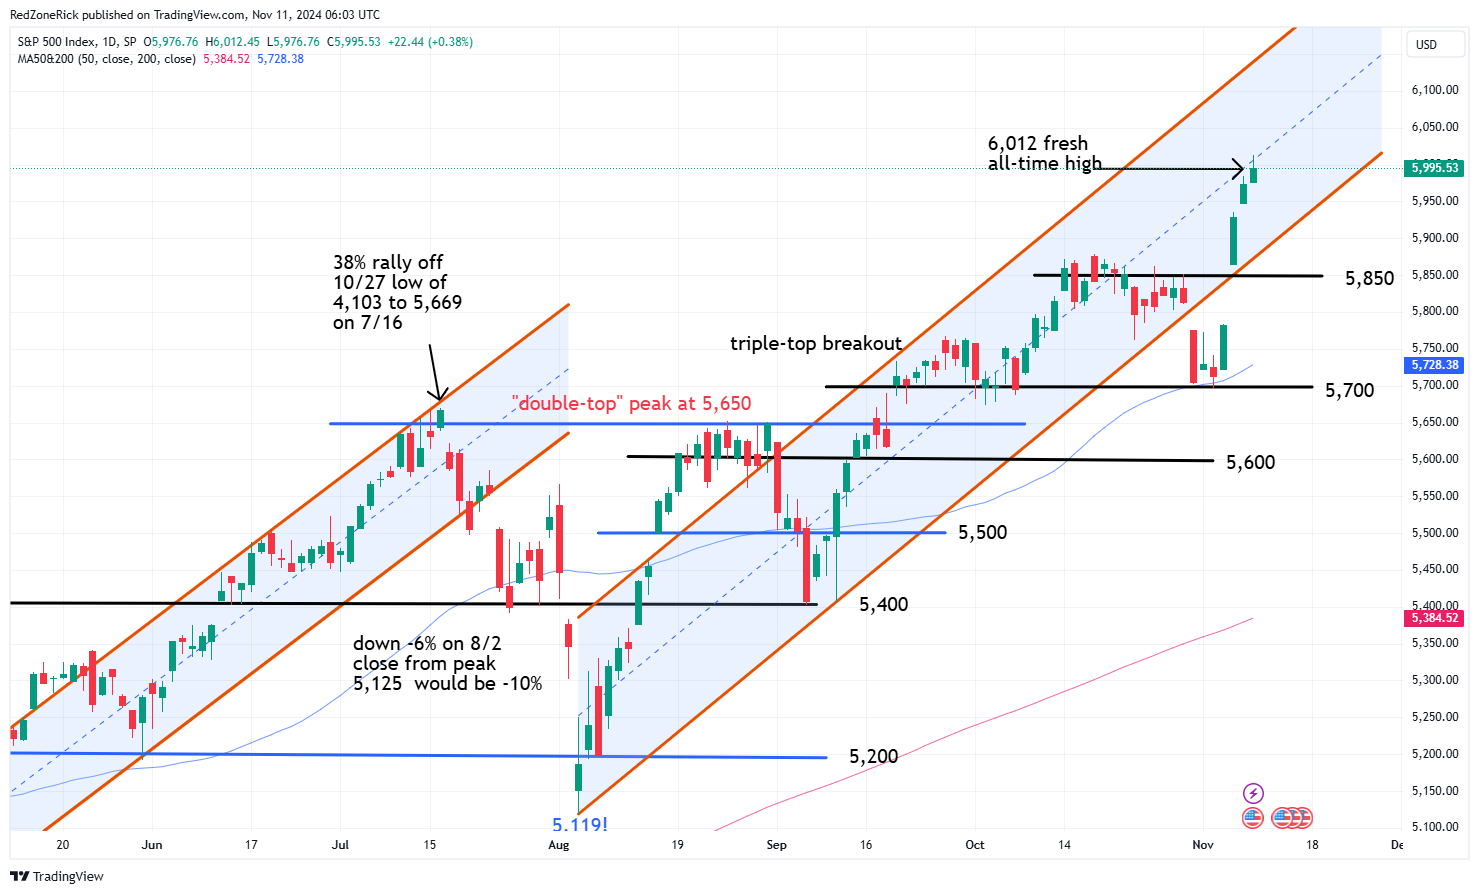
The S&P is also in the middle of its uptrend channel with the top of the channel continued upside to 6,200 over the near-term. Fresh support levels are at 5,950-5,900. A move below 5,850 and prior resistance throughout the back half of October would be slightly bearish. A near-term top would likely occur on closes 5,725-5,700 and the 50-day moving average.

The Dow’s breakout above crucial resistance from last month at 43,250 was a renewed bullish development with this level now representing key support. Last week’s pop got the index back into its uptrend channel with the top showing possible momentum to 46,000. There is wiggle room down to 42,500 on a close below 43,250.
