Boeing and Microsoft Release Q3 Earnings Today, Amazon and Visa Due Tomorrow
Microsoft, Tesla, and Ford earnings in focus
Earnings season is in full swing with Microsoft, Tesla, and Ford set to report after market close today, with Caterpillar and Boeing having released third-quarter earnings before the market opened.
All three major U.S. indices are on track to close in the green
Yesterday, markets traded lower off mixed earnings results and continued impeachment concerns while today all three major U.S. indices are on track to close in the green. Brexit developments and U.S.-China tensions remain key as the month wraps up; next week look for the two-day FOMC meeting to dictate markets and inform trades with an announcement on the 30th.
(Want free training resources? Check our our training section for videos and tips!)
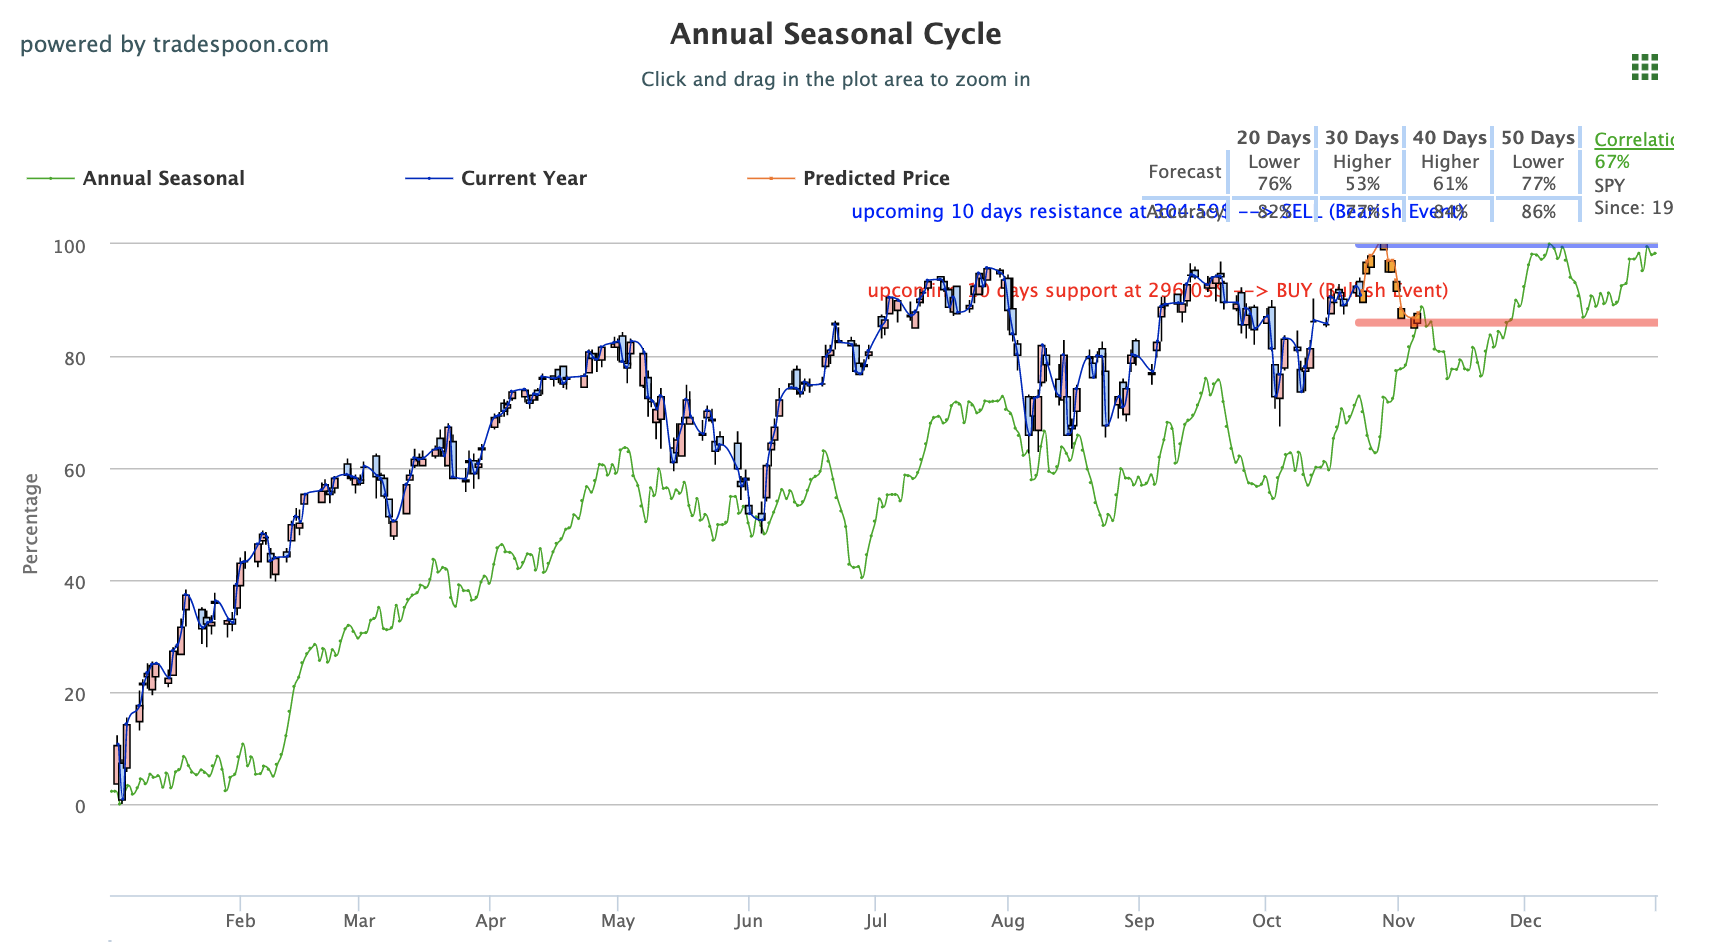
With little evidence the market will retest its 200 days MA, we believe it is just a matter of time for the market to break through 52 weeks high. Further volatility is expected and, although we believe the market is range-bound, we recommend readers maintain clearly defined stop levels for all positions. We will continue to follow the semiconductor sector as we approach a strong seasonal trend for the market to make new highs, looking to buy with the SPY near $294-$296 level. SPY overhead resistance remains near $302-$305 level. For reference, the SPY Seasonal Chart is shown below:
Positive earnings helped major U.S. indices reverse course after lowering yesterday
Today’s uptick of positive earnings helped major U.S. indices reverse course after lowering yesterday. Caterpillar and Boeing each released impressive results which both supported markets and saw shares rise. Still to release today after the market closes include Microsoft, eBay, PayPal, Tesla, and Ford. Tomorrow, look for key reports from Amazon, Visa, and Intel after the market closes, Comcast and 3M before market open. Also releasing tomorrow will be September’s new home sales report and October manufacturing and service data. Waste Management and Texas Instruments saw shares lower following unimpressive earnings while Procter & Gamble rose over 2% on a strong Q3 report.
U.K. parliament reached an agreement on a partial Brexit plan
Other news surely impacting markets includes the latest Brexit, impeachment, and U.S.-China developments. Oversees, the U.K. parliament reached an agreement on a partial Brexit plan, however, it does not look like the October 31st deadline will be enacted as the U.K. received a three-month extension from the European Union.
Boris Johnson is lobbying for another election but the current status of a primary election or the Brexit bill remains unknown. Next week, the second to last Federal Open Market Committee meeting of 2019 will take place with a fed announcement on the 30th. With the latest impeachment proceedings and U.S.-China negotiations, it will be interesting to see how the Fed responds on whether or not these events will factor into their decision. Fed Chair Jerome Powell will, as he has all year, meet with the press following the Fed policy update.
(Want free training resources? Check our our training section for videos and tips!)
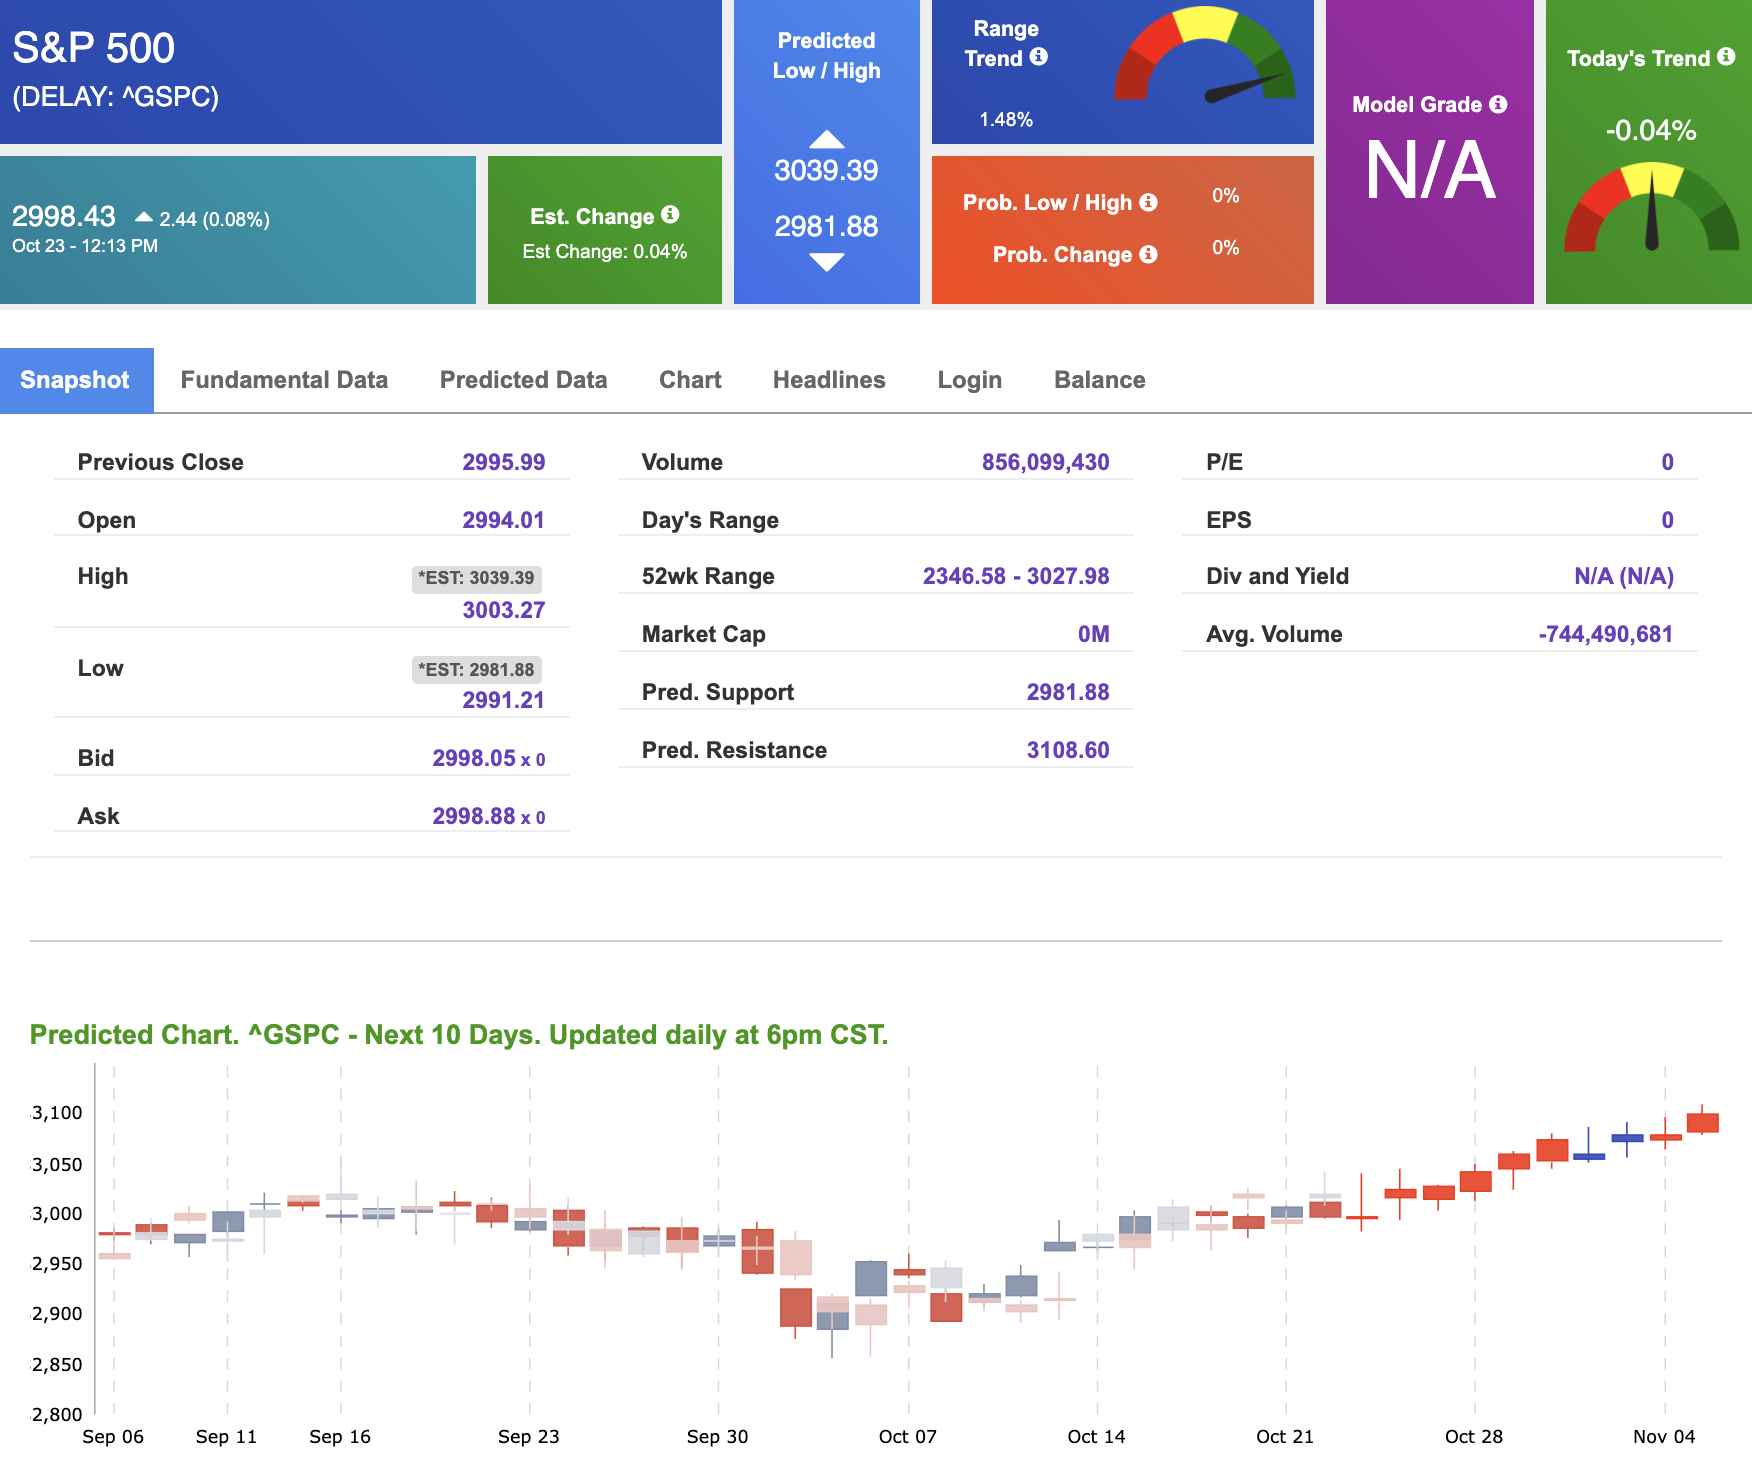
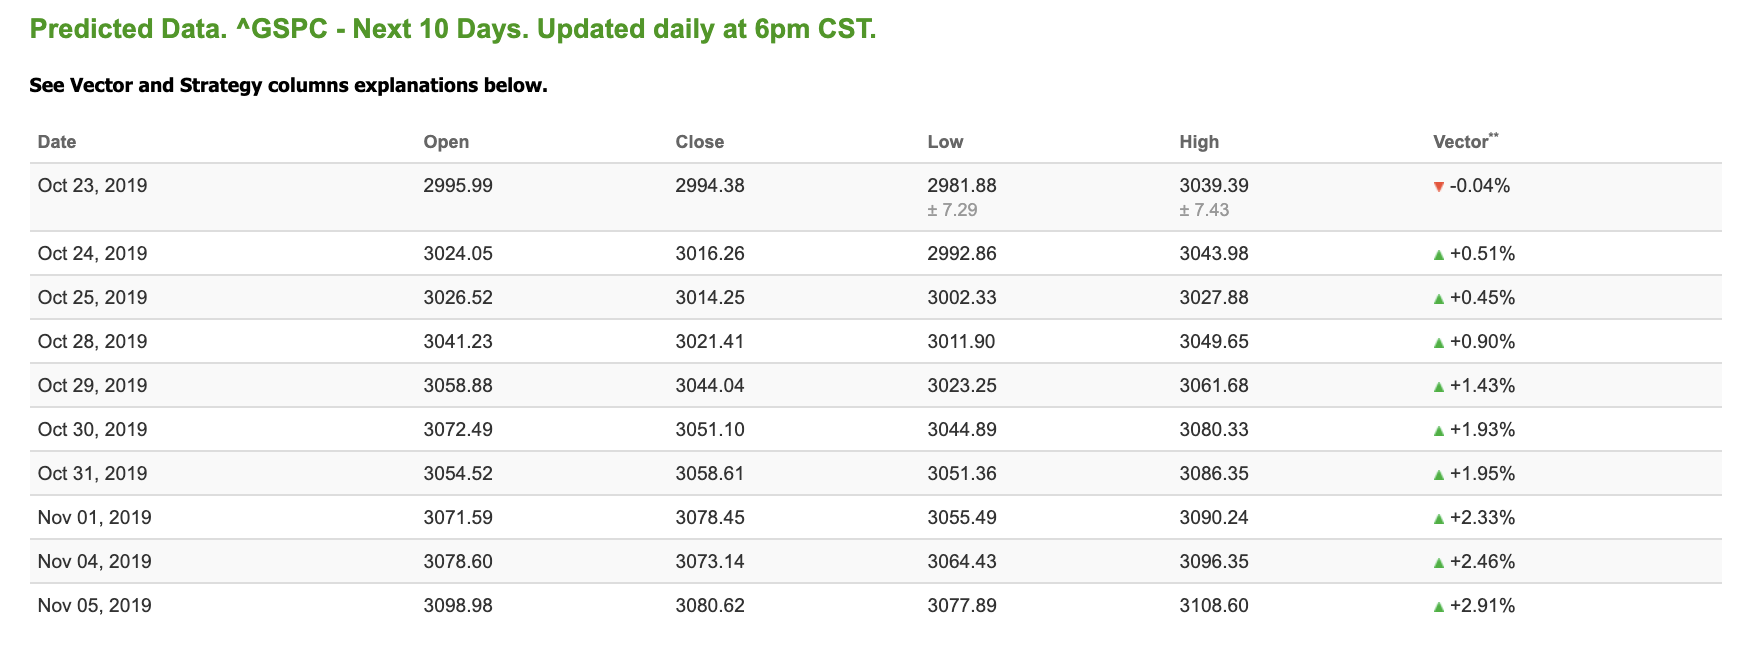
Using the “^GSPC” symbol to analyze the S&P 500 our 10-day prediction window shows mostly positive signals. Today’s vector figure of -0.04% moves to +1.93% in five trading sessions Prediction data is uploaded after the market close at 6 p.m. CST. Today’s data is based on market signals from the previous trading session.
SPECIAL OFFER: Lifetime Access to the Stock Forecast Toolbox!
Here’s a brief outline of what you get when you put Stock Forecast Toolbox to work:
The Stock Forecast Tool predicts how a stock’s price trend is moving in the short and long-term future. In other words, it references a historical set of data, finds a mathematical pattern, and predicts the stock’s price trend over a time period of 1 hour to 10 business days.
-
The Stock Forecast Toolbox is like a Crystal Ball!
-
It takes market data and runs it through complex algorithms and quantitative analytics that work behind the scene breaking it down into extremely useful information.
-
You don’t need to be a math nerd to understand that the Stock Forecast Toolbox gives you everything you need to determine which way a company’s stock price is trending during any given time period.
Click Here to Sign Up
Highlight of a Recent Winning Trade
On October 10th, our ActiveTrader service produced a bullish recommendation for Wal-Mart Stores (WMT). ActiveTrader is included in all paid Tradespoon membership plans and is designed for day trading.
Trade Breakdown
WMT entered its forecasted Strategy B Entry 1 price range $118.93 (± 0.36) in its first hour of trading and passed through its Target price of $120.12 in the second hour of trading the following trading day. The Stop Loss price was set at $117.74.

Thursday Morning Featured Symbol
*Please note: At the time of publication we do own the featured symbol, HON. Our featured symbol is part of your free subscription service. It is not included in any paid Tradespoon subscription service. Vlad Karpel only trades his own personal money in paid subscription services. If you are a paid subscriber, please review your Premium Member Picks, ActiveTrader or MonthlyTrader recommendations. If you are interested in receiving Vlad’s personal picks, please click here.
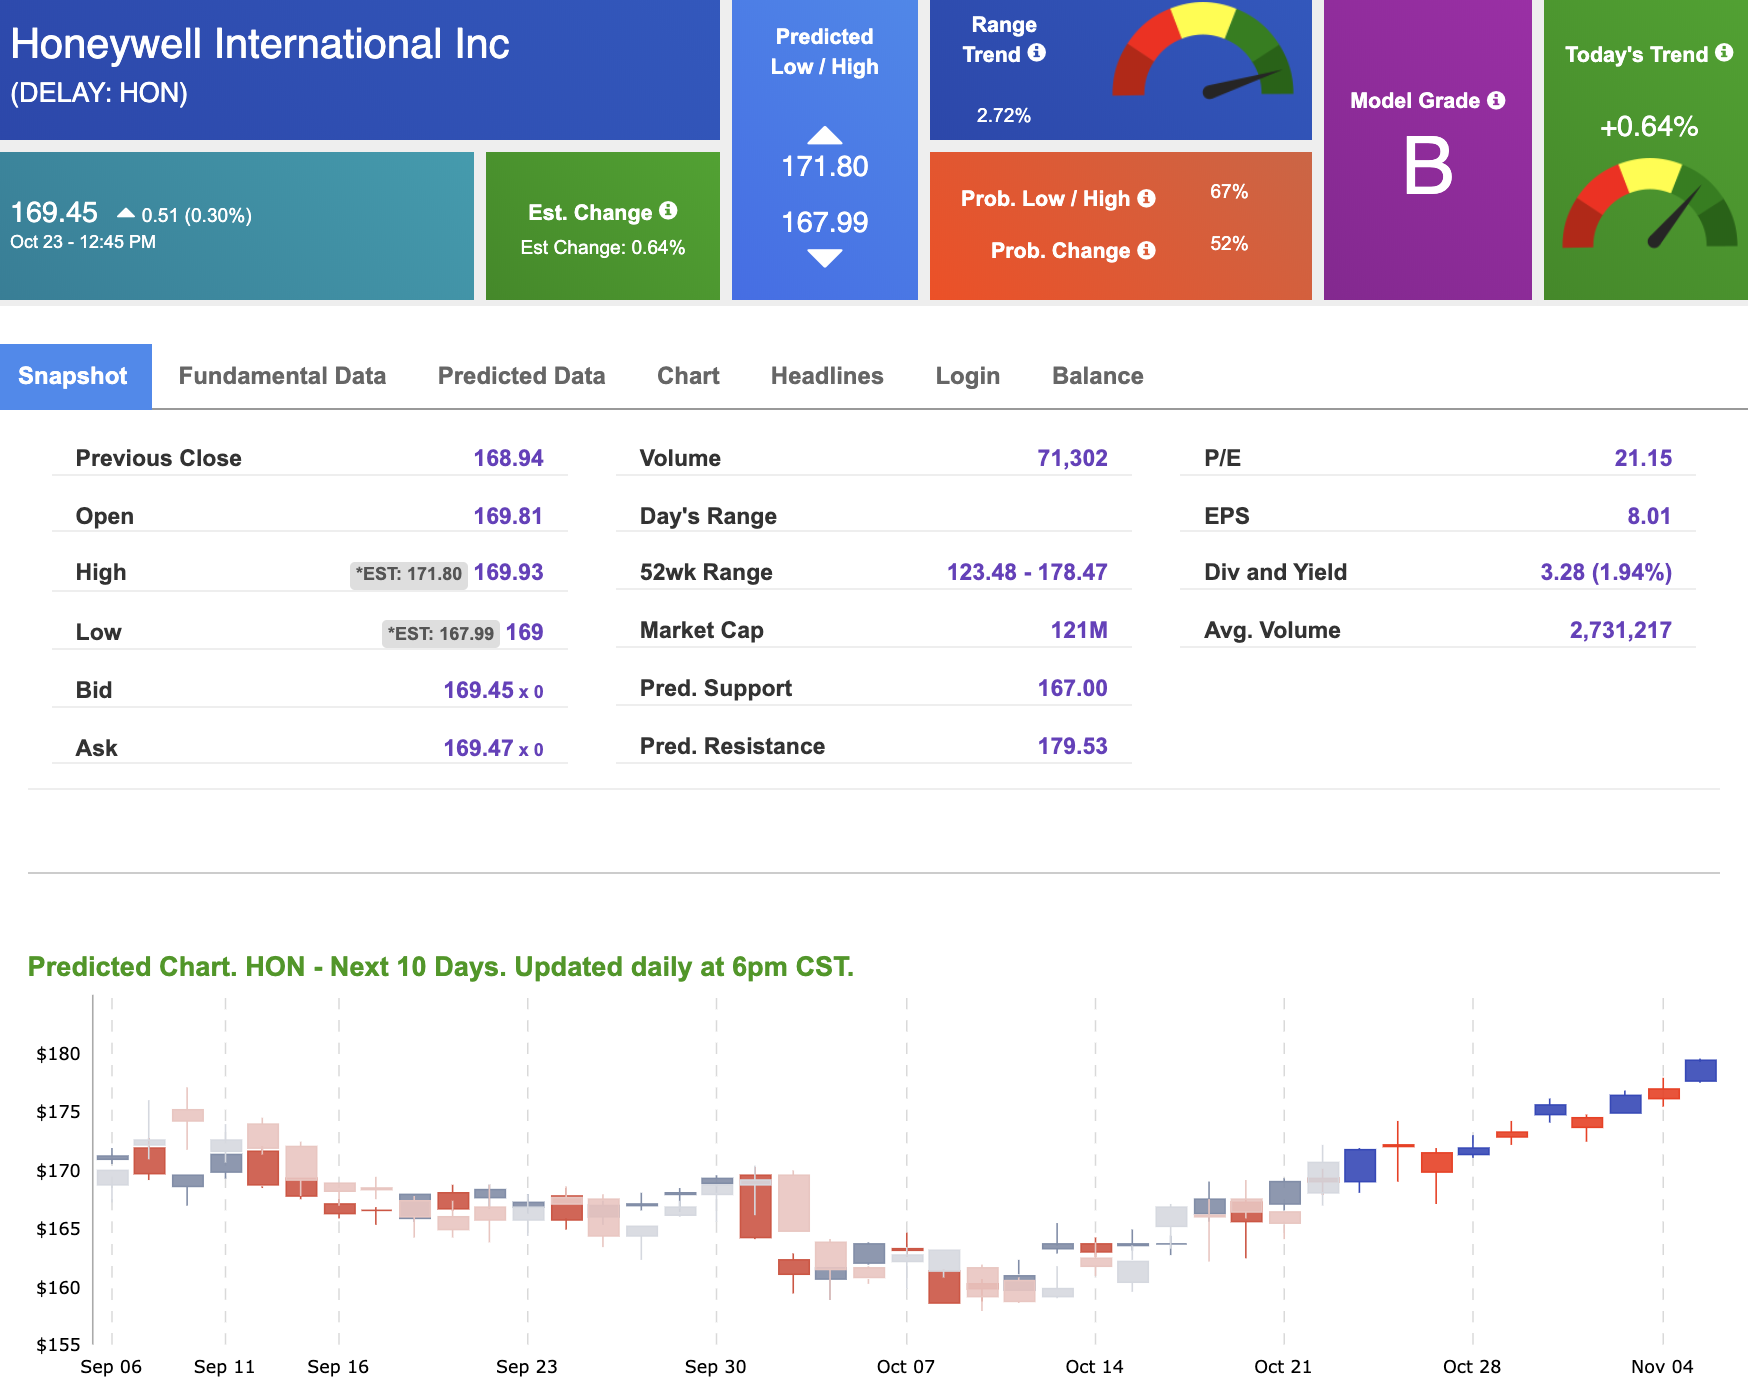
Our featured symbol for Thursday is Honeywell International Inc (HON). HON is showing a confident vector trend in our Stock Forecast Toolbox’s 10-day forecast. This stock is assigned a Model Grade of (B) indicating it ranks in the top 50th percentile for accuracy for predicted support and resistance, relative to our entire data universe.
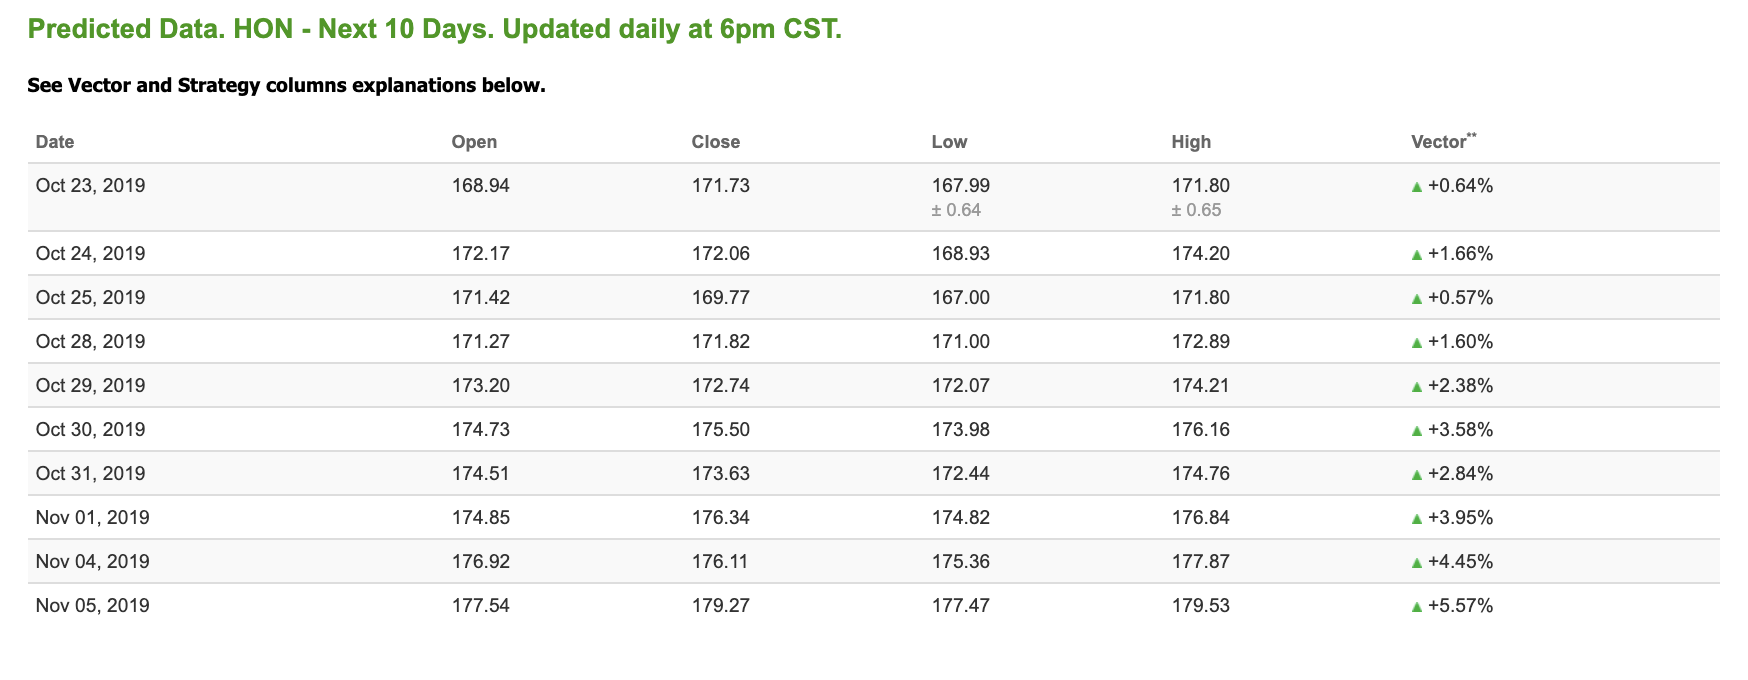
The stock is trading at $169.45 at the time of publication, up 0.30% from the open with a +0.64% vector figure.
Prediction data is uploaded after the market close at 6 p.m., CST. Today’s data is based on market signals from the previous trading session.
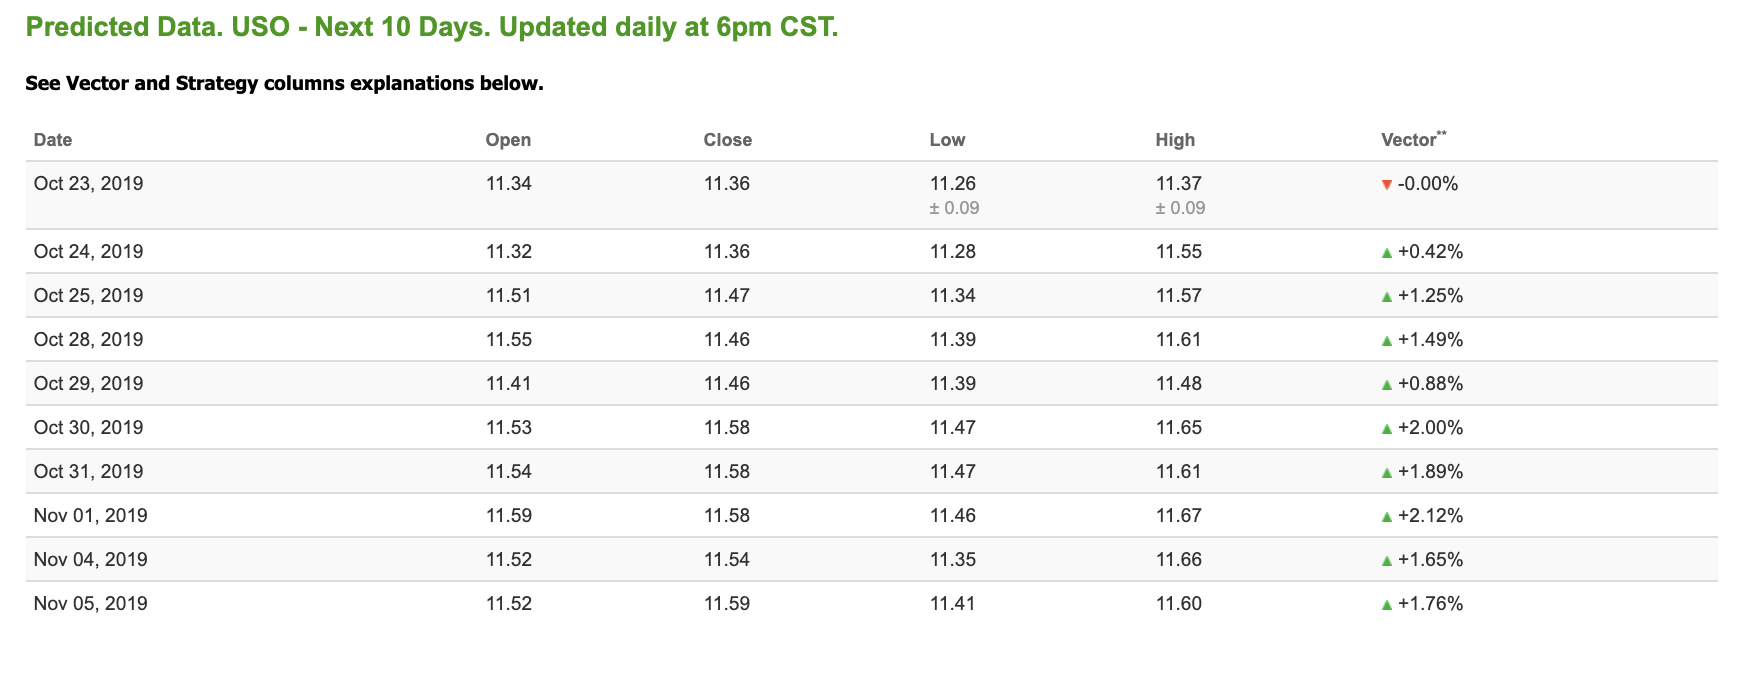
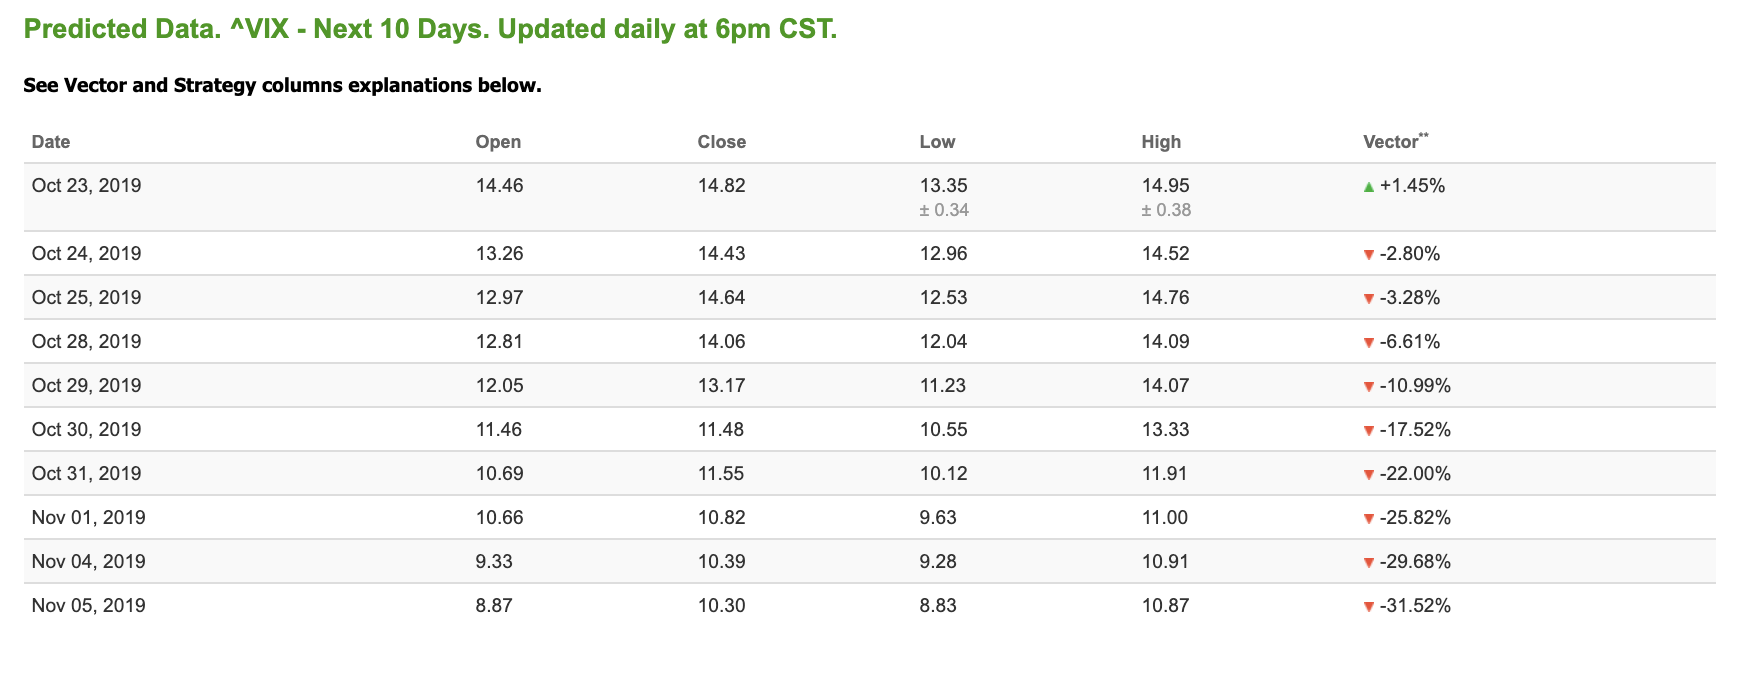
Note: The Vector column calculates the change of the Forecasted Average Price for the next trading session relative to the average of actual prices for the last trading session. The column shows the expected average price movement “Up or Down”, in percent. Trend traders should trade along the predicted direction of the Vector. The higher the value of the Vector the higher its momentum.
Oil
West Texas Intermediate for Crude Oil delivery (CL.1) is priced at $55.77 per barrel, up 2.94% from the open, at the time of publication.
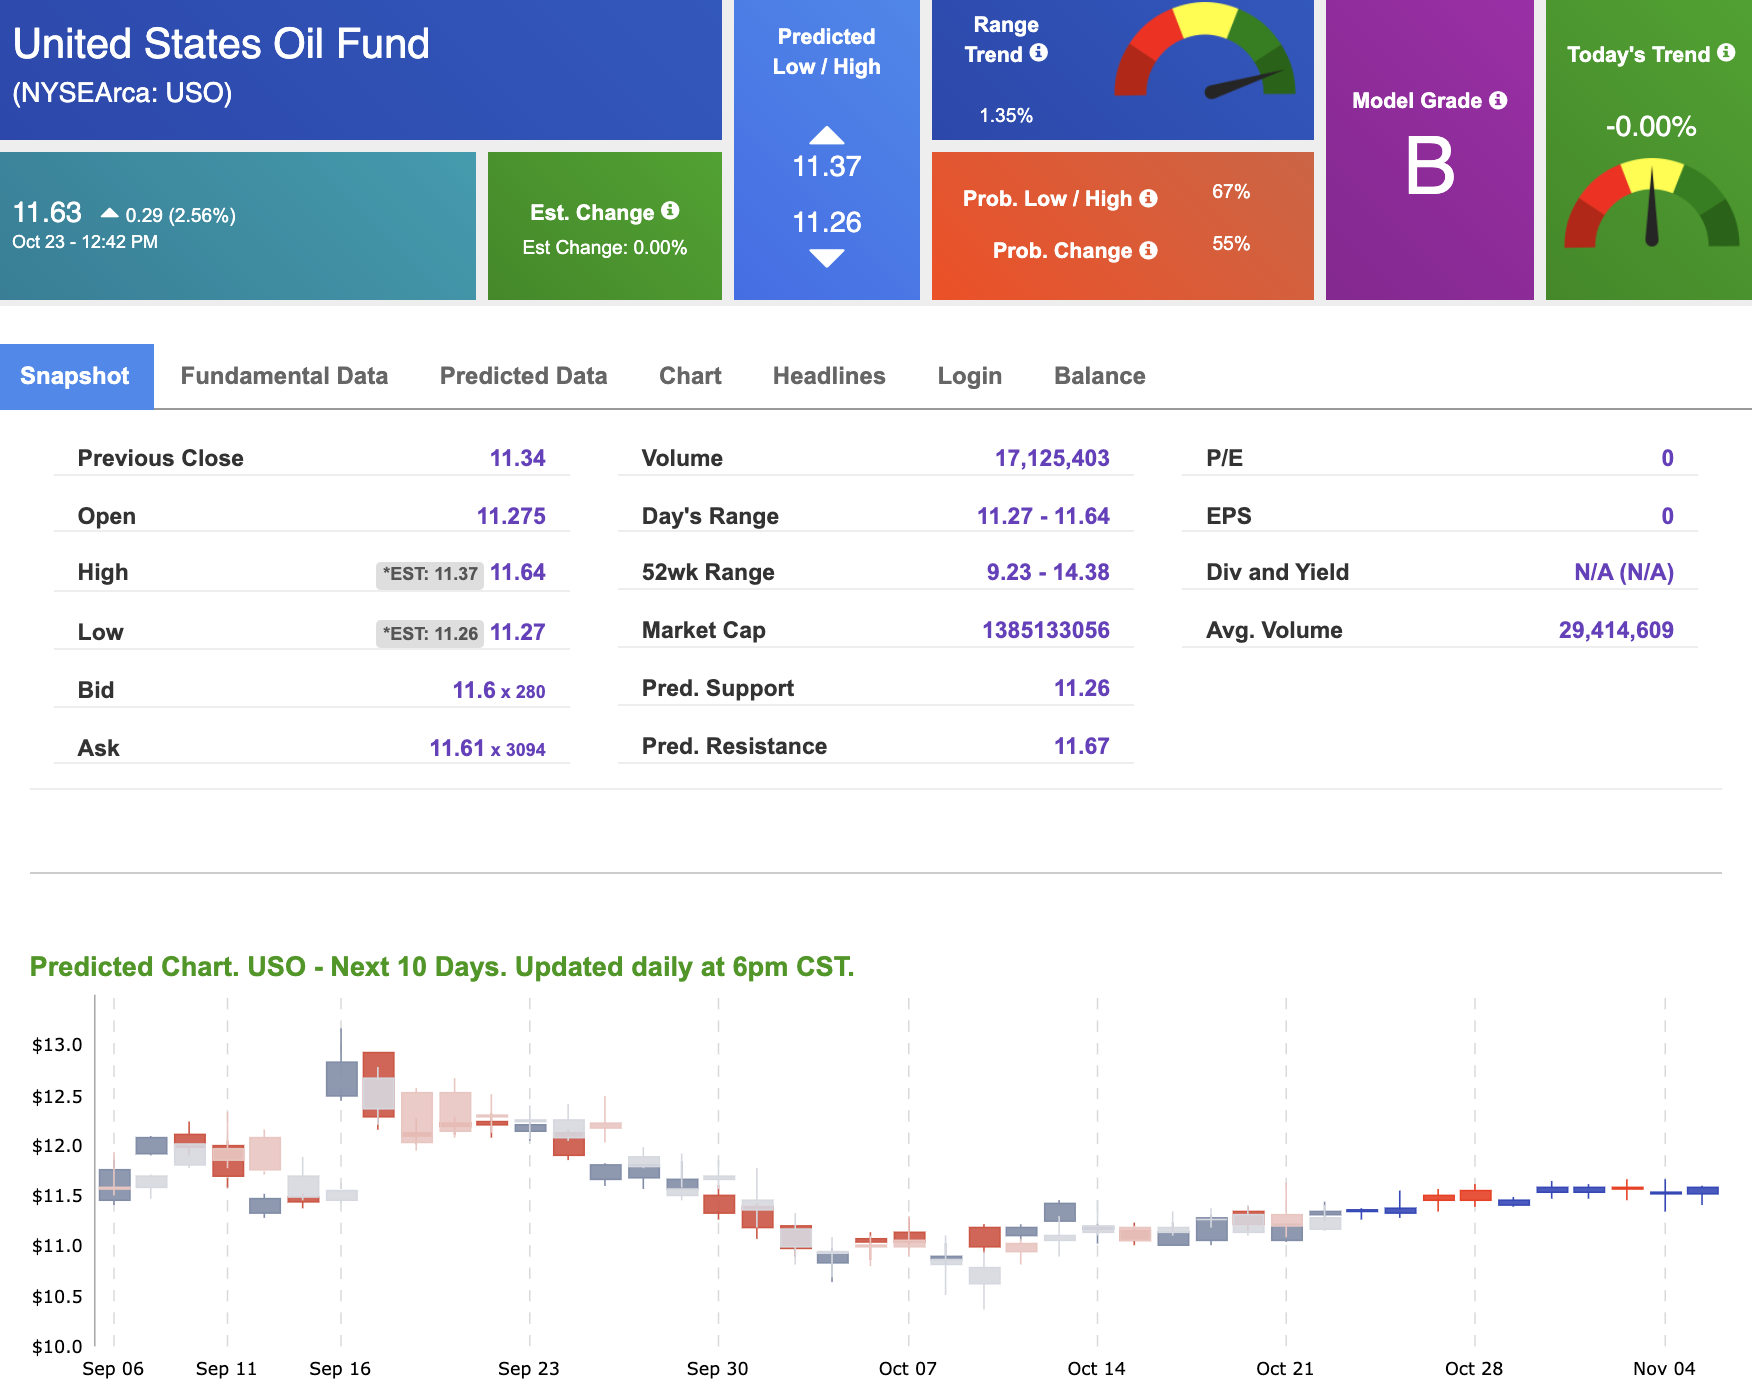
Looking at USO, a crude oil tracker, our 10-day prediction model shows mostly positive signals. The fund is trading at $11.63 at the time of publication, up 256% from the open. Vector figures show 0.00% today, which turns +2.00% in five trading sessions.Prediction data is uploaded after the market close at 6 p.m., CST. Today’s data is based on market signals from the previous trading session.
Gold
The price for the Gold Continuous Contract (GC00) is up 0.56% at $1,495.90 at the time of publication.
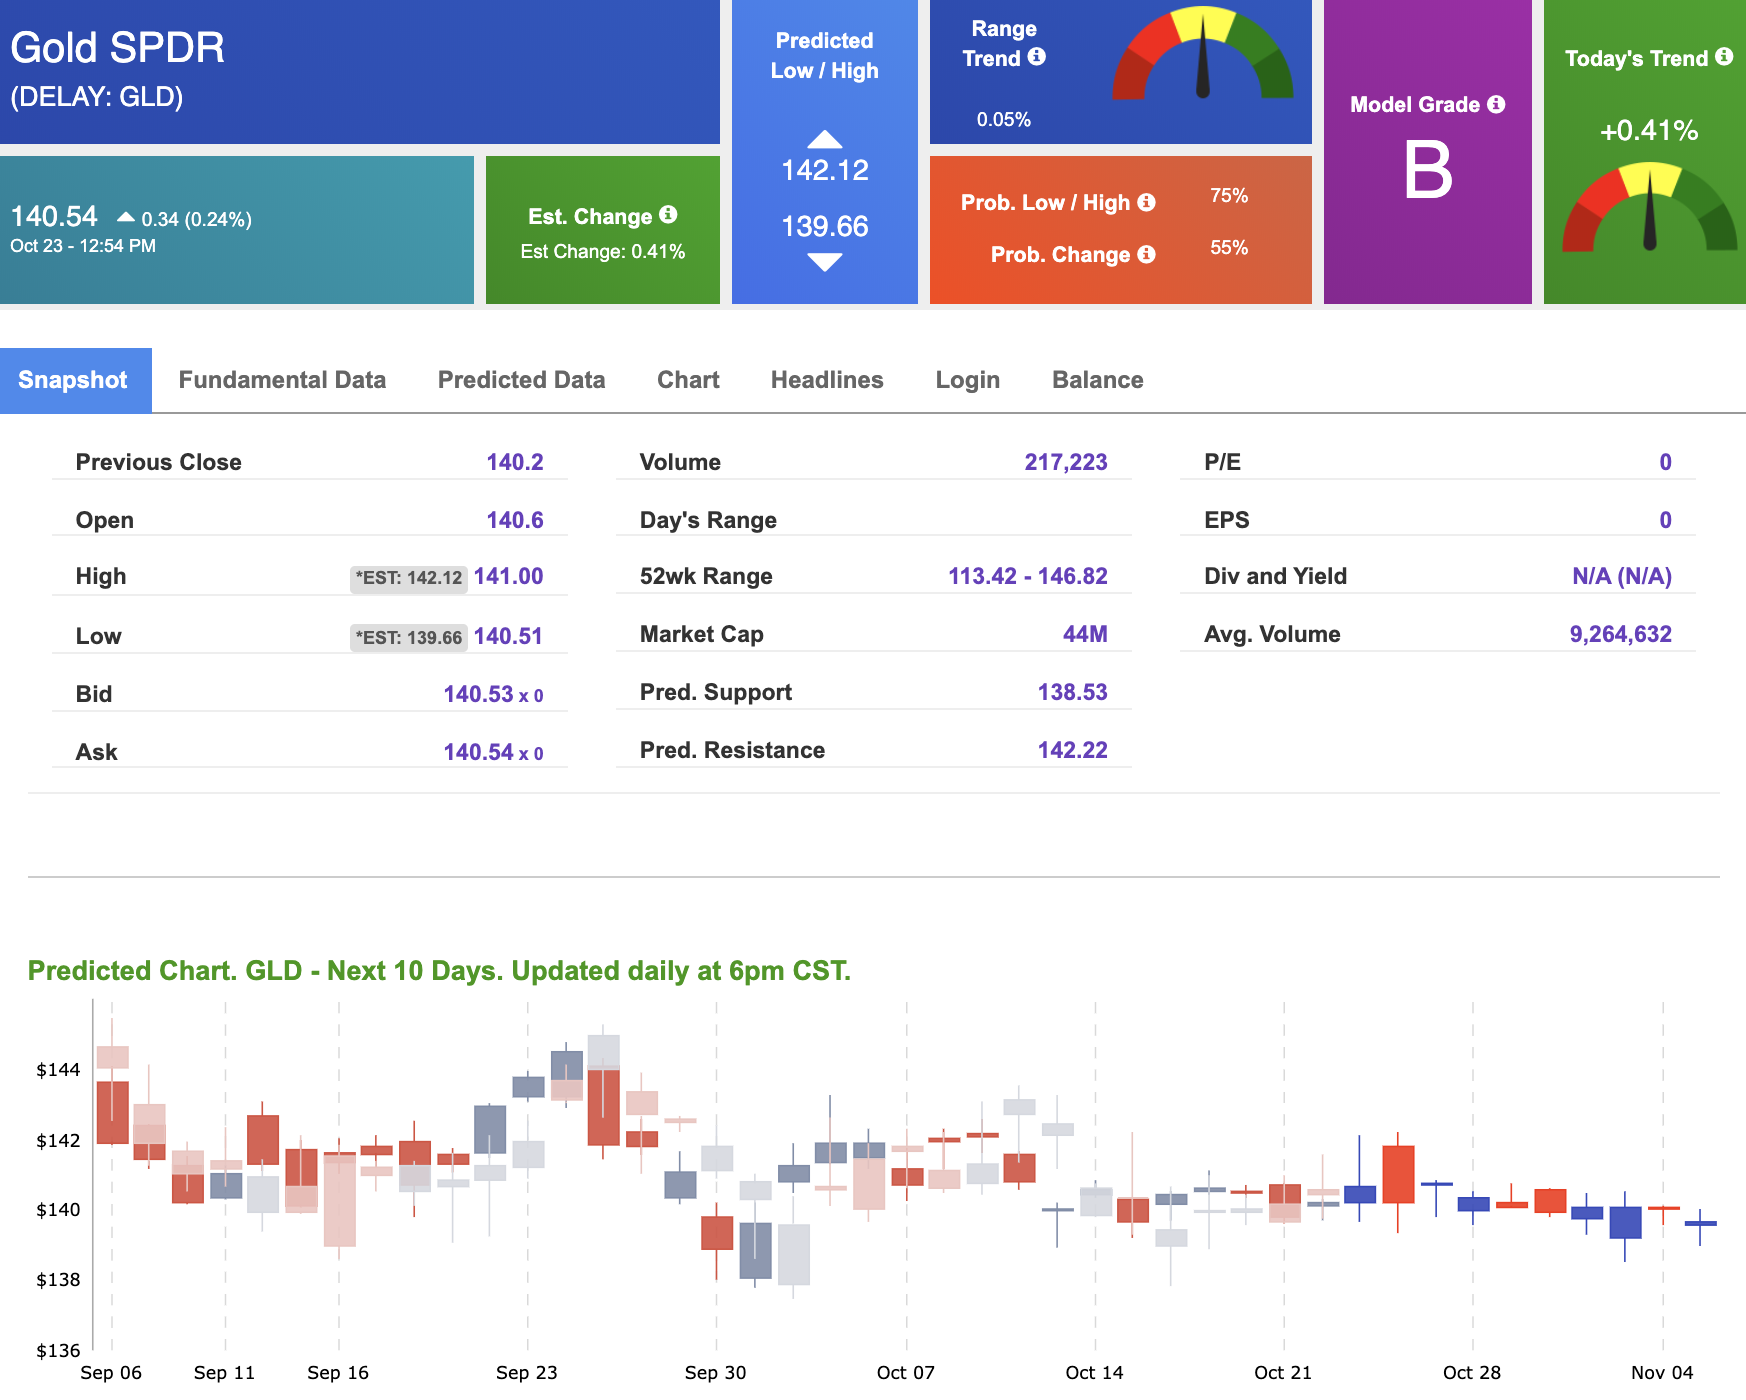
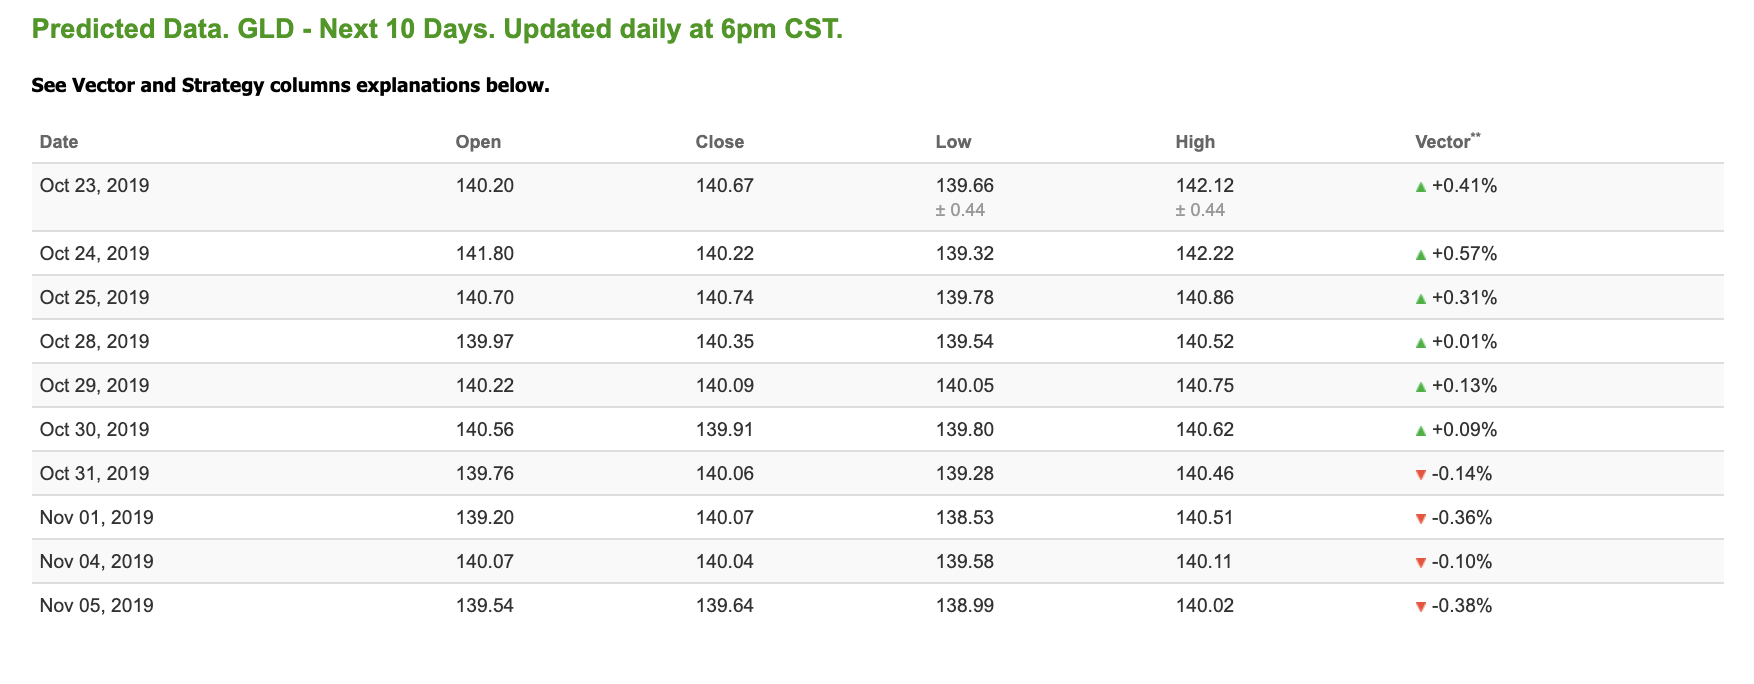
Using SPDR GOLD TRUST (GLD) as a tracker in our Stock Forecast Tool, the 10-day prediction window shows mixed signals. The gold proxy is trading at $140.54, up 0.24% at the time of publication. Vector signals show +0.41% for today. Prediction data is uploaded after the market close at 6 p.m., CST. Today’s data is based on market signals from the previous trading session.
Treasuries
The yield on the 10-year Treasury note is down 0.45% at 1.76% at the time of publication. The yield on the 30-year Treasury note is down 0.16% at 2.25% at the time of publication.
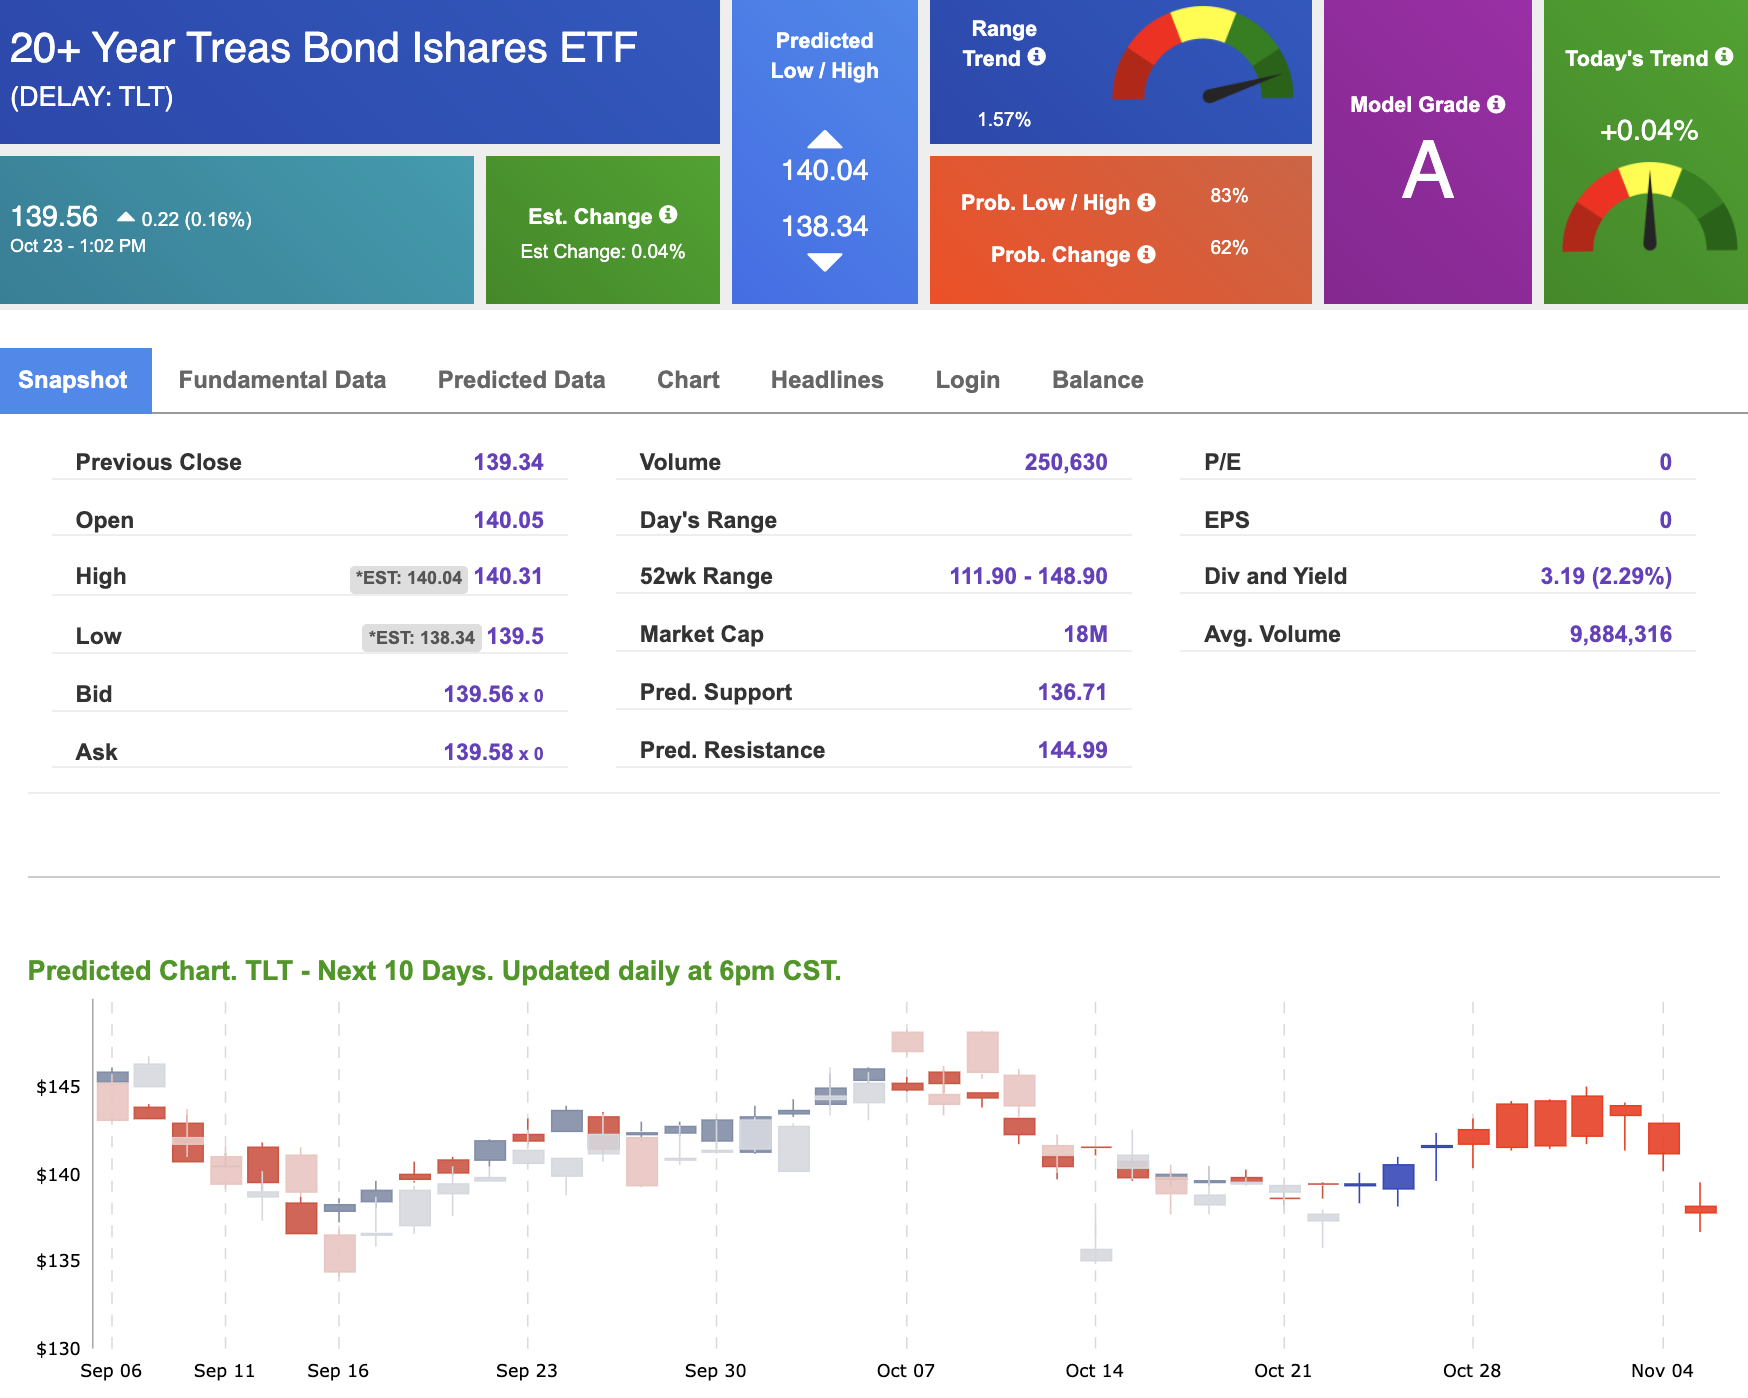
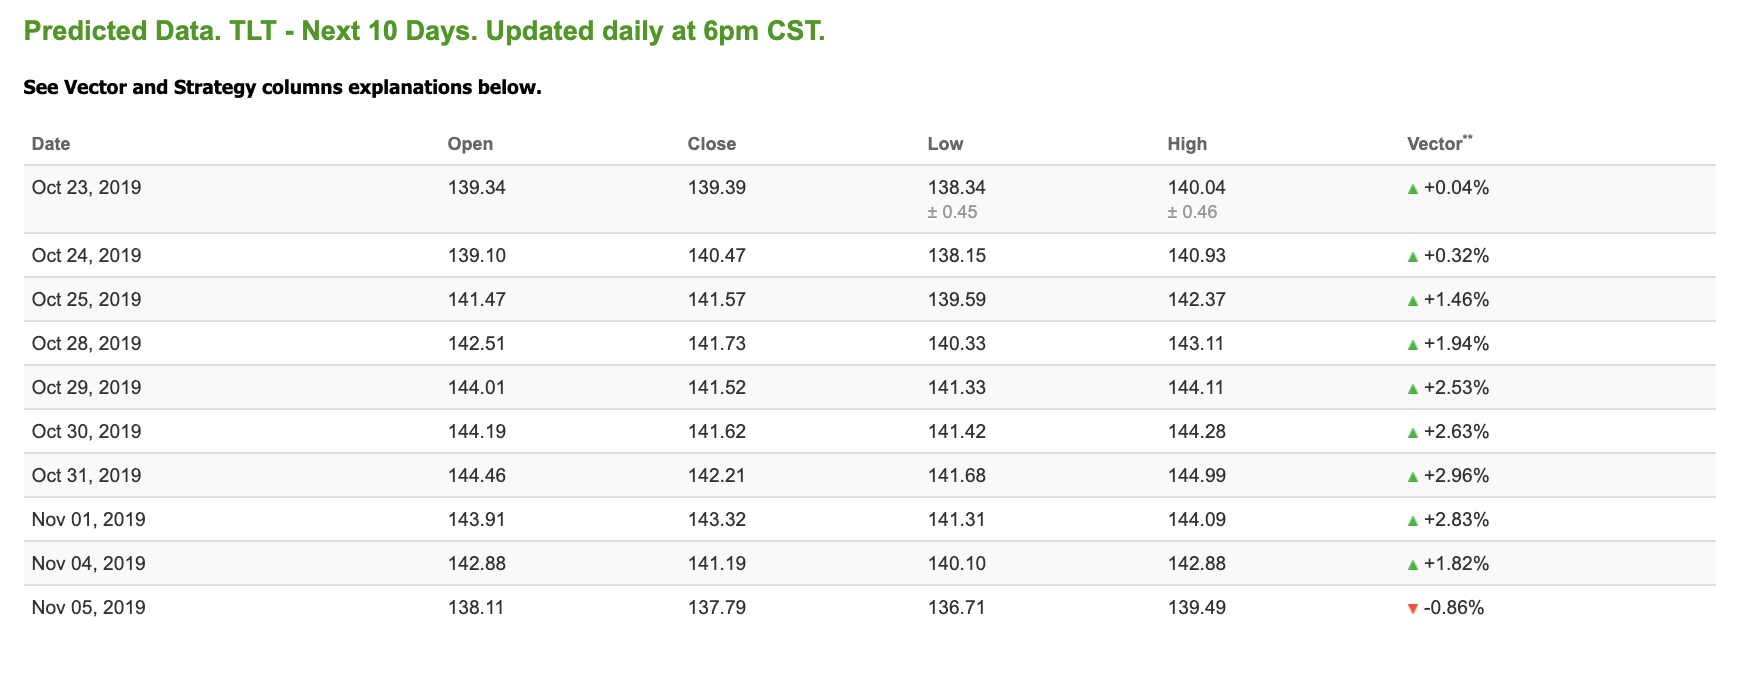
Using the iShares 20+ Year Treasury Bond ETF (TLT) as a proxy for bond prices in our Stock Forecast Tool, we see negative signals in our 10-day prediction window. Today’s vector of -0.20% moves to -1.15% in three sessions. Prediction data is uploaded after the market close at 6 p.m., CST. Today’s data is based on market signals from the previous trading session.
Volatility
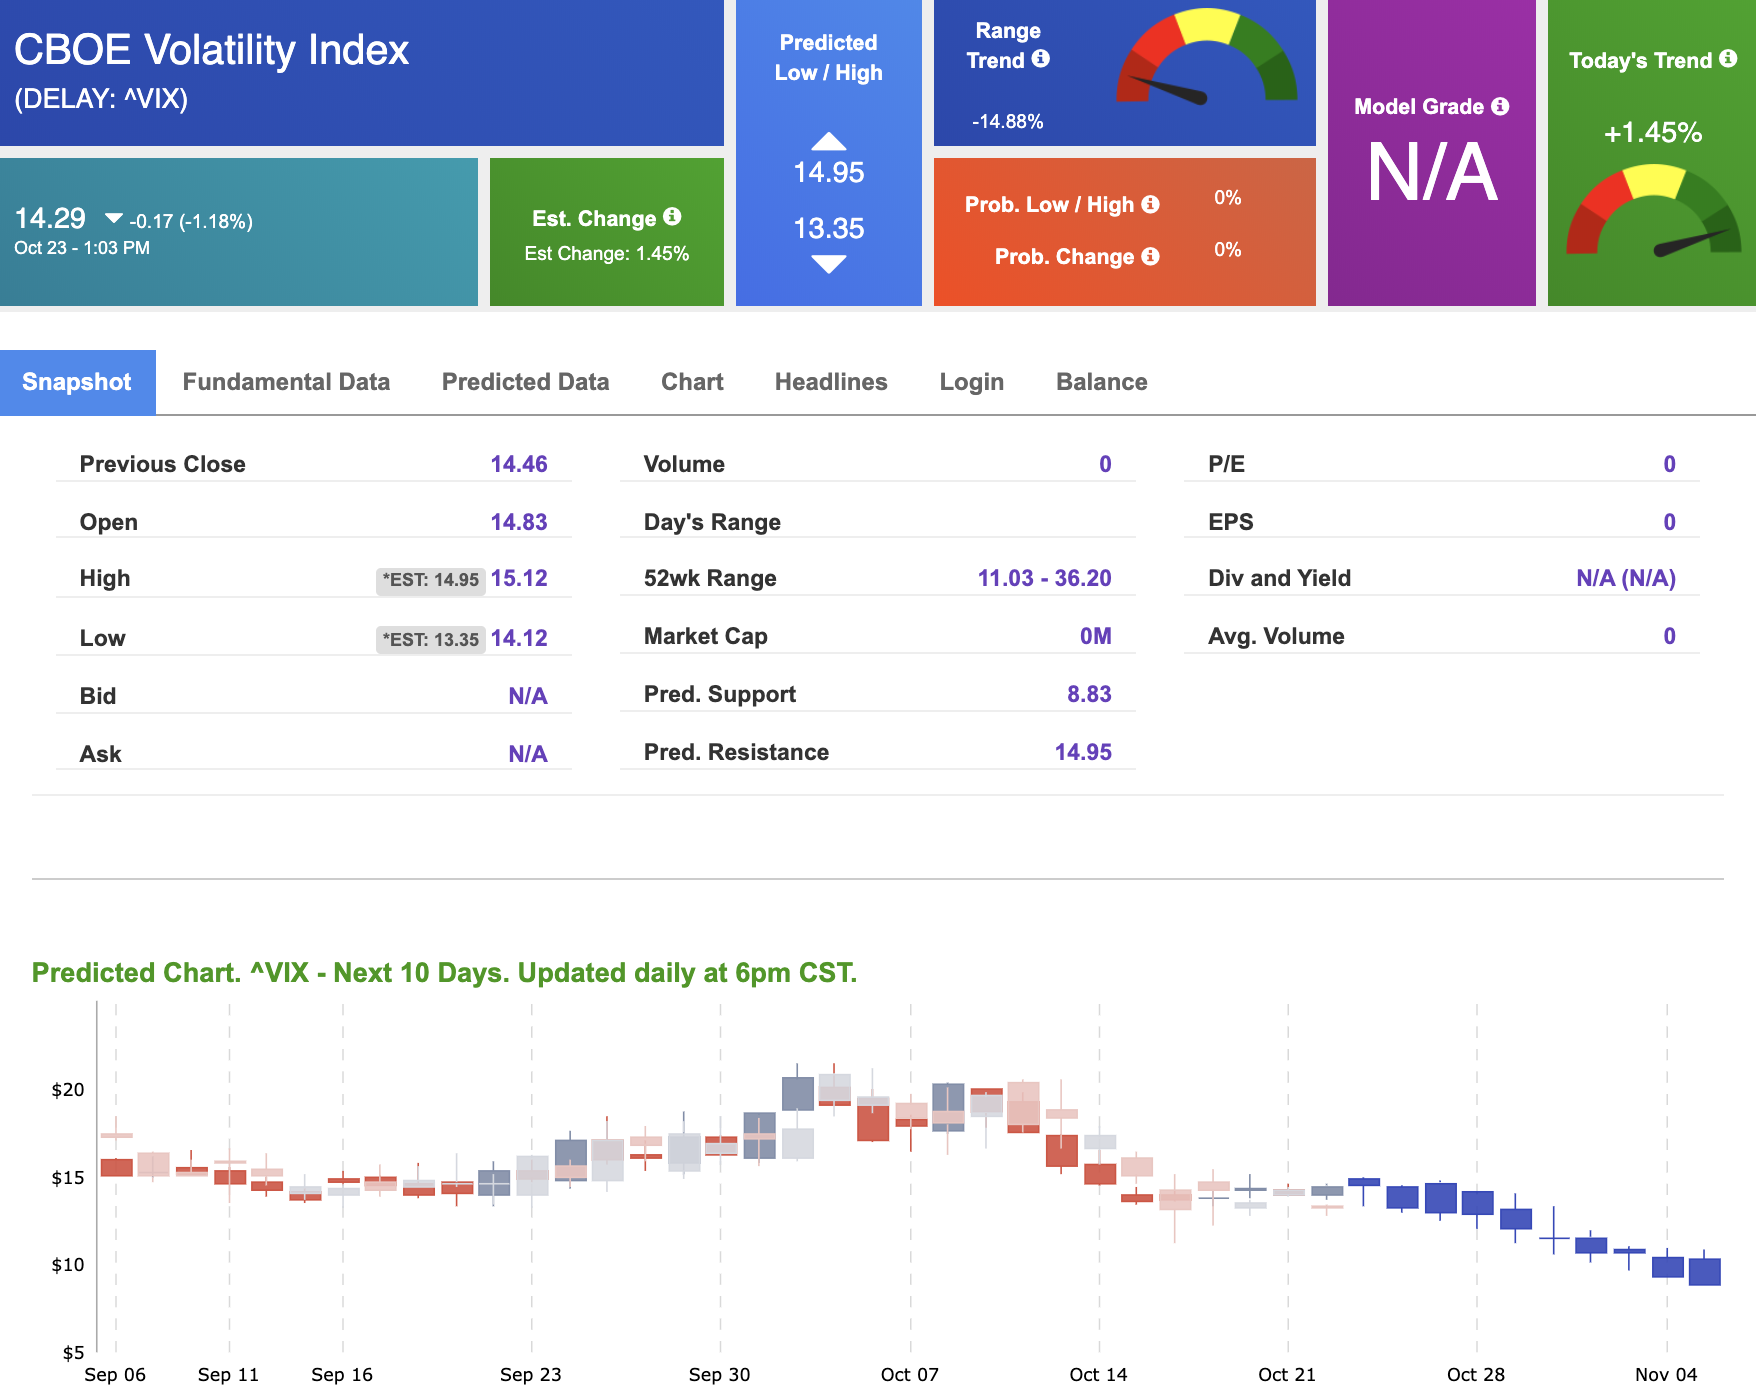
The CBOE Volatility Index (^VIX) is down 1.18% at $14.29 at the time of publication, and our 10-day prediction window shows negative signals. The predicted close for tomorrow is $14.43 with a vector of -2.80%. Prediction data is uploaded after market close at 6 p.m., CST. Today’s data is based on market signals from the previous trading session.
(Want free training resources? Check our our training section for videos and tips!)
SPECIAL OFFER: Lifetime Access to the Stock Forecast Toolbox!
Here’s a brief outline of what you get when you put Stock Forecast Toolbox to work:
The Stock Forecast Tool predicts how a stock’s price trend is moving in the short and long-term future. In other words, it references a historical set of data, finds a mathematical pattern, and predicts the stock’s price trend over a time period of 1 hour to 10 business days.
-
The Stock Forecast Toolbox is like a Crystal Ball!
-
It takes market data and runs it through complex algorithms and quantitative analytics that work behind the scene breaking it down into extremely useful information.
-
You don’t need to be a math nerd to understand that the Stock Forecast Toolbox gives you everything you need to determine which way a company’s stock price is trending during any given time period.