U.S. Markets See Record Close, Big-Tech Earnings and FOMC This Week
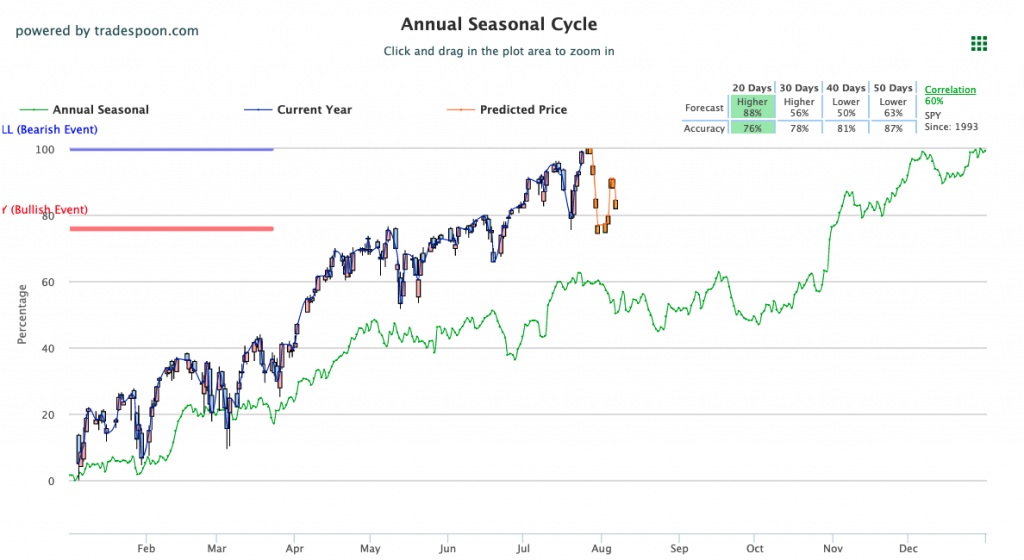
Earnings ramp up with reports from Apple, Facebook, Microsoft, Google, Tesla, and Amazon this week. The new strand of the COVID virus continues to impact worldwide markets, the VIX currently trades at the18 level. Vaccine and infection rates will continue to impact markets in the coming weeks as well as the start of the latest earnings season. Likewise, the Federal Open Market Committee will meet again to discuss and decide on the current interest rates this week which could also impact markets. Please watch the critical support levels on the SPY at $434 and $418. We do expect a short-term correction to continue through July and the beginning of August. Globally, both European and Asian markets are trading to mixed results to start the week. We encourage all market commentary readers to maintain clearly defined stop levels for all positions. For reference, the SPY Seasonal Chart is shown below:
Major U.S. indices closed in the green as back-to-back record closes were booked for the Dow Jones and S&P, with the former finishing about 35,000. This completes a nice recovery from the mid-month slump most sectors were seeing. With earnings season in full swing, the latest batch of reports will likely impact markets this week as several major corporate reports are set to release this week. On Tuesday, the two-day Federal Open Market Committee meeting will begin with Fed Chair Jerome Powell meeting with the press on Wednesday. Also due later this week will be the latest GDP and employment data for Q2 as well as June Personal Income and Consumer Spending.
Key U.S. Economic Reports/Events This Week:
- Durable Goods Orders (June) – Tuesday
- Consumer Confidence Index (July) – Tuesday
- FOMC Announcement/Press Confrence – Wednesday
- Weekly Jobless Claims (7/24) – Thursday
- GDP (Q2) – Thursday
- Pending Home Sales Index (June) – Thursday
- Employment Cost Index (Q2) – Friday
- Personal Income (June) – Friday
- Consumer Spending (June) – Friday
- Core Inflation (June) – Friday
Upcoming Earnings:
- TSLA – Tesla – Monday
- AAPL – Apple – Tuesday
- MSFT – Microsoft – Tuesday
- GOOG – Alpahbet Inc – Tuesday
- V – Visa – Tuesday
- UPS – United Parcel Services – Tuesday
- SBUX – Starbucks – Tuesday
- RTX – Raytheon Tech – Tuesday
- MMM – 3M Company – Tuesday
- GE – General Electric – Tuesday
- WM – Waste Mangement – Tuesday
- FB – Facebook – Wednesday
- PYPL – PayPal – Wednesday
- PFE – Pfizer – Wednesday
- SHOP – Shopify – Wednesday
- MCD – McDonald’s – Wednesday
- QCOM – Qualcomm – Wednesday
- BA – The Boeing Company – Wednesday
- F – Ford Motor – Wednesday
- ANZN – Amazon.com – Thursday
- MA – MasterCard – Thursday
- CMCSA – Comcast – Thursday
- TMUS – T Mobil – Thursday
- PG – Procter & Gamble – Friday
- XOM – Exxon Mobil – Friday
- ABBV – Abbvie Inc. – Friday
- CVX – Chevron – Friday
- CHTR – Charter Communications – Friday
- CAT – Caterpillar Inc. – Friday
‘If you’re looking for free trading resources… click here’
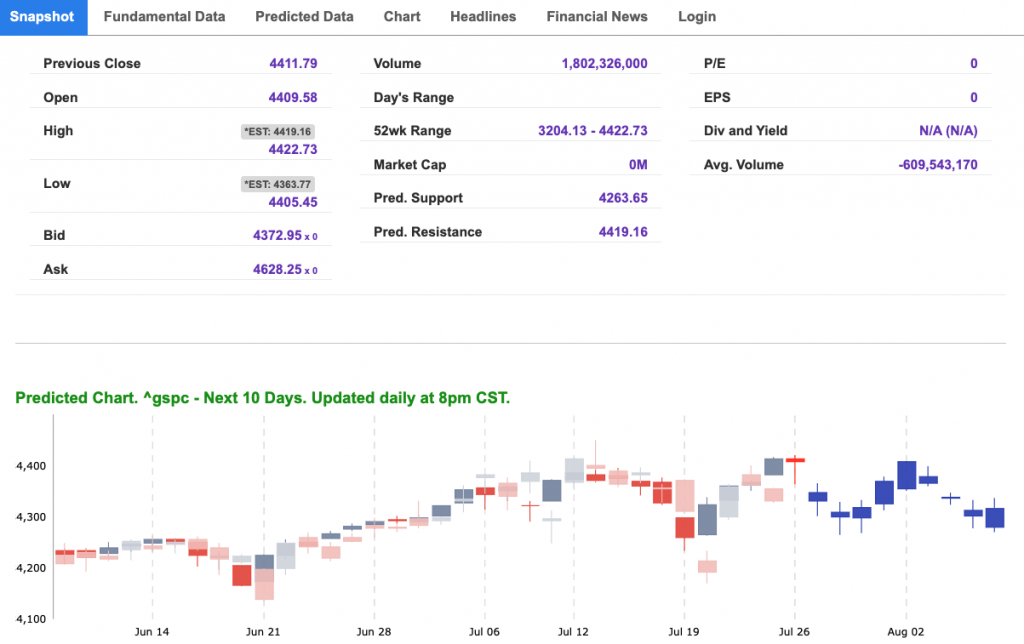
For reference, the S&P 10-Day Forecast is shown below:
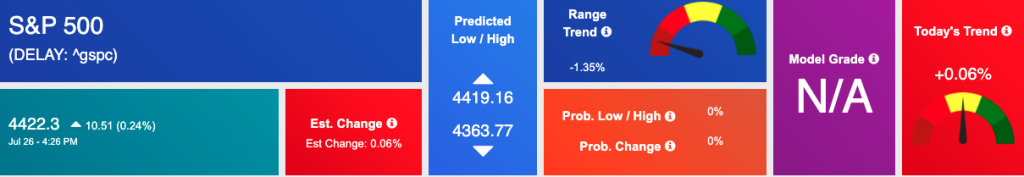
Using the “^GSPC” symbol to analyze the S&P 500 our 10-day prediction window shows a near-term mixed outlook. Prediction data uploaded after the market closes at 6 p.m. CST. Today’s data is based on market signals from the previous trading session.
Vlad’s Portfolio Lifetime Membership!
DO AS I DO… AS I DO IT WATCH LIVE AS I WORK THE MARKETS! TRY IT NOW RISK-FREE!
Click Here to Sign Up
Tuesday Morning Featured Symbol
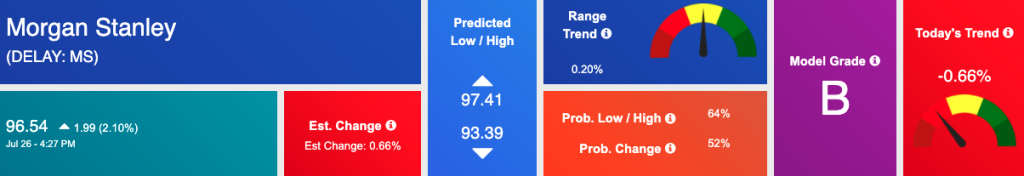
Our featured symbol for Tuesday is Morgan Stanley (MS). MS is showing a steady vector in our Stock Forecast Toolbox’s 10-day forecast.
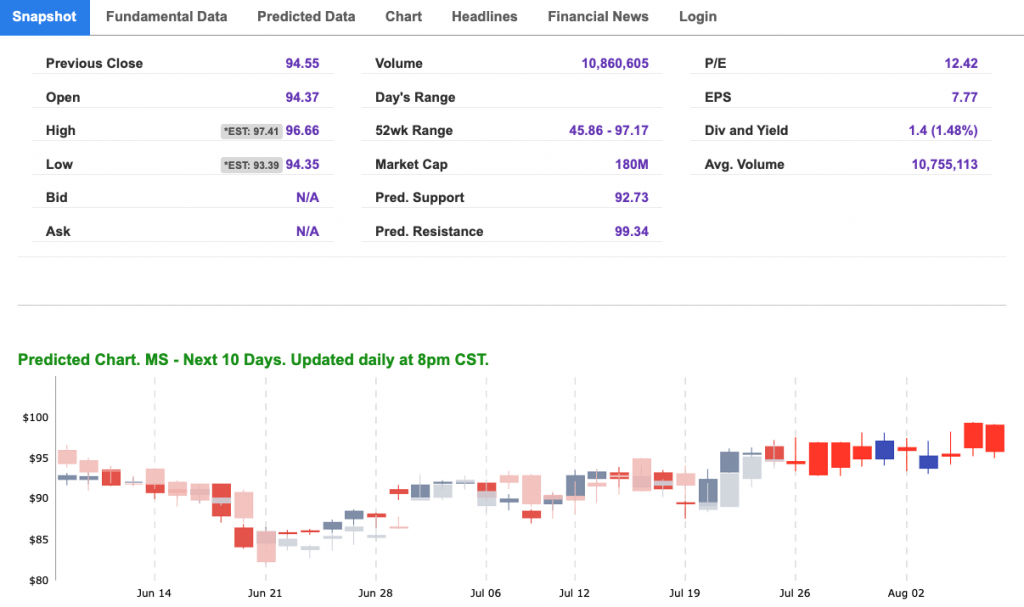
The stock is trading at $96.54 with a vector of -0.66% at the time of publication.
10-Day Prediction data uploaded after the market close at 6 p.m., CST. Today’s data is based on market signals from the previous trading session.
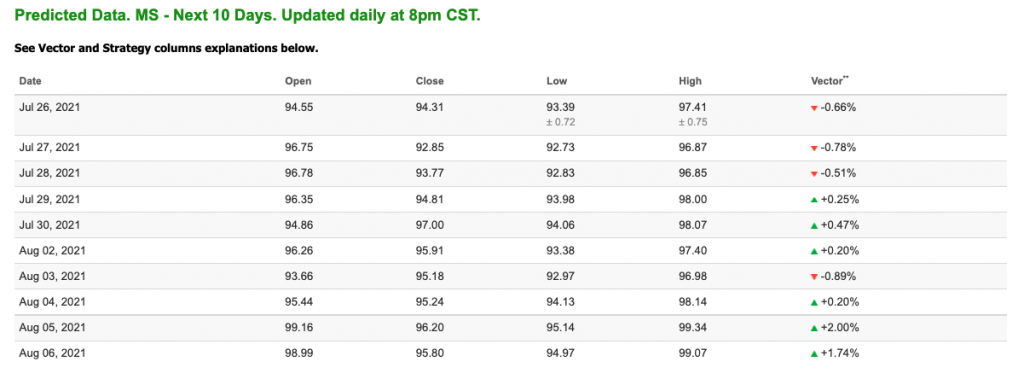
Note: The Vector column calculates the change of the Forecasted Average Price for the next trading session relative to the average of actual prices for the last trading session. The column shows the expected average price movement “Up or Down”, in percent. Trend traders should trade along the predicted direction of the Vector. The higher the value of the Vector the higher its momentum.
*Please note: At the time of publication Vlad Karpel does NOT have a position in the featured symbol, MS. Our featured symbol is part of your free subscription service. Not included in any paid Tradespoon subscription service. Vlad Karpel only trades his money in paid subscription services. If you are a paid subscriber, please review your Premium Member Picks, ActiveTrader, or MonthlyTrader recommendations. If you are interested in receiving Vlad’s picks, please click here.
Oil
West Texas Intermediate for Crude Oil delivery (CL.1) is priced at $70.22 per barrel, up 4.49% at the time of publication.
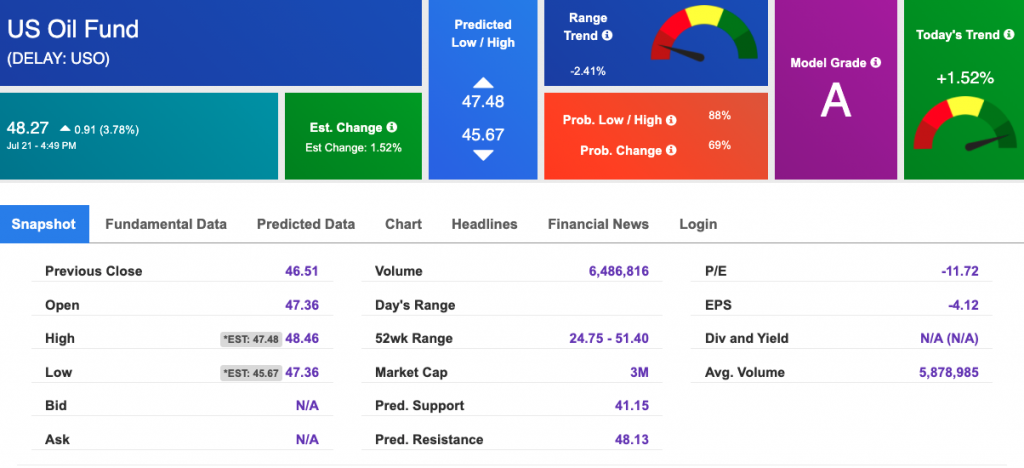
Looking at USO, a crude oil tracker, our 10-day prediction model shows mixed signals. The fund is trading at $48.27 at the time of publication. Prediction data uploaded after the market close at 6 p.m., CST. Today’s data is based on market signals from the previous trading session.
Gold
The price for the Gold Continuous Contract (GC00) is down 0.42% at $1803.80 at the time of publication.
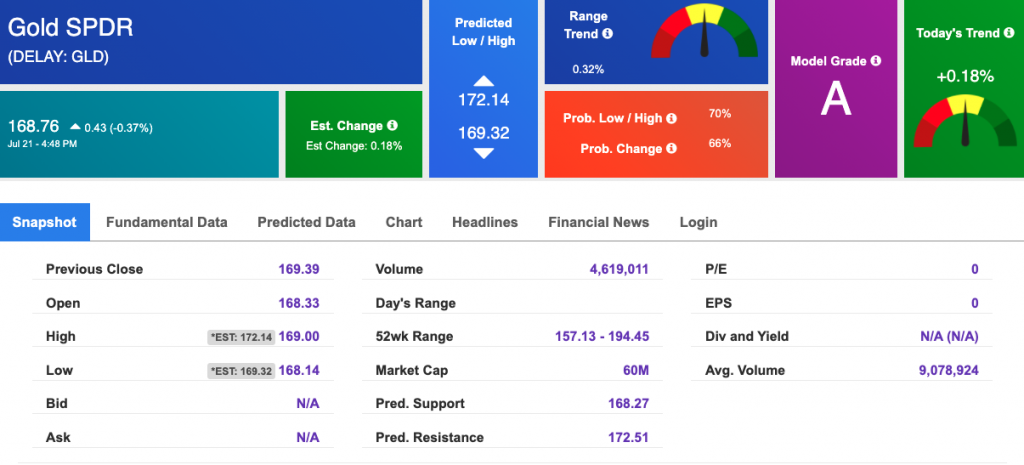
Using SPDR GOLD TRUST (GLD) as a tracker in our Stock Forecast Tool, the 10-day prediction window shows mixed signals. The gold proxy is trading at $168.76 at the time of publication. Vector signals show +0.18% for today. Prediction data uploaded after the market close at 6 p.m., CST. Today’s data is based on market signals from the previous trading session.
Treasuries
The yield on the 10-year Treasury note is down, at 1.344% at the time of publication.
The yield on the 30-year Treasury note is down, at 1.977% at the time of publication.
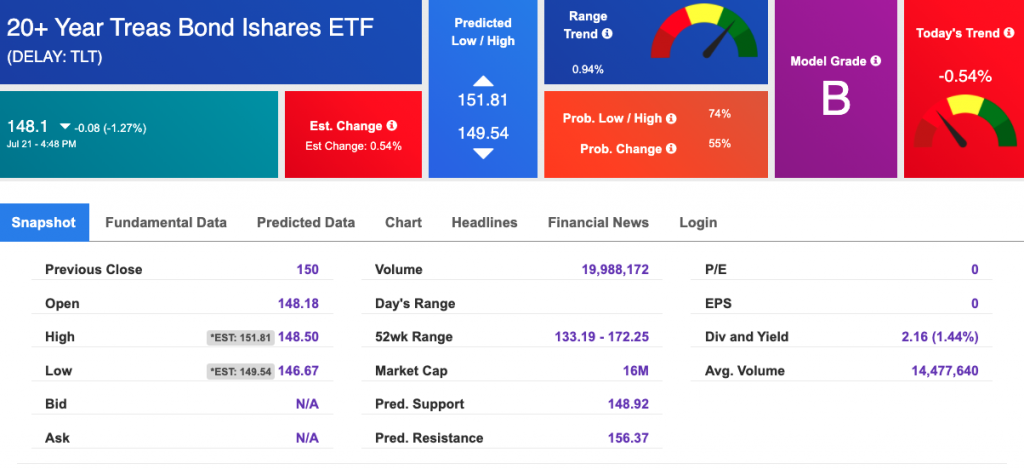
Using the iShares 20+ Year Treasury Bond ETF (TLT) as a proxy for bond prices in our Stock Forecast Tool, we see mixed signals in our 10-day prediction window. Prediction data uploaded after the market close at 6 p.m., CST. Today’s data is based on market signals from the previous trading session.
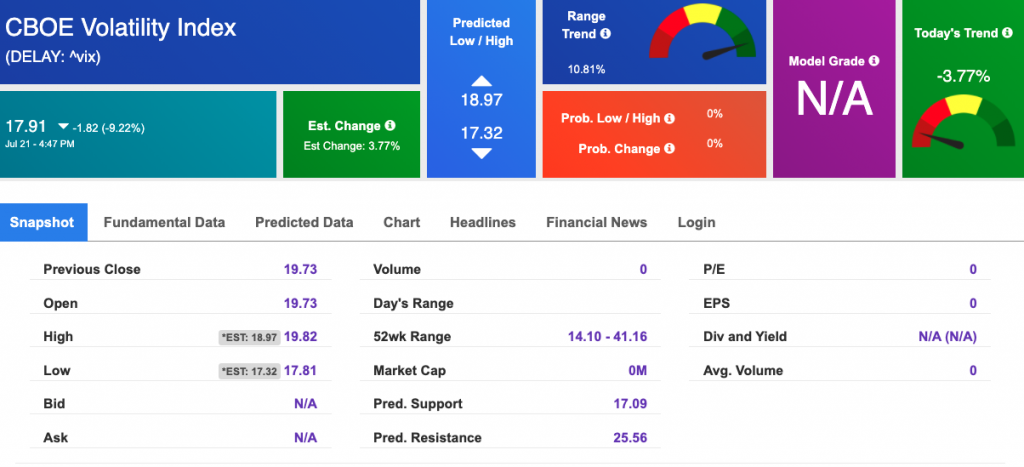
Volatility
The CBOE Volatility Index (^VIX) is $17.91 at the time of publication, and our 10-day prediction window shows mixed signals. Prediction data uploaded after the market close at 6 p.m., CST. Today’s data is based on market signals from the previous trading session.