Markets Mixed Ahead of Key Labor Data
U.S. benchmarks traded impressively higher to start the week but turned lower on Wednesday following comments of a potential interest rate rise from Fed Reserve Vice Chair Richard Clarida. The Nasdaq closed in the green while the S&P and Dow Jones saw modest losses. ADP Private Sector report showed fewer than expected jobs added in the last month while additional labor data is due Friday. As the week progressed, Chinese regulatory action continues to cause concern to start while impressive corporate earnings have supported U.S. markets. Several U.S. cities re-issued mask mandates which are in response to the spiking COVID levels seen over the last month due to the delta variant.
Earnings season and the July Unemployment numbers are the main events that could drive the market this week. ROKU, BABA, and NXPI are key earnings announcements this week that can potentially influence the market direction. Although U.S. stocks traded impressively higher today, the new strand of the COVID virus has sparked continued volatility in the market as the VIX currently trades at the 18 level.
Critical support levels on the SPY at $434 and $422
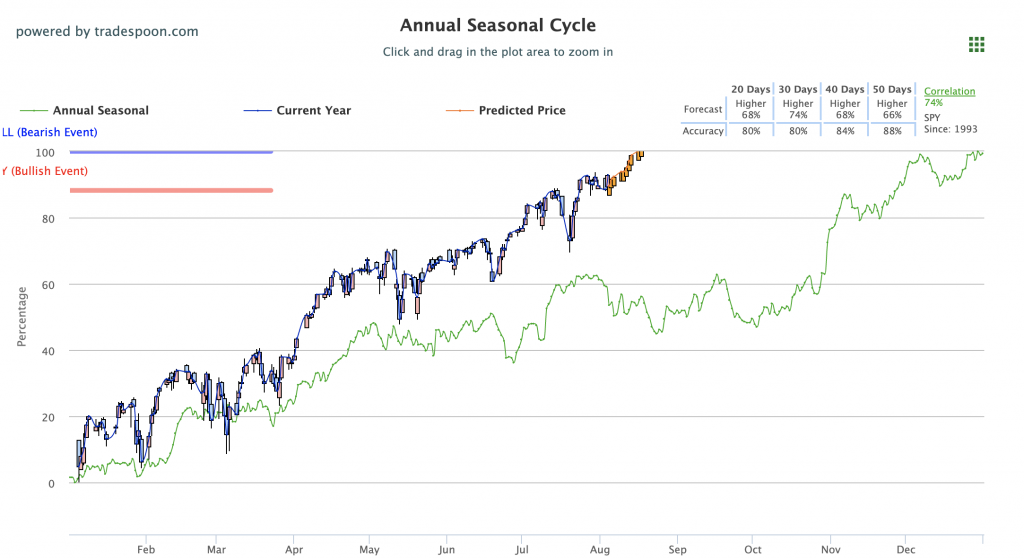
Please watch the critical support levels on the SPY at $434 and $422. We do expect a short-term correction to continue in the coming weeks. Globally, European markets closed in the green while Asian markets were mixed. We encourage all market commentary readers to maintain clearly defined stop levels for all positions. For reference, the SPY Seasonal Chart is shown below:
Corporate earnings continue this week with CVS, BKNG, GM, UBER, and ROKU on Wednesday. Earnings continue on Thursday with Toyota and Moderna, while Friday is set to feature CGC, CRON, D, and GT earnings. Activision Blizzard earnings supported the videogame maker while Lyft and Victoria’s Secret shares dipped following underwhelming reports. Earnings will wind down next week, though several big names such as Disney, Airbnb, and eBay are still set to report.
Key U.S. Economic Reports/Events This Week:
- ADP Employment Report (July) – Wednesday
- ISM Services Index (July) – Wednesday
- Weekly Jobless Claims (7/31) – Thursday
- Trade Balance (June) – Thursday
- Nonfarm Payrolls (July) – Friday
- Unemployment Rate (July) – Friday
- Average Hourly Earnings (July) – Friday
- Wholesale Inventories (June) – Friday
- Consumer Credit (June) – Friday
Upcoming Earnings:
- CVS – CVS Health – Wednesday
- BKNG – Booking Holding- Wednesday
- GM – General Motors – Wednesday
- UBER – Uber Tech – Wednesday
- ROKU – Roku Inc. – Wednesday
- HMC – Honda Motor Company – Wednesday
- MET – Metlife – Wednesday
- KHC – Kraft Heinz – Wednesday
- EA – Electronic Arts – Wednesday
- ALL – Allstate Company – Wednesday
- TM – Toyota Motor – Thursday
- MRNA – Moderna – Thursday
- DUK – Duke Energy – Thursday
- MNST – Monstor Beverages – Thursday
- D – Dominion Energy – Friday
- DKNG – DraftKings Inc – Friday
‘If you’re looking for free trading resources… click here’
For reference, the S&P 10-Day Forecast is shown below:
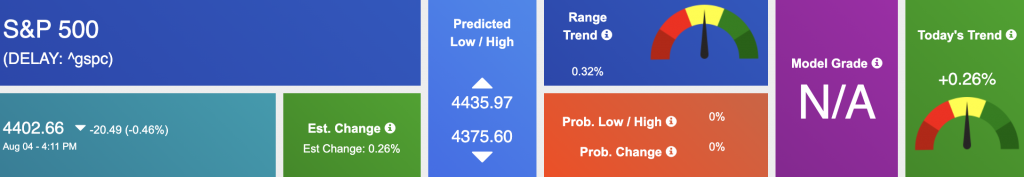
Using the “^GSPC” symbol to analyze the S&P 500 our 10-day prediction window shows a near-term mixed outlook. Prediction data is uploaded after the market closes at 6 p.m. CST. Today’s data is based on market signals from the previous trading session.

Vlad’s Portfolio Lifetime Membership!
DO AS I DO… AS I DO IT WATCH LIVE AS I WORK THE MARKETS! TRY IT NOW RISK-FREE!
Click Here to Sign Up
Thursday Morning Featured Symbol
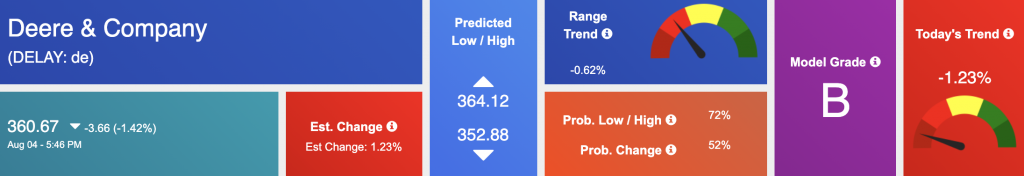
Our featured symbol for Thursday is Deere & Company (DE). DE is showing a steady vector in our Stock Forecast Toolbox’s 10-day forecast.
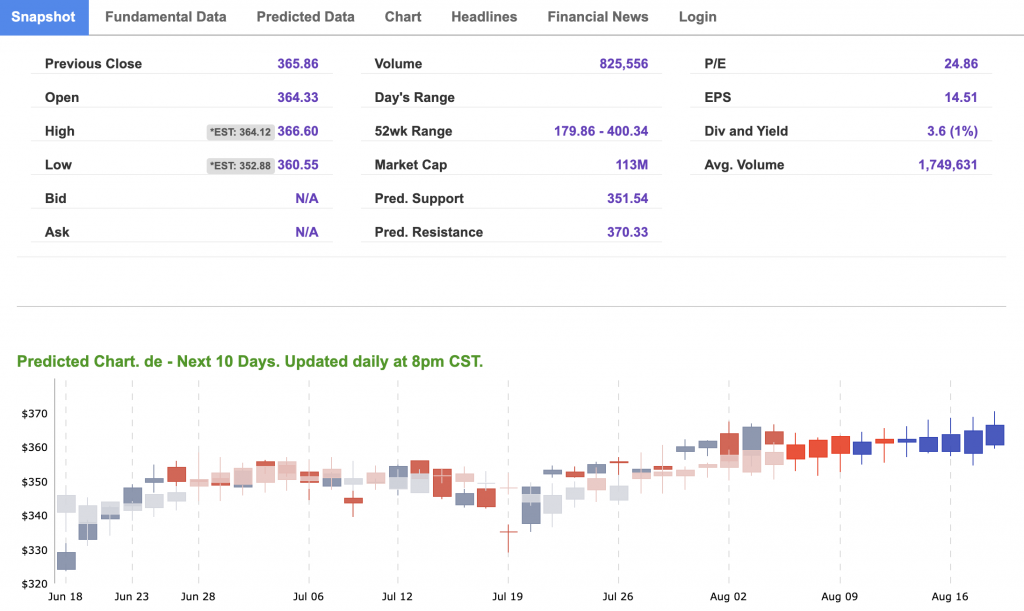
The stock is trading at $360.67 with a vector of -1.27% at the time of publication.
10-Day Prediction data uploaded after the market close at 6 p.m., CST. Today’s data is based on market signals from the previous trading session.
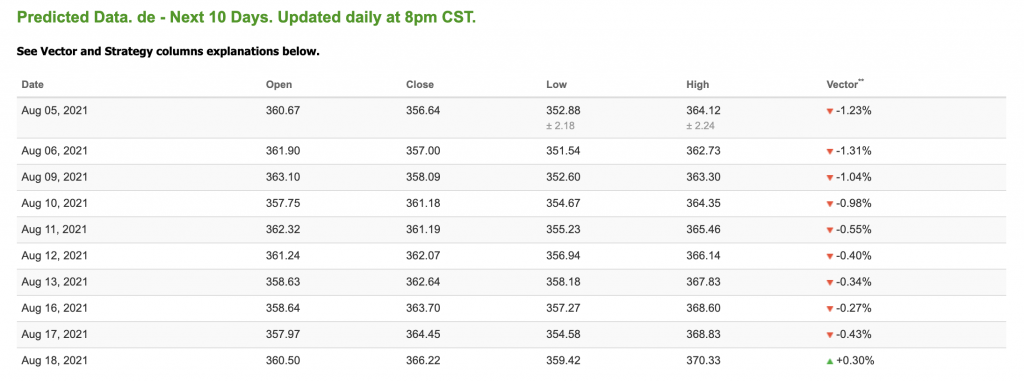
Note: The Vector column calculates the change of the Forecasted Average Price for the next trading session relative to the average of actual prices for the last trading session. The column shows the expected average price movement “Up or Down”, in percent. Trend traders should trade along the predicted direction of the Vector. The higher the value of the Vector the higher its momentum.
*Please note: At the time of publication Vlad Karpel does NOT have a position in the featured symbol, DE. Our featured symbol is part of your free subscription service. Not included in any paid Tradespoon subscription service. Vlad Karpel only trades his money in paid subscription services. If you are a paid subscriber, please review your Premium Member Picks, ActiveTrader, or MonthlyTrader recommendations. If you are interested in receiving Vlad’s picks, please click here.
Oil
West Texas Intermediate for Crude Oil delivery (CL.1) is priced at $68.02 per barrel, down 3.60% at the time of publication.
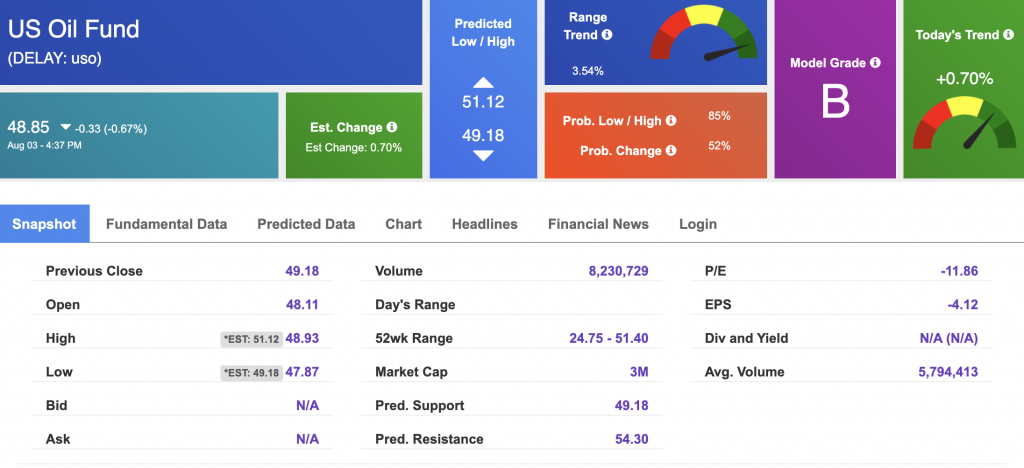
Looking at USO, a crude oil tracker, our 10-day prediction model shows mixed signals. The fund is trading at $48.85 at the time of publication. Prediction data uploaded after the market close at 6 p.m., CST. Today’s data is based on market signals from the previous trading session.
Gold
The price for the Gold Continuous Contract (GC00) is up 0.01% at $1814.20 at the time of publication.
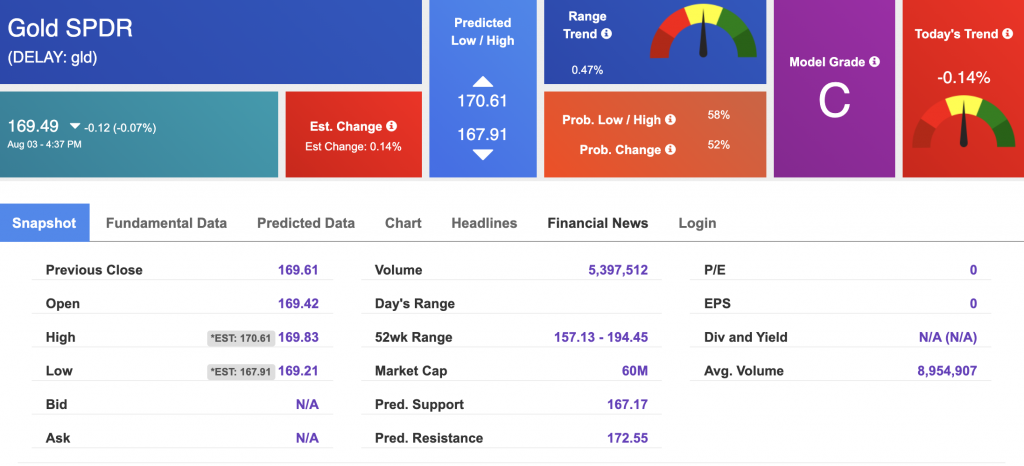
Using SPDR GOLD TRUST (GLD) as a tracker in our Stock Forecast Tool, the 10-day prediction window shows mixed signals. The gold proxy is trading at $169.49 at the time of publication. Vector signals show -0.14% for today. Prediction data uploaded after the market close at 6 p.m., CST. Today’s data is based on market signals from the previous trading session.
Treasuries
The yield on the 10-year Treasury note is up, at 1.184% at the time of publication.
The yield on the 30-year Treasury note is down, at 1.837% at the time of publication.
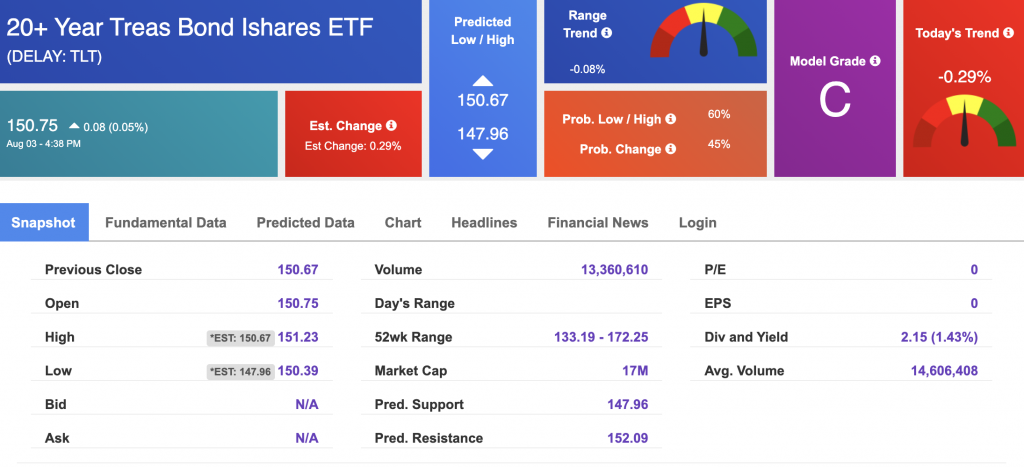
Using the iShares 20+ Year Treasury Bond ETF (TLT) as a proxy for bond prices in our Stock Forecast Tool, we see mixed signals in our 10-day prediction window. Prediction data uploaded after the market close at 6 p.m., CST. Today’s data is based on market signals from the previous trading session.
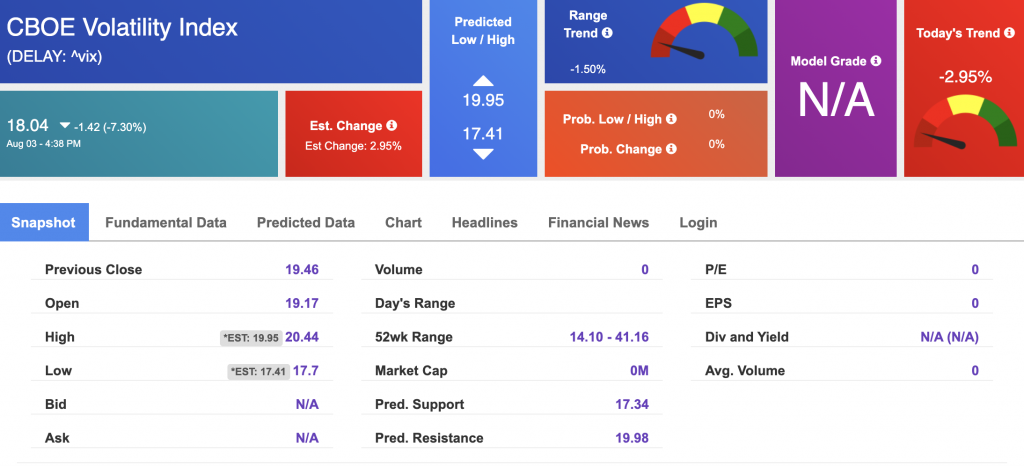
Volatility
The CBOE Volatility Index (^VIX) is $18.04 at the time of publication, and our 10-day prediction window shows mixed signals. Prediction data is uploaded after the market close at 6 p.m., CST. Today’s data is based on market signals from the previous trading session.