
S&P Hits Fresh Record High
The first thing the bulls needed to do was have a positive follow thru from the prior week’s rebound and that mission was accomplished with Tuesday’s higher highs, and higher lows. This extended the v-shape recovery off the prior Monday’s intraday lows with key resistance levels getting cleared and holding.
Wednesday’s action was also bullish and pushed the major indexes back into record territory. The only slight concern was the action in the small-caps as they finished the session lower.
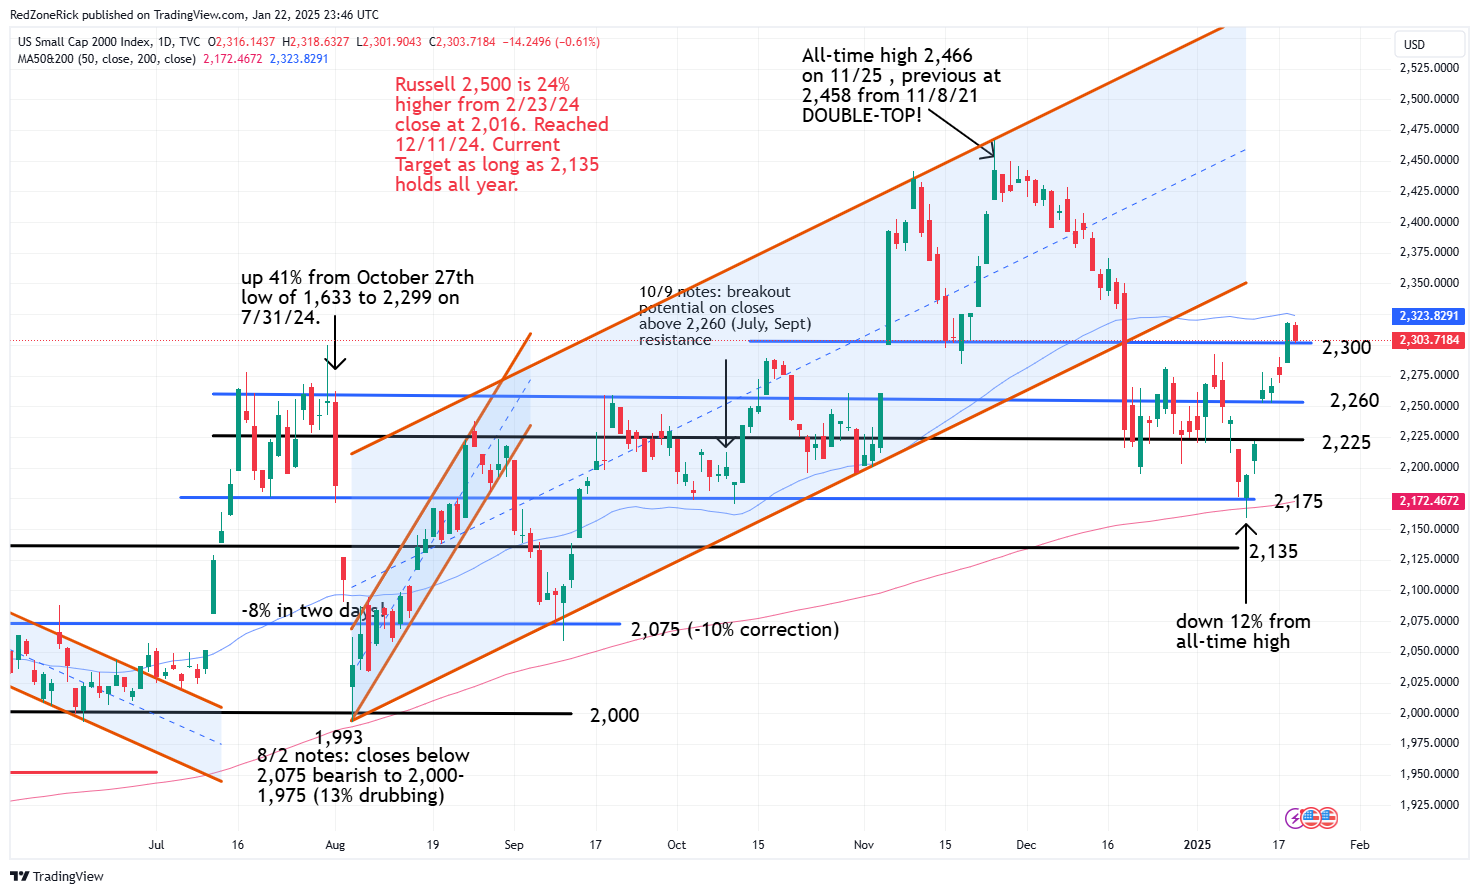
The Russell cleared and held 2,300 on Tuesday and again on Wednesday’s slight pullback. This was slightly bullish despite the lower close but will become a deeper concern if this level fails to hold into the weekend. The bigger hurdles remain at 2,325 and the 50-day moving average.
There is stretch down to 2,275 if 2,300 fails with a close below key support at 2,260 suggesting a false breakout.
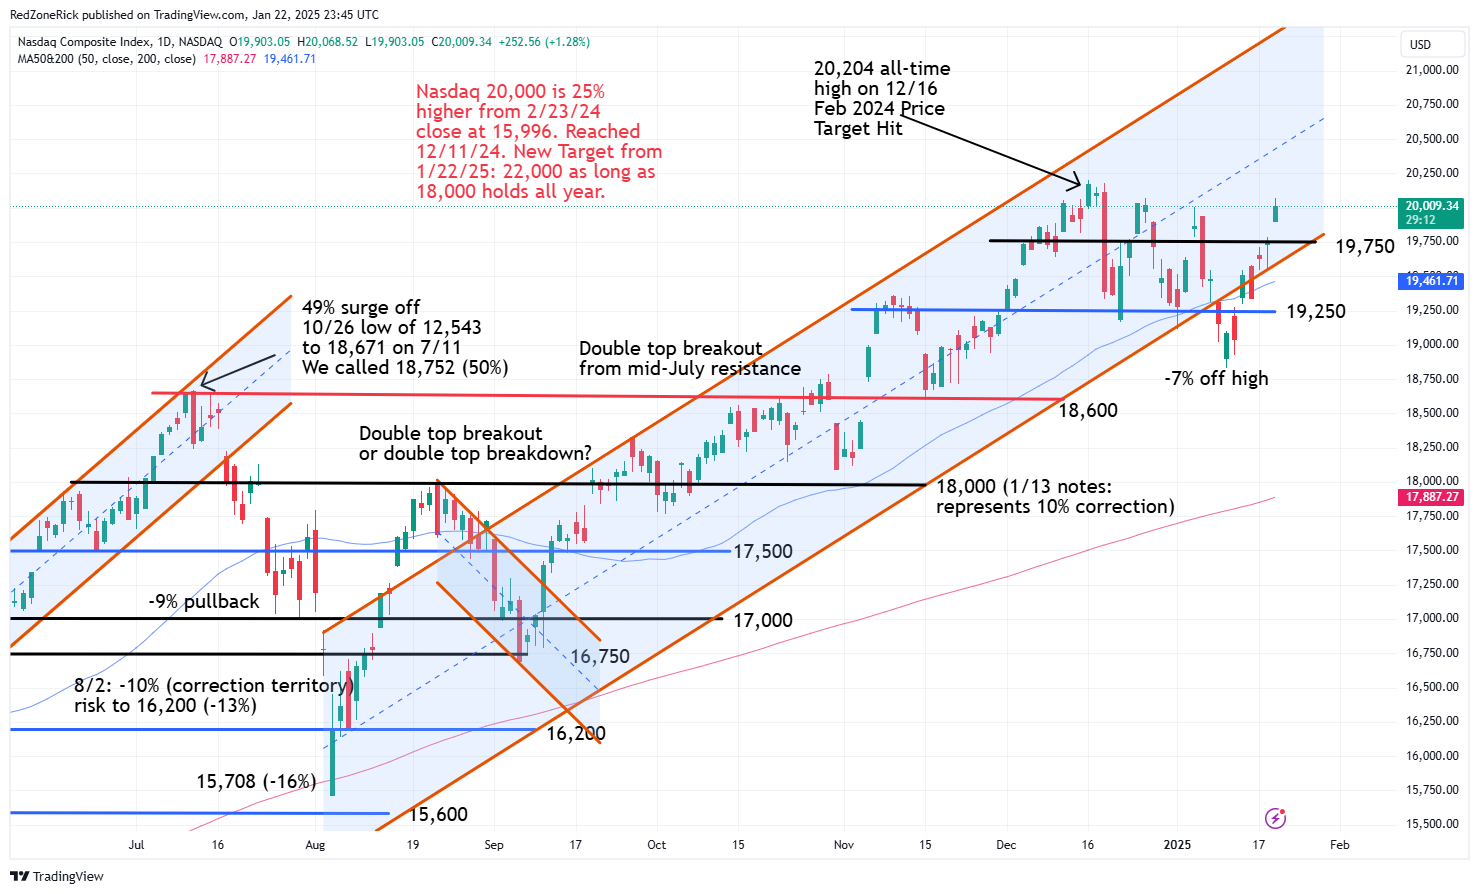
The Nasdaq came with 136 points of its December 16th record high of 20,204 after clearing and holding key resistance at 20,000. Tuesday’s close above 19,750 was an excellent clue a quick gap up to 20,000-20,250 would come. There is breakout potential up to 20,500-20,750 on continued strength.
Shaky support is at 19,750 with 19,500 serving as backup.
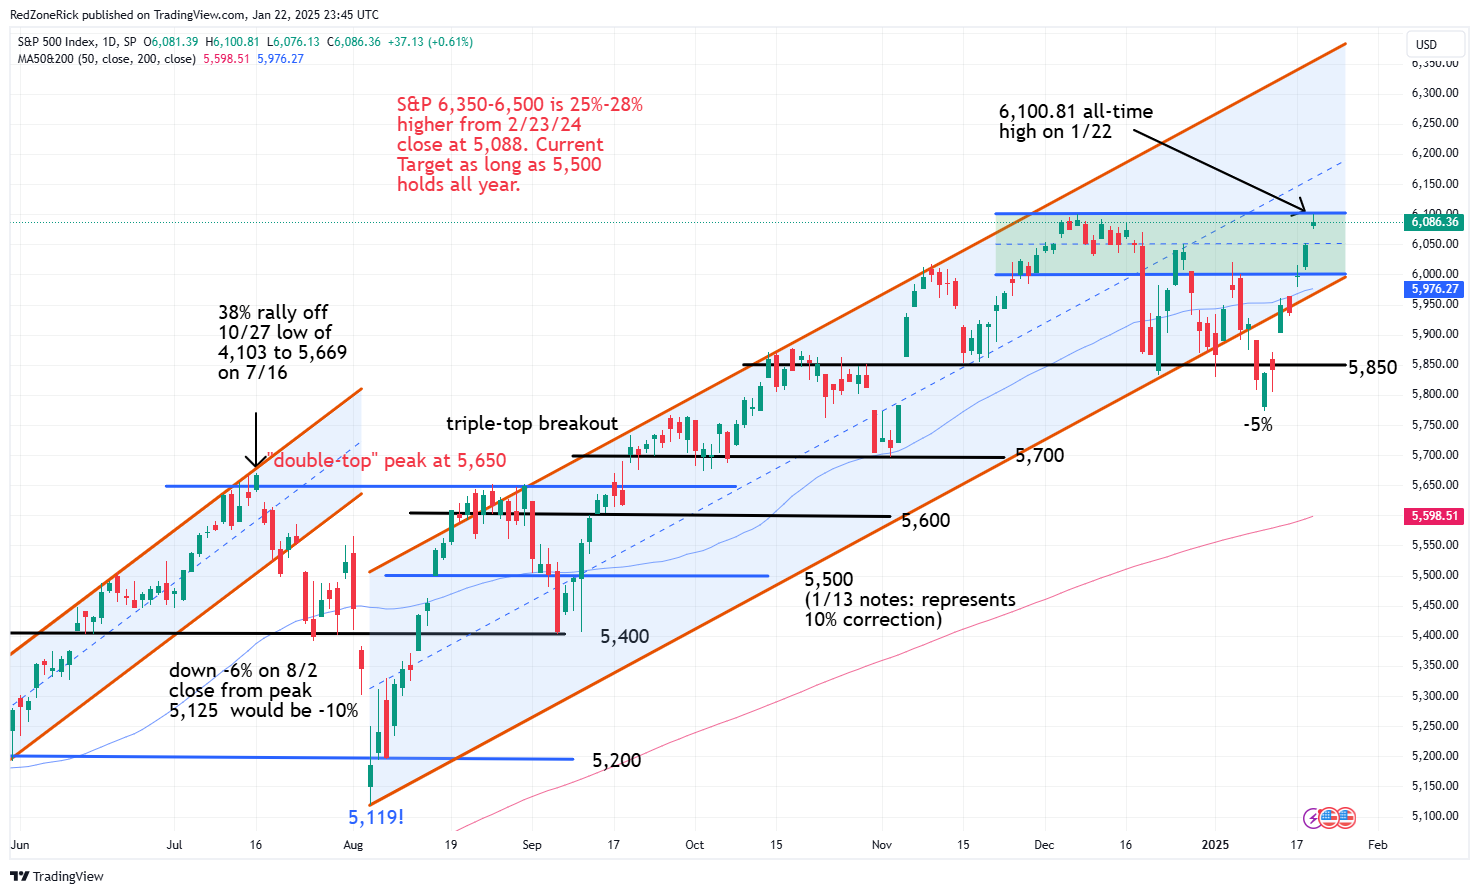
The S&P finally cleared 6,100 (by a half-point) after stalling at this level throughout the first half of December. Multiple closes above 6,100 sets up a run towards 6,150-6,200.
Support is at 6,050-6,000 with the latter representing the prior trading range from late November and thru the first half of December.
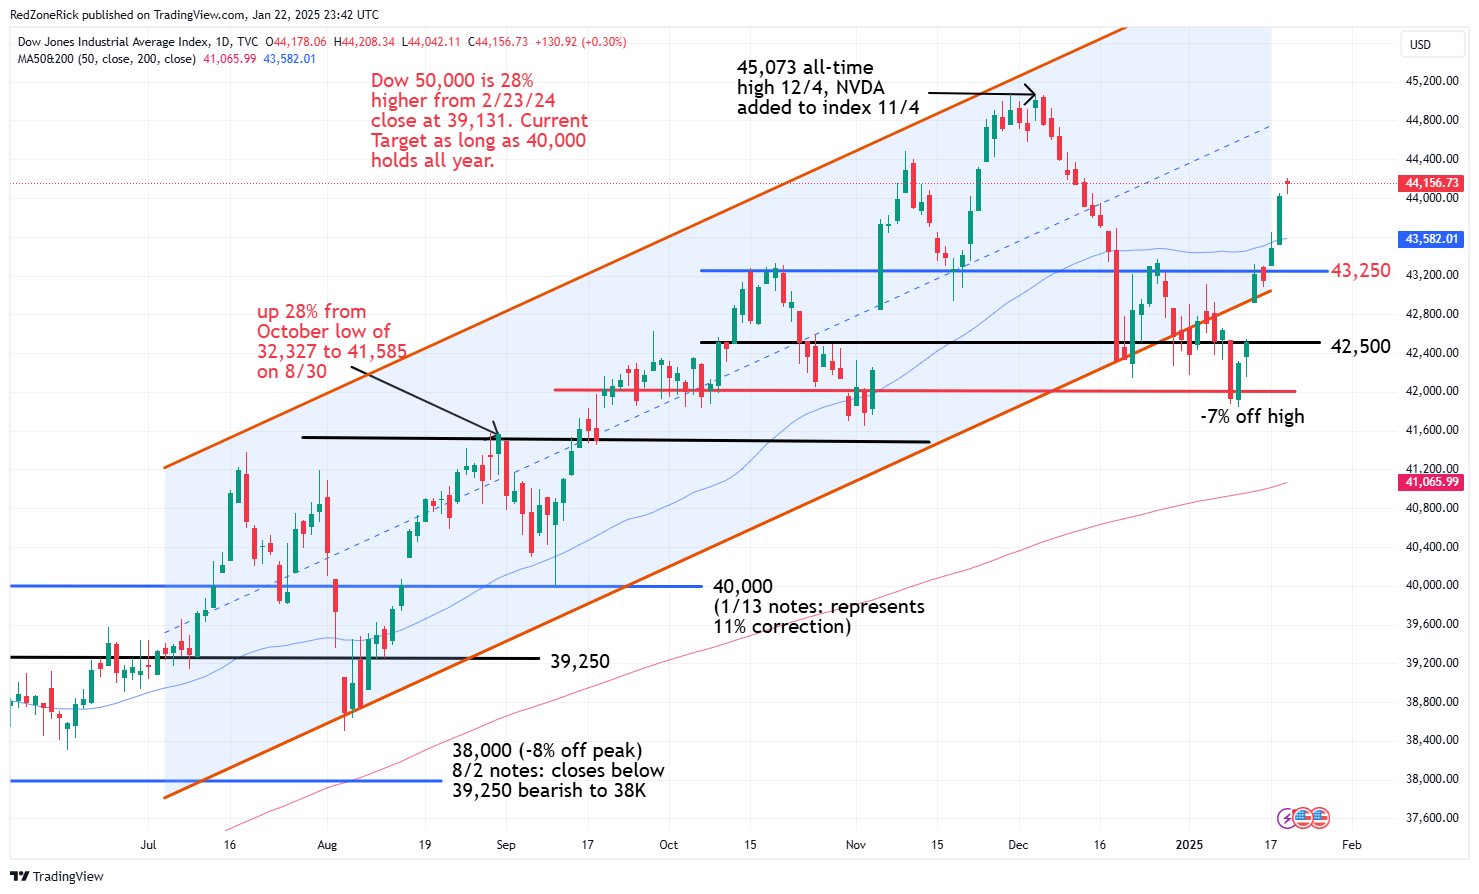
The Dow cleared and held 44,000 on Tuesday while reclaiming the 50-day moving average in the process. This was a very bullish development and opens up a retest towards 45,000 and the December 4th all-time high at 45,073.
Support is at 43,750-43,500. A close back below 43,250 would suggest a near-term peak.
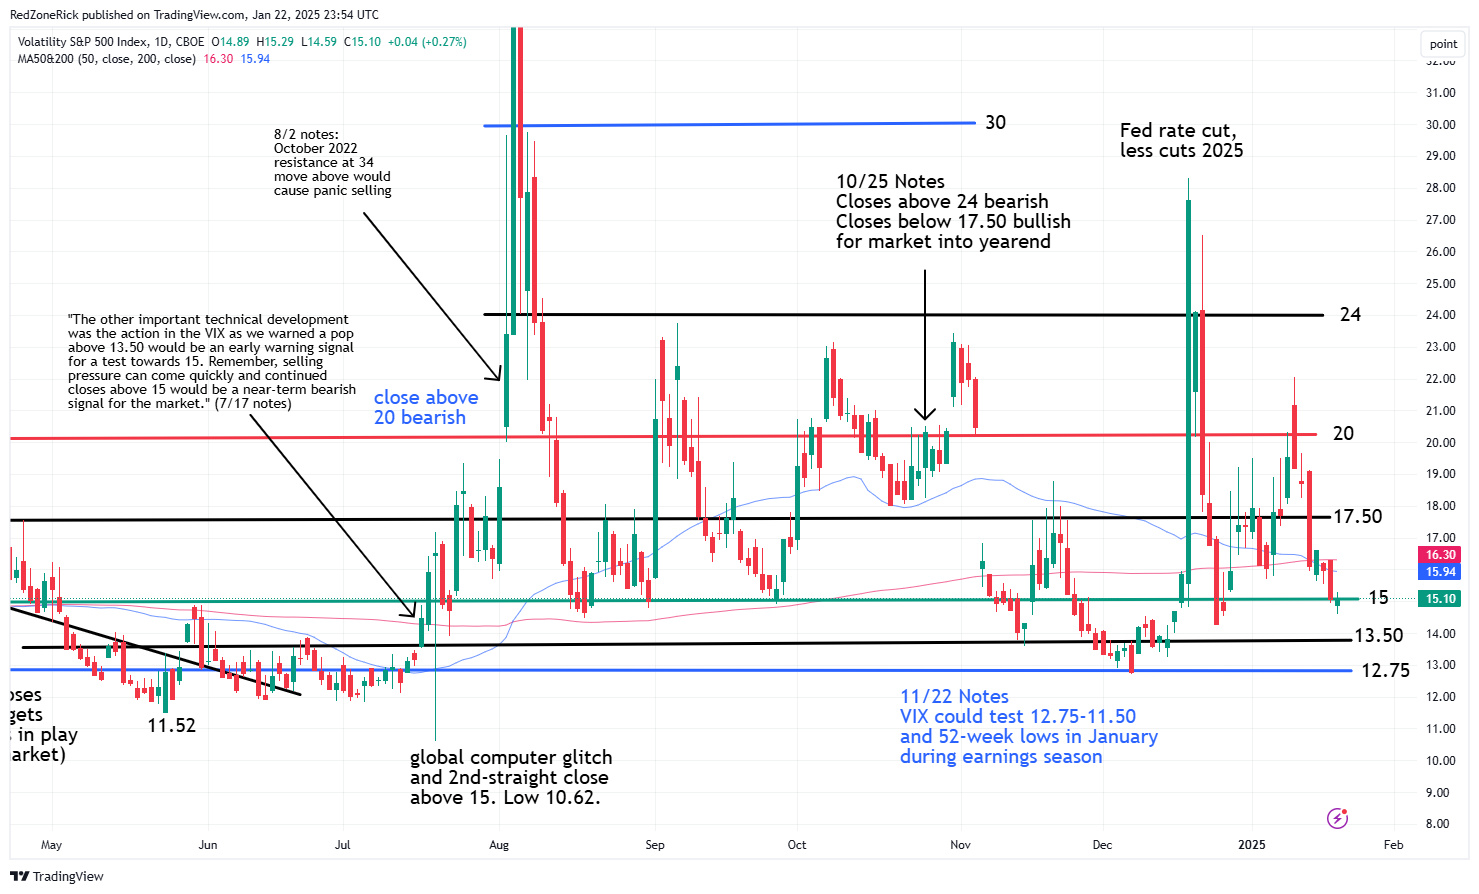
The Volatility Index (VIX) fell 5% on Tuesday’s market strength and just missed closing below 15 after trading down to 14.93. Wednesday’s lower low to 14.59 was an ongoing bullish signal despite the fact 15 held. Continued closes below this level would imply weakness to 13.50 and possibly 12.75 over the near-term.
Resistance is at 16-16.50 and the 50-day / 200-day moving averages. A close back above 17.50 would be a slightly bearish development for the market.
Key support levels that need to hold into the weekend are at Nasdaq 19,750; S&P 6,000; and Dow 44,000. These targets also conveniently represent the bottom of the uptrend channels. As for the Russell, the 2,260 level needs to hold on a continued pullback.