
Market Rallies 3% for the Week
Wall Street closed out its second consecutive bullish week despite Friday’s slight pullback as traders prepare for the heart of the fourth-quarter earnings season. Tech companies will take center stage this upcoming week with the major indexes at or near record highs.
The S&P was the first index to trade to fresh highs last Wednesday and was up 2.8% for the week. We wanted to see the Nasdaq follow suit by the weekend but the index fell 86 points shy after rising 3.2% for the week.
If a major index is making all-time highs, other indexes or sectors, are likely to join in the bullishness. At current levels, the Dow and Nasdaq are 1% away from fresh all-time peaks and the Russell is 6% from achieving new highs.
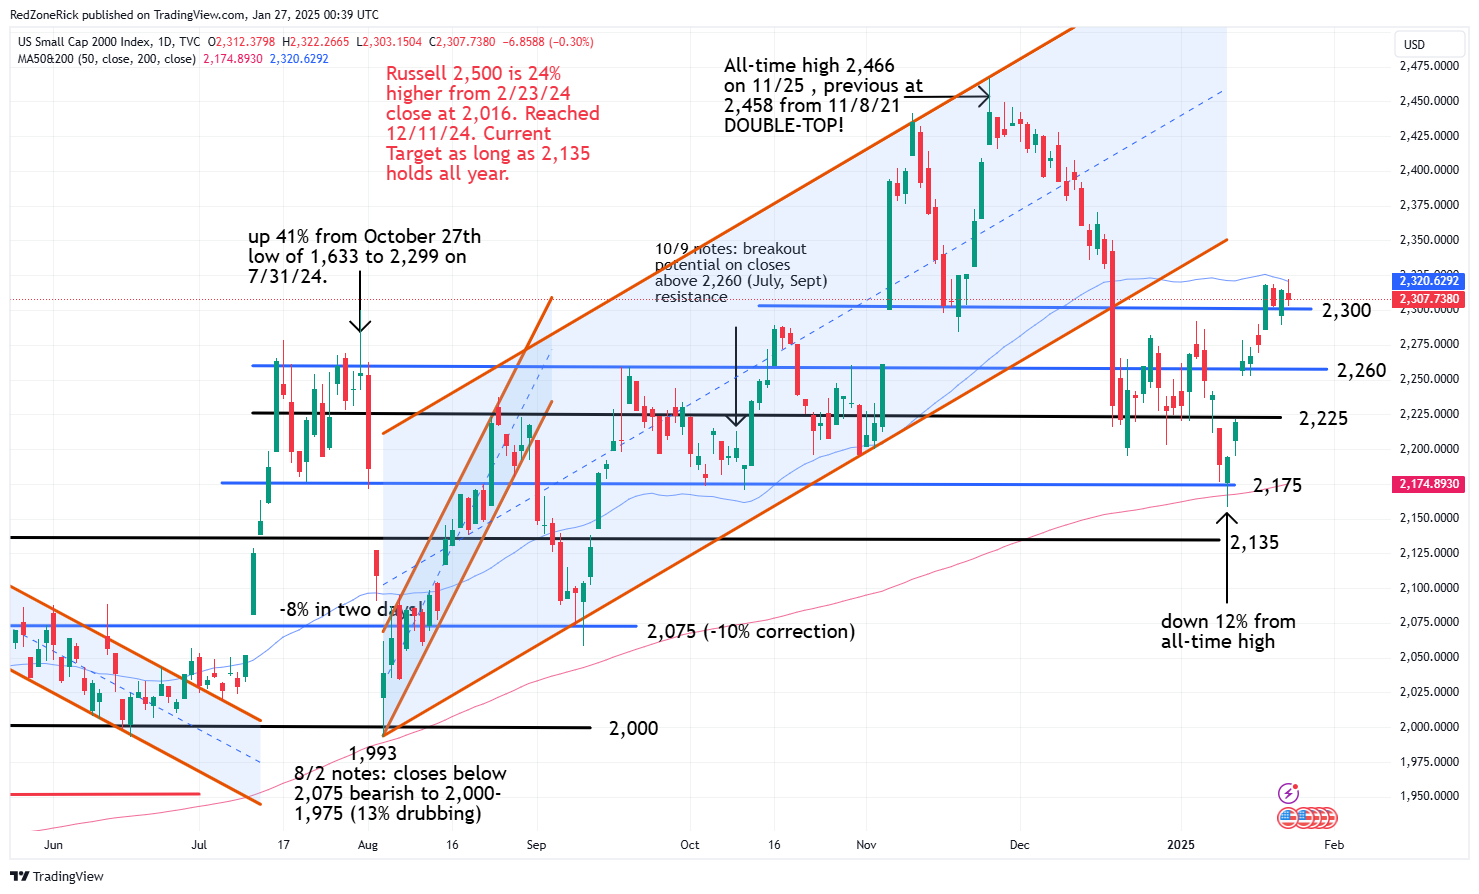
The action in the Russell lagged following last Tuesday’s surge above key resistance at 2,300. This level held on Wednesday and Thursday’s flip-flop action afterwards with Friday’s high at 2,322. Key resistance at 2,325 and the 50-day moving average held before the lower close.
There is risk down to 2,275 if 2,300 fails to hold with a close below key support at 2,260 confirming a stalled breakout. The 50-day moving average is also showing signs of rolling over after flatlining since mid-December.
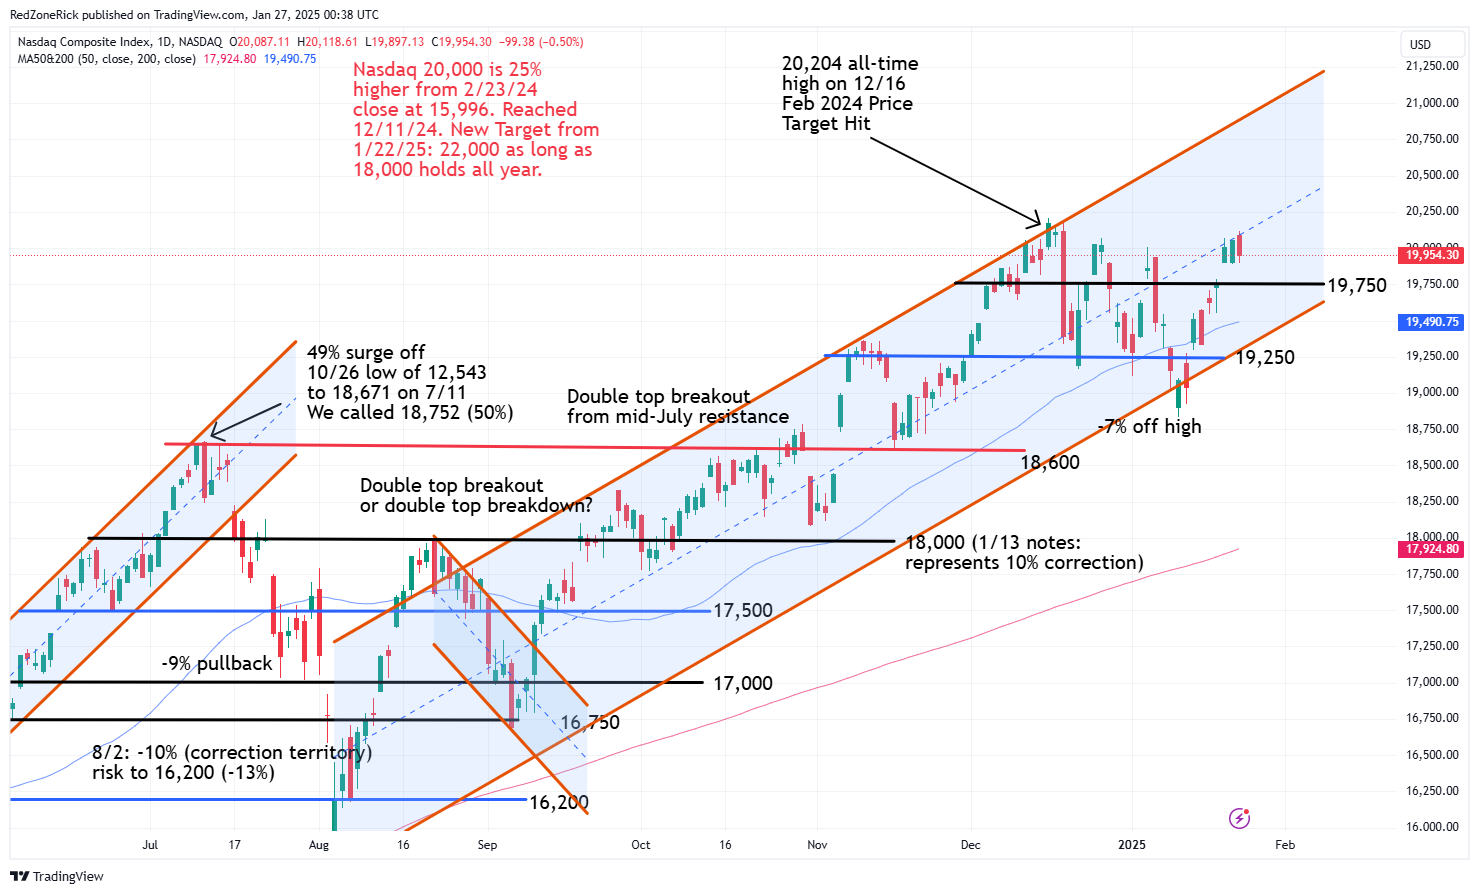
The Nasdaq cleared key resistance at 20,000 on Wednesday and held this level on Thursday’s weakness before a higher close. The December 16th record high at 20,204 held before Friday’s close back below 20,000. The middle of the current and readjusted uptrend channel is at 20,500 on renewed strength with the top showing upside towards 21,250 in February.
Shaky support is at 19,900 with 19,750-19,500 and the 50-day moving average serving as safety nets on a close below this level. The 19,500 level also represents the bottom of the uptrend channel.
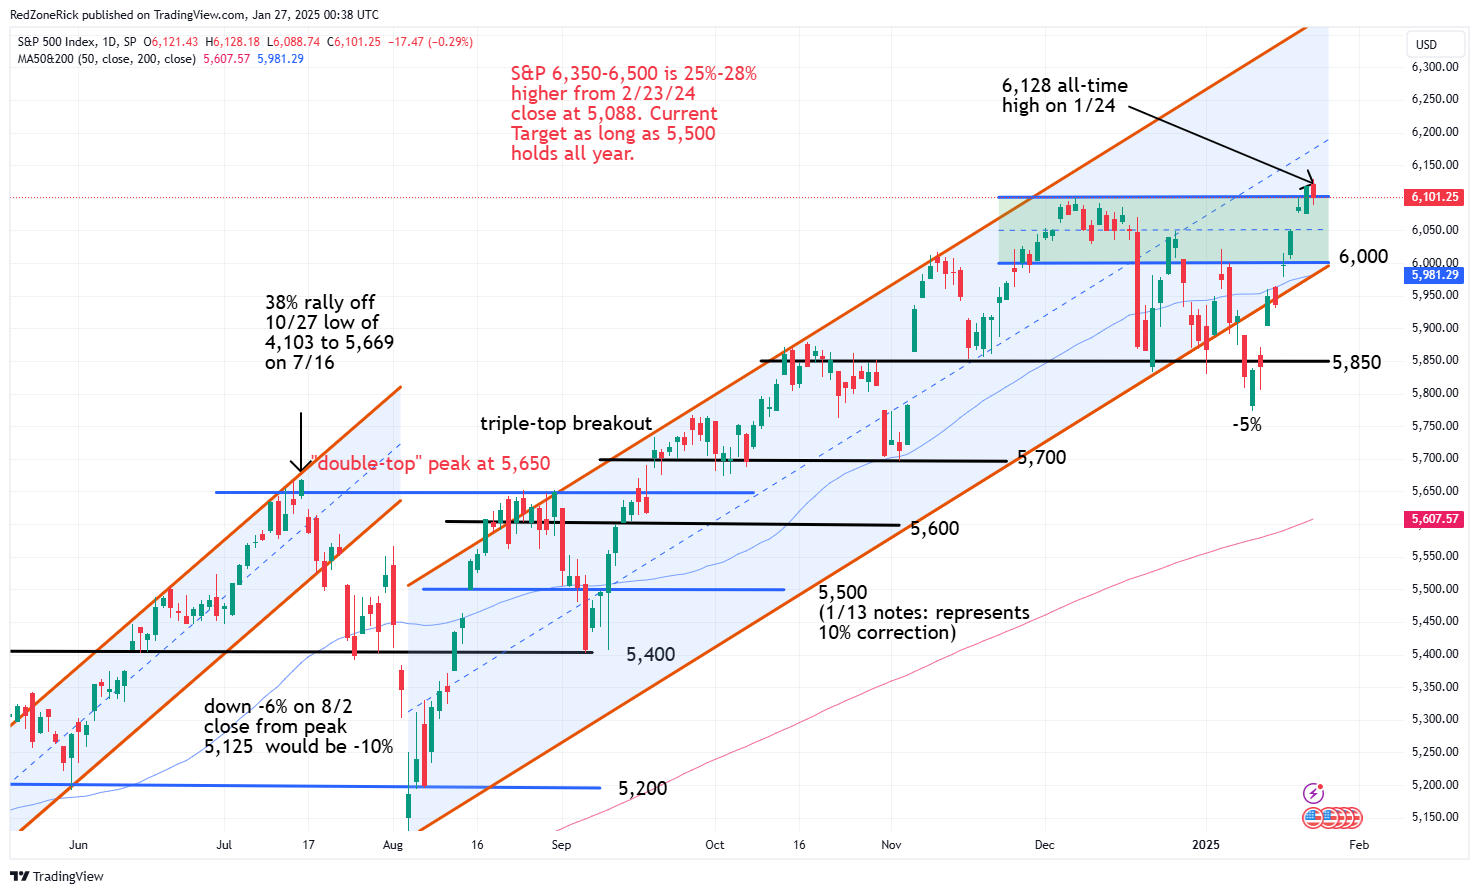
The S&P recorded its third-straight record high after ripping right thru its previous trading range between 6,000-6,100 to close out the week. There is upside potential to 6,200-6,250 over the near-term with the former representing the middle of the current uptrend channel.
The top of the trading range held on Friday’s close above 6,100. A drop below 6,075, and last Wednesday and Thursday’s lows at 6,076 and 6,074, would suggest a retest to 6,050-6,000. A close below the latter and the bottom of the uptrend channel would be a slightly bearish development.
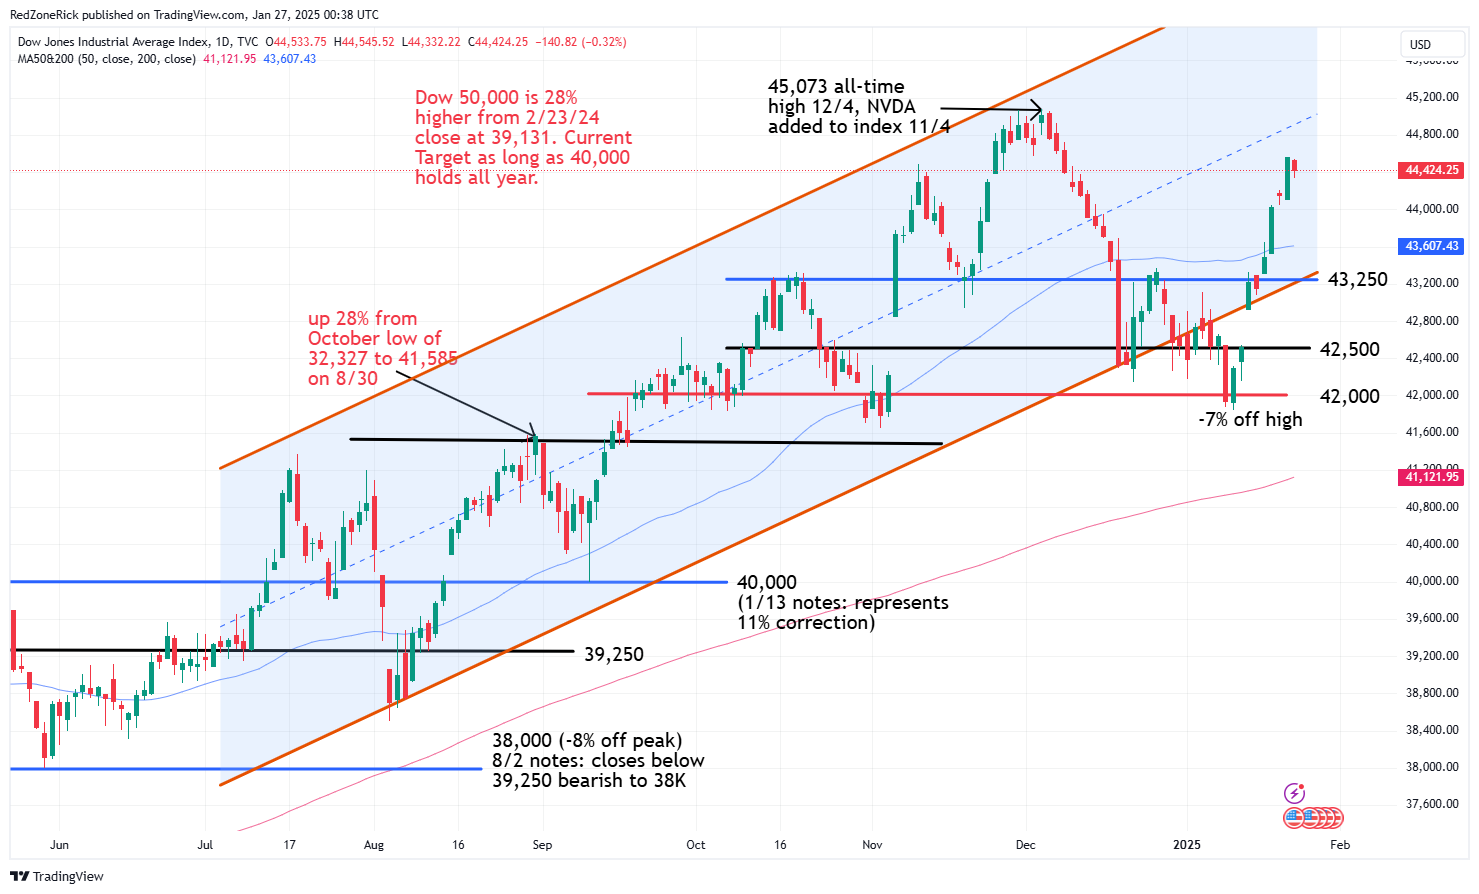
The Dow cleared and held 44,000 on Tuesday while reclaiming the 50-day moving average in the process. This was a very bullish development and opened up a retest towards 45,000 and the December 4th all-time high at 45,073. The index has nearly recovered all of its losses following the 10-session losing streak afterwards. Even more impressive, the gains have come in eight days following the January 10th and 13th double-bottom just below the 42,000 level.
There are several layers of key support starting at 44,000 and then 43,500 and the 50-day moving average. A close back below 43,250 and the bottom of the uptrend channel would suggest another near-term top.
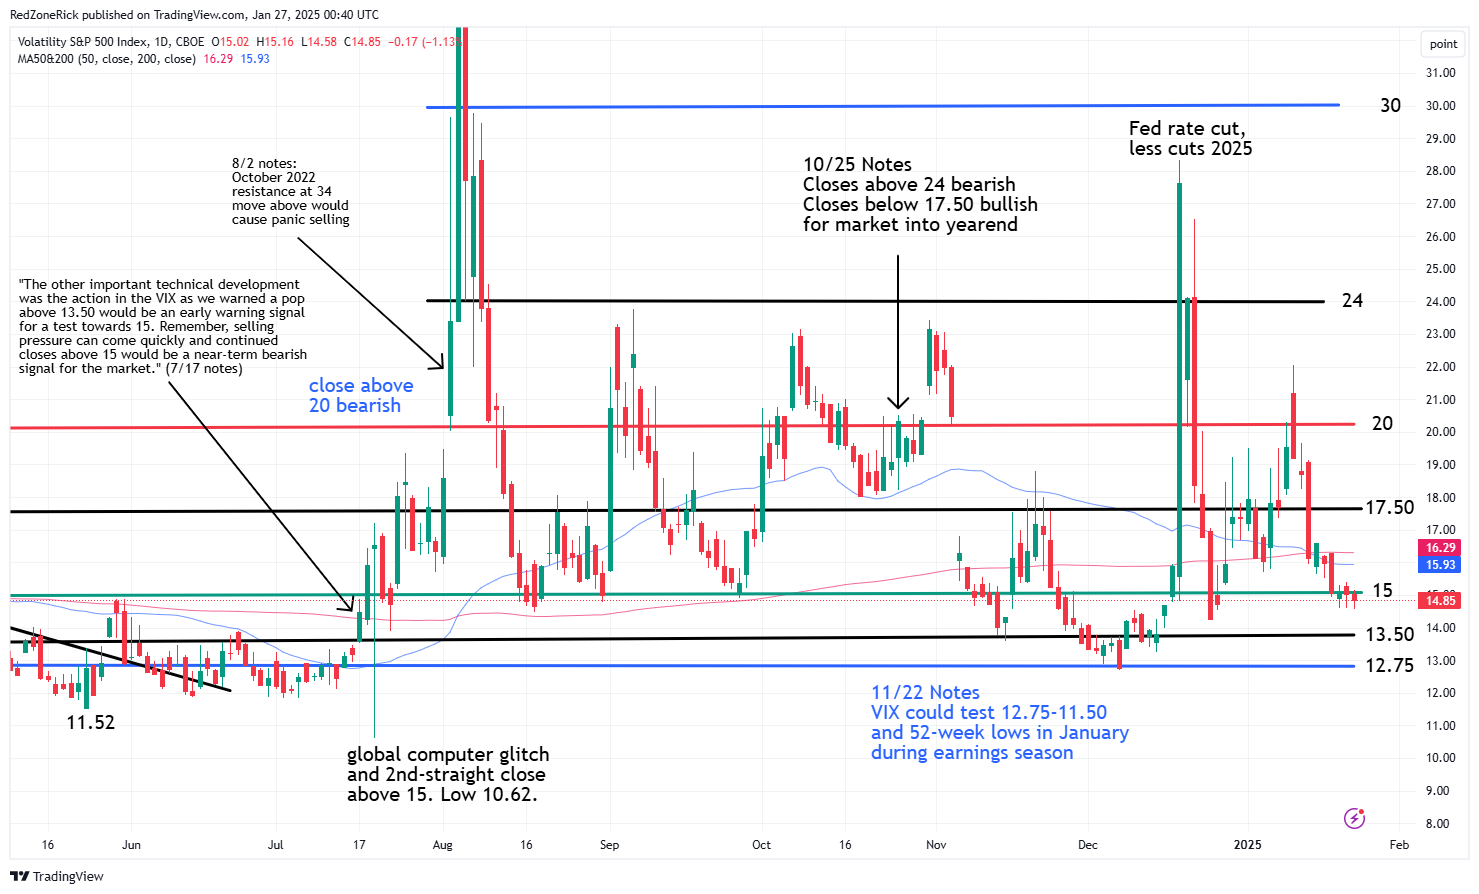
The Volatility Index (VIX) fell below 15 on Tuesday, Wednesday, and Thursday but failed to hold this level into the closing bell. Friday’s slightly lower low to 14.58 and close below 15 in a down market remains an ongoing bullish signal.
Continued closes below this level would imply weakness to 13.50 and possibly 12.75 over the near-term. A double-bottom occurred at the 12.75 level on the December 4th and 6th lows at 12.89 and 12.70, respectively.
Resistance remains at 16-16.50 and the 50-day / 200-day moving averages. A close back above 17.50 would ruin the current momentum for the market.
The dip buying that continues to occur is mirroring the previous price patterns throughout 2024. For instance, the Russell was down 9% from its late March peak before a v-shape recovery. The index sank 13% in four sessions from its late July peak of 2,299 to its August 5th intraday low at 1,993 before a wave of buying came in.
Additionally, the Russell had fallen 11% from its November all-time peak at 2,466 to a December 20th low of 2,194 before bargain hunters stepped-in. And more recently, the January 13th test to 2,158 and the 200-day moving average represented a 12% selloff. The other major indexes were also bought on the dips but they weren’t as pronounced as the small-caps pullbacks.
As we mentioned earlier, this is a big week for Tech earnings with Apple (AAPL), Meta Platforms (META), Microsoft (MSFT) and a slew of other high profile companies reporting numbers. The action should produce higher all-time highs, or a possible stalled rally.