

Bears Hold Key Resistance Levels
The bulls held key support levels on last Monday’s mini selloff while the bears held key resistance levels on Friday. Both sides remain within striking distance of establishing the next major trend but the stalemate between a breakout, or breakdown, continues and has been ongoing since mid-January.
The Russell teased us once again after testing an intraday high of 2,326 on Thursday before tumbling to a low of 2,277 ahead of Friday’s closing bell. We have been talking all year long about closes above 2,325 and the 50-day moving average being a more bullish outlook for the index. Thursday’s action played out like a fiddle and why we always say wait for multiple closes above or below key resistance and support levels to confirm possible price action.
Upper support at 2,275-2,260 is back in play with downside risk to 2,225. Monday’s low kissed 2,229 with closes below the latter two levels getting 2,200-2,175 and the 200-day moving average in focus.
The Dow kissed 44,966 on Thursday’s intraday top with key resistance at 45,000 holding for the fifth time in eight sessions. This area now represents the middle of the current uptrend channel with the December 4th all-time peak at 45,073.
The lack of a higher high on Friday’s open and the pullback afterwards keeps weakness open down to 44,000-43,750 and the 50-day moving average. A close below 43,500 and out of the current uptrend channel would be a slightly bearish development.

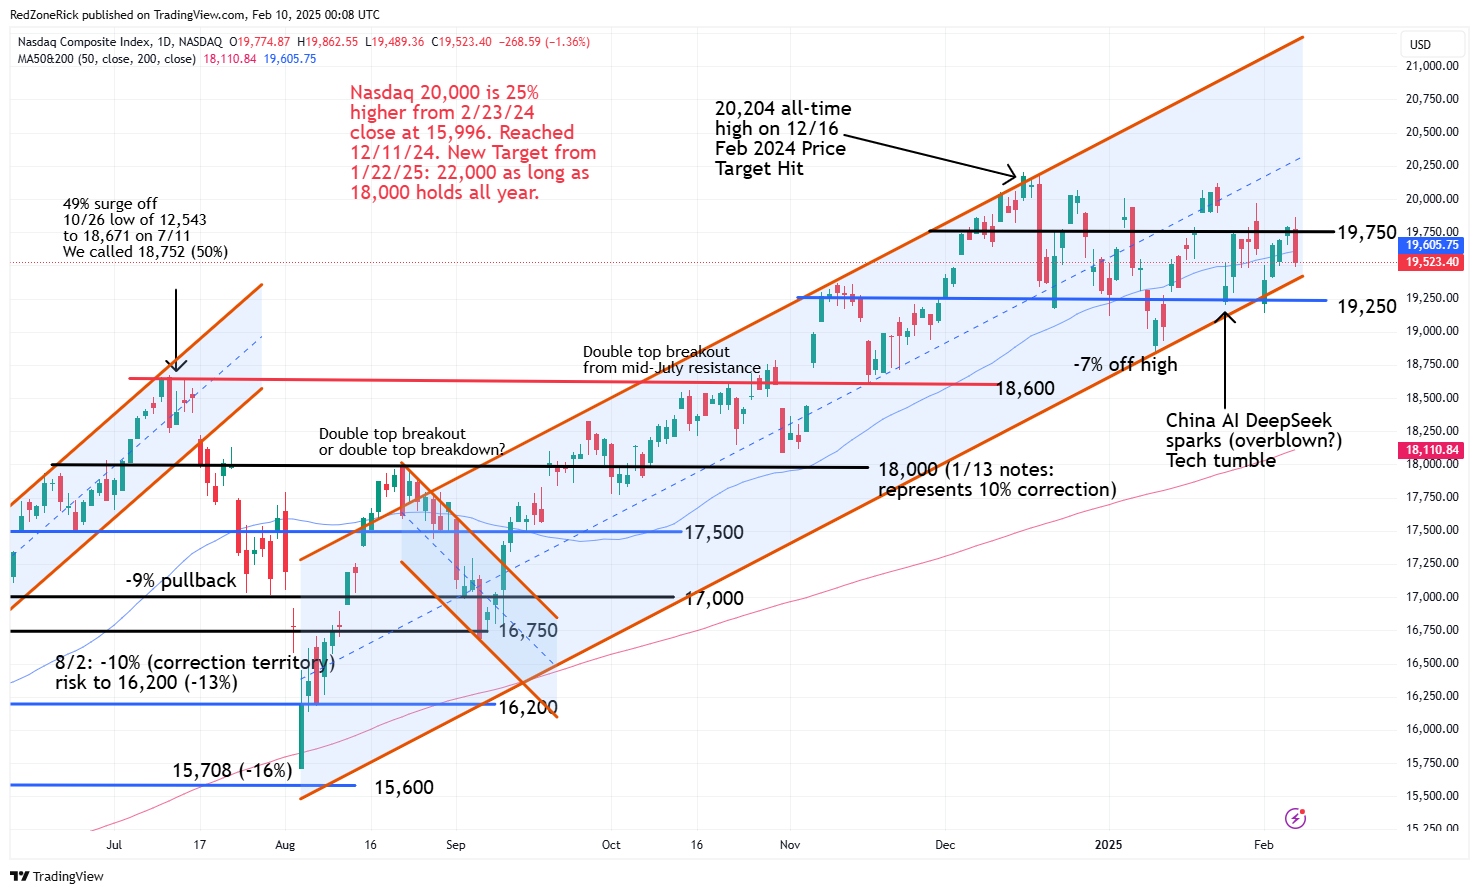
The Nasdaq continues to stay within uptrend channel but failed to hold 19,750 after reclaiming this level on Thursday. This would have kept a retest towards 20,000-20,250 in the mix with the December 16th all-time record at 20,204.
Key support remains at 19,250 with last Monday’s low at 19,141. A drop below these levels and out of the uptrend channel could lead to a further fade to 19,000-18,750.
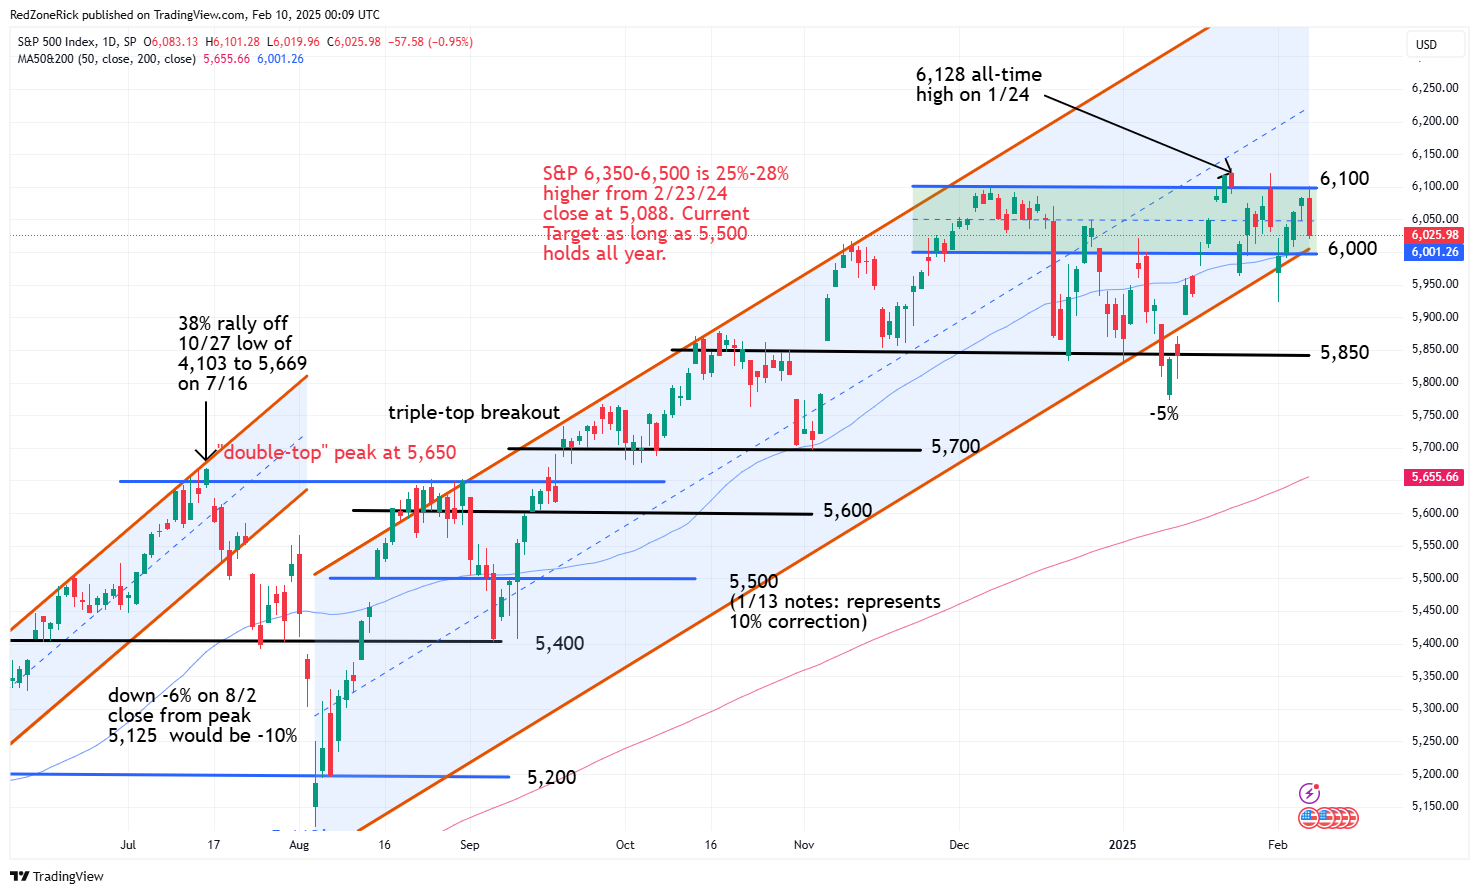
The S&P remains in a 13-session trading range between 6,000-6,100 with the January 24th all-time high at 6,128. We mentioned the prior range in this zone lasted 16 sessions before a 5% pullback. Multiple closes above 6,100 would be bullish for potential momentum up to 6,200-6,250.
Key support is at 6,000 and the 50-day moving average. There is risk down to 5,900-5,850 if 5,925 and Monday’s bottom at 5,923 fail to hold this week.
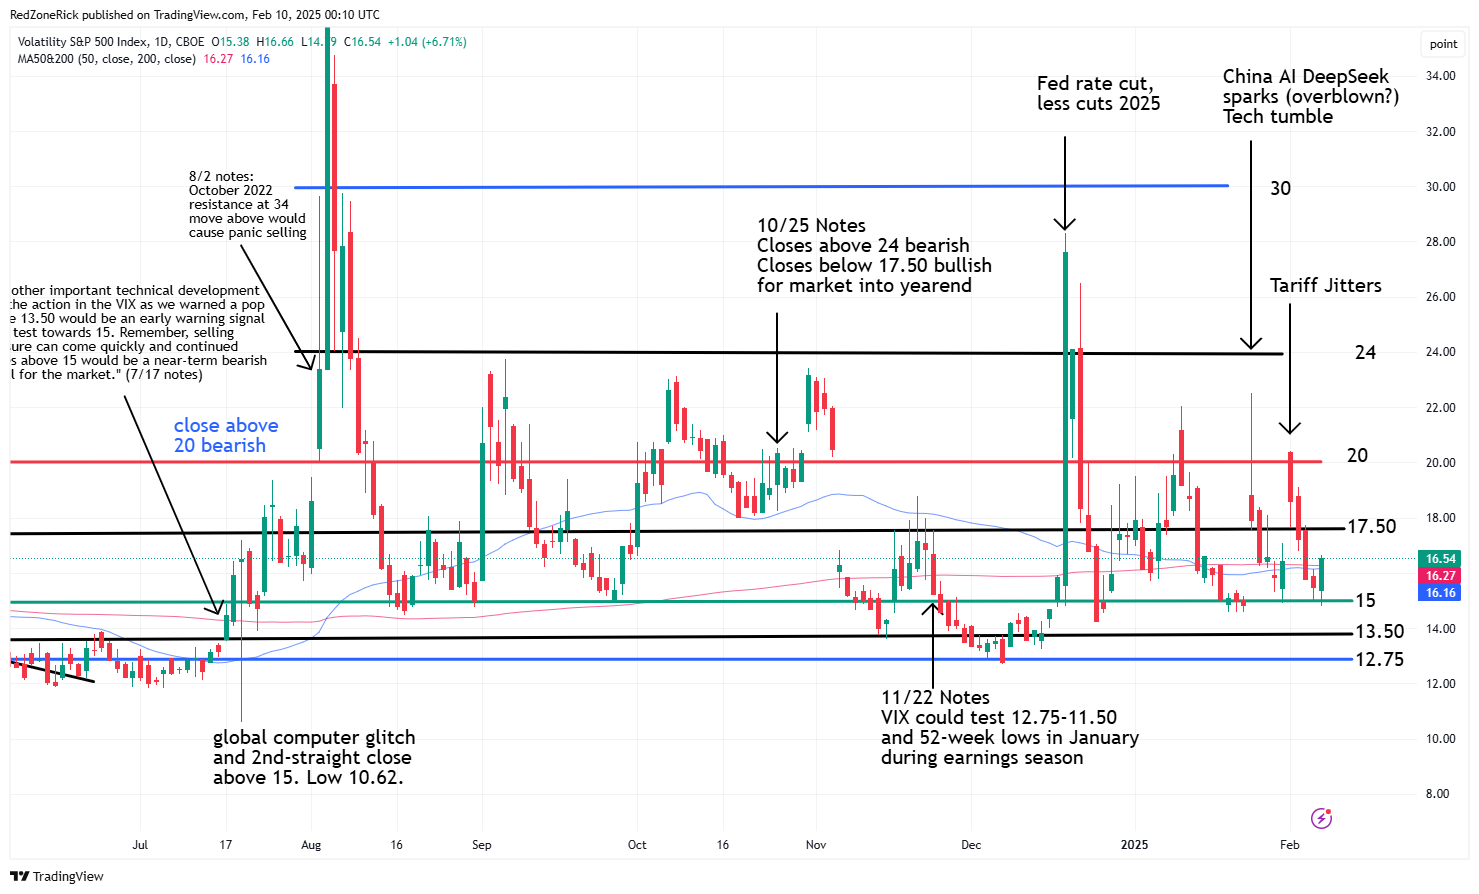
The Volatility Index (VIX) made a lower weekly low at 14.79 on Friday with key support at 15 getting stretched for the second-straight session but holding. Closes below this level could lead to a retest towards 13.50-12.75.
The close back above the 50-day and 200-day moving averages keeps upside to 17.50-20 in the mix. Monday’s high on the VIX hit 20.42 with additional resistance levels at 22-24.
The VIX has closed below 20 every day since the 24% plunge back below this level on December 20th. The VIX has also closed below 15 just three times over this same time period. Twice ahead of Christmas and on January 24th.
We mentioned February always seems to be a choppy and a very difficult month to trade. It is usually the weakest month in a “bull cycle” that starts in December and can sometimes last into May, based on market seasonality trends.
Friday’s jobs report was weaker-than-expected and what could be the start of a number of economic revisions in the coming months. Ongoing tariff concerns and the fight over to keep the current tax rates could be major headwinds going forward.
Until a clearer trend is established, the whipsaw action will likely continue. We remain in great shape to play the current volatility while also waiting on a more defined breakdown, or breakout, to unfold.
___________________________________________________________________________________
NEW: ‘Pyramid’ System Now Ready For 2025
A 91% win rate is harder and harder to come by these days…
Heck most traders would die for a 70%+ win rate on ANY trade strategy…
Yet here we are. And traders can now use 3 simple trades with an easy to follow ‘pyramid’ system designed to scale risk and reward while doing a better job of allocating your precious trading capital.
Why did traders fall in love with this system in 2024? Because they can mix and match each of these 3 simple trades – using many of the same tickers over and over.
That means it’s repeatable.
And done properly – can make your results more and more consistent over time.
So you have a system that you can use for a lifetime.
Go here… watch this video see if you like the strategies.
(guess what? you can access them for just $5 bucks if you like what you see)