All-Time Highs Back in Focus
8:00am (EST)
The stock market is once showing signs of breaking out to fresh all-time highs despite Friday’s mostly lower close. The major indexes did make higher highs on the open following Thursday’s breakout session on news of President Trump initiating discussions to possibly end the Russian / Ukraine war.
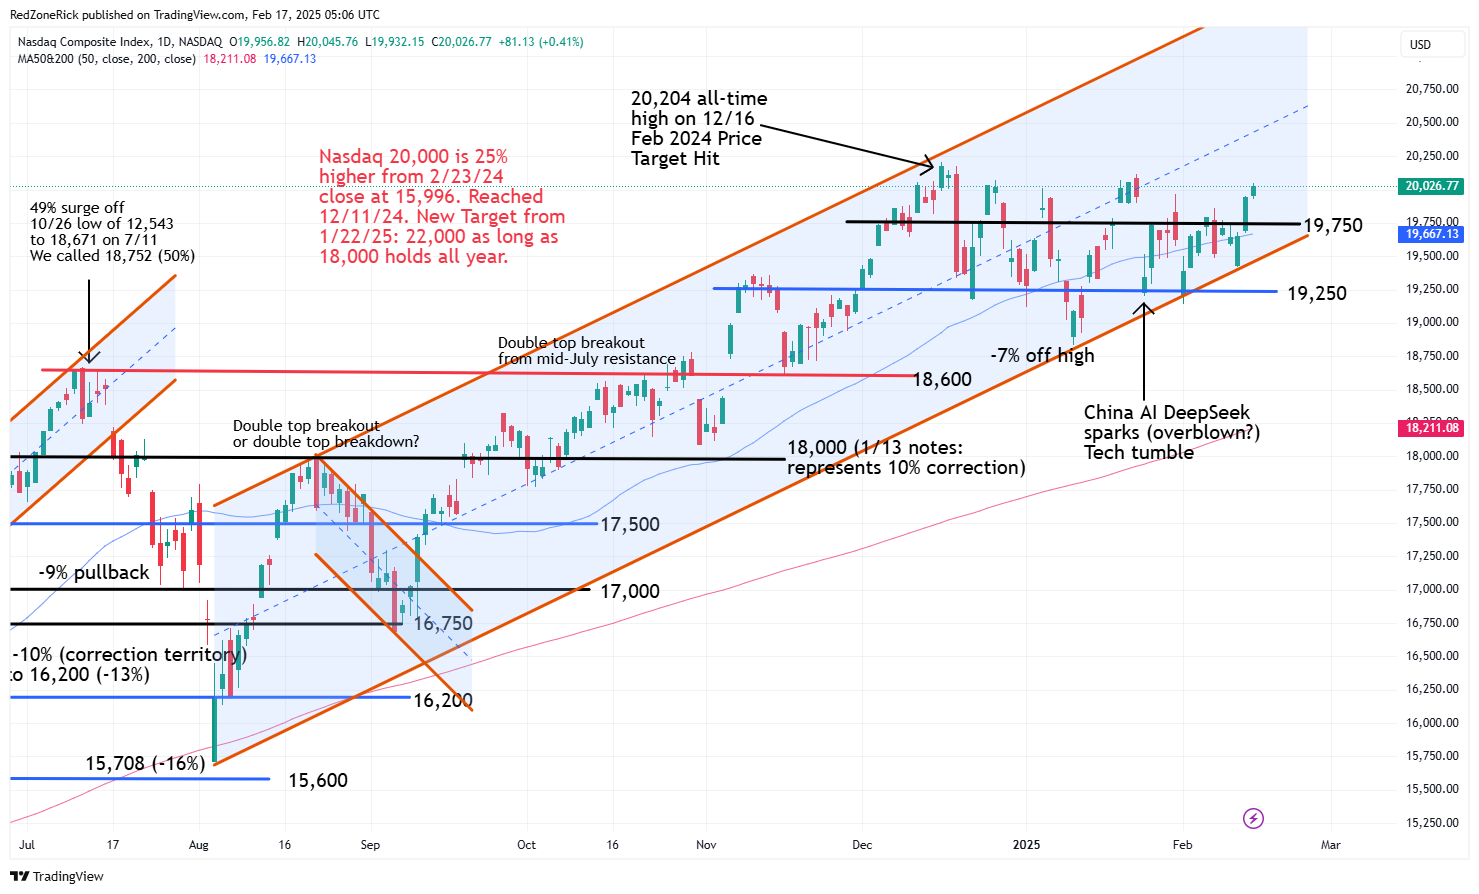
- The Nasdaq made a push to 20,045 while settling at 20,026 (+0.4%). Resistance at 20,000 was recovered. New support is at 19,750.
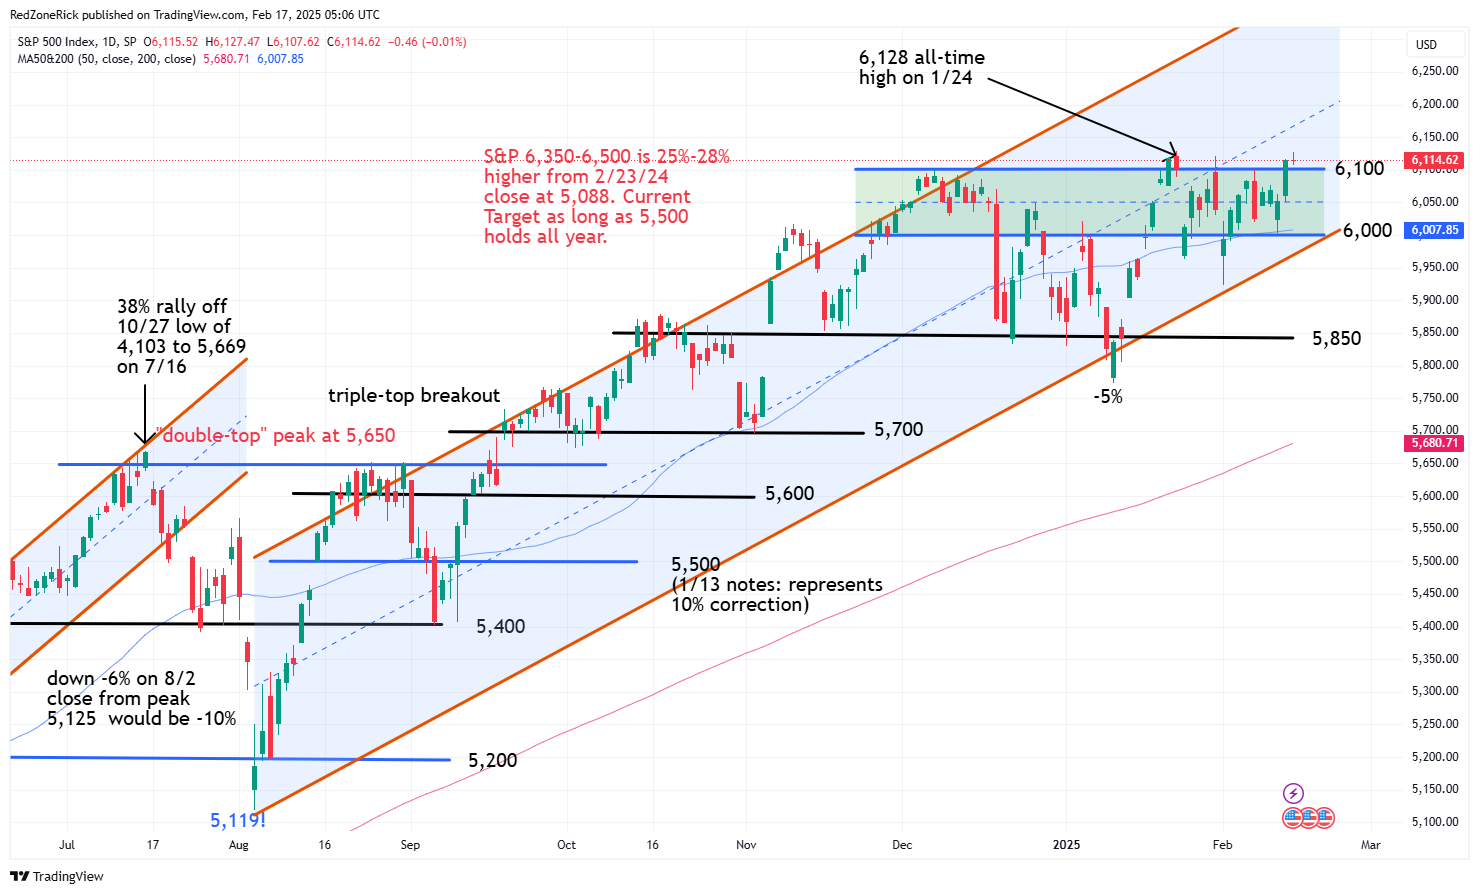
- The S&P 500 went out at 6,114 (-0.01%) after tagging a high of 6,127. Resistance at 6,125 was cleared but held. Support is at 6,100.
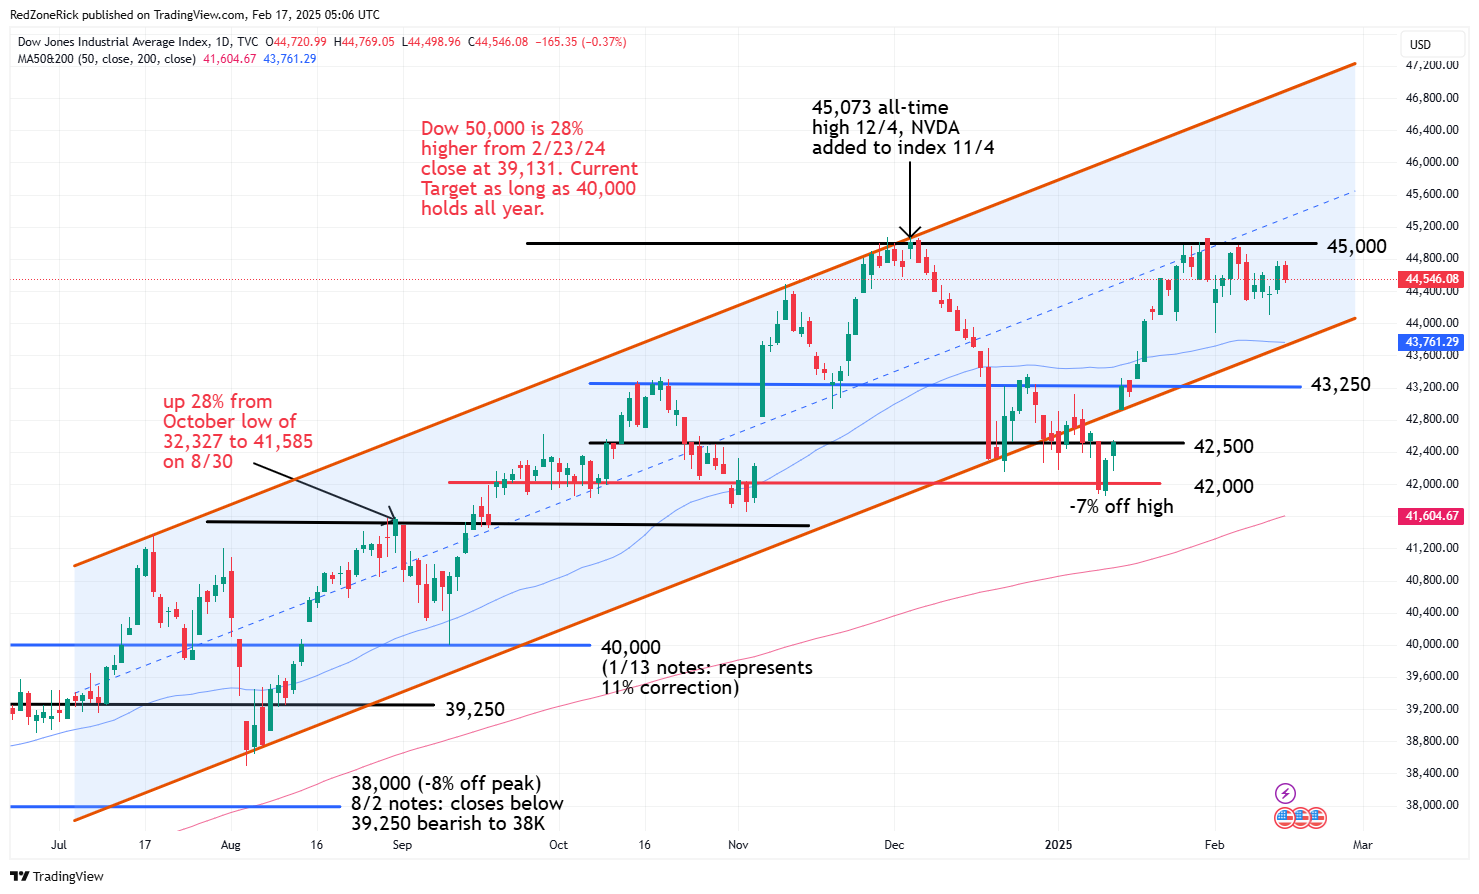
- The Dow tagged a low of 44,498 before closing at 44,546 (-0.4%). Support at 44,500 held. Resistance is at 45,000.
Earnings and Economic News
Before the open: None
After the close: Huntsman (HUN), Noble (NE), Transocean (RIG), Otter Tail (OTTR)
Economic News
Market Closed
Technical Outlook and Market Thoughts
Once again, there was some dip buying mid-week at key support levels that helped save the major indexes from possibly testing lows from earlier this month. The technical chart work also showed the impressive bounces to get fresh all-time highs back in focus on the Nasdaq and the S&P. The Dow and the Russell are lagging but also remain within striking distance of record highs.
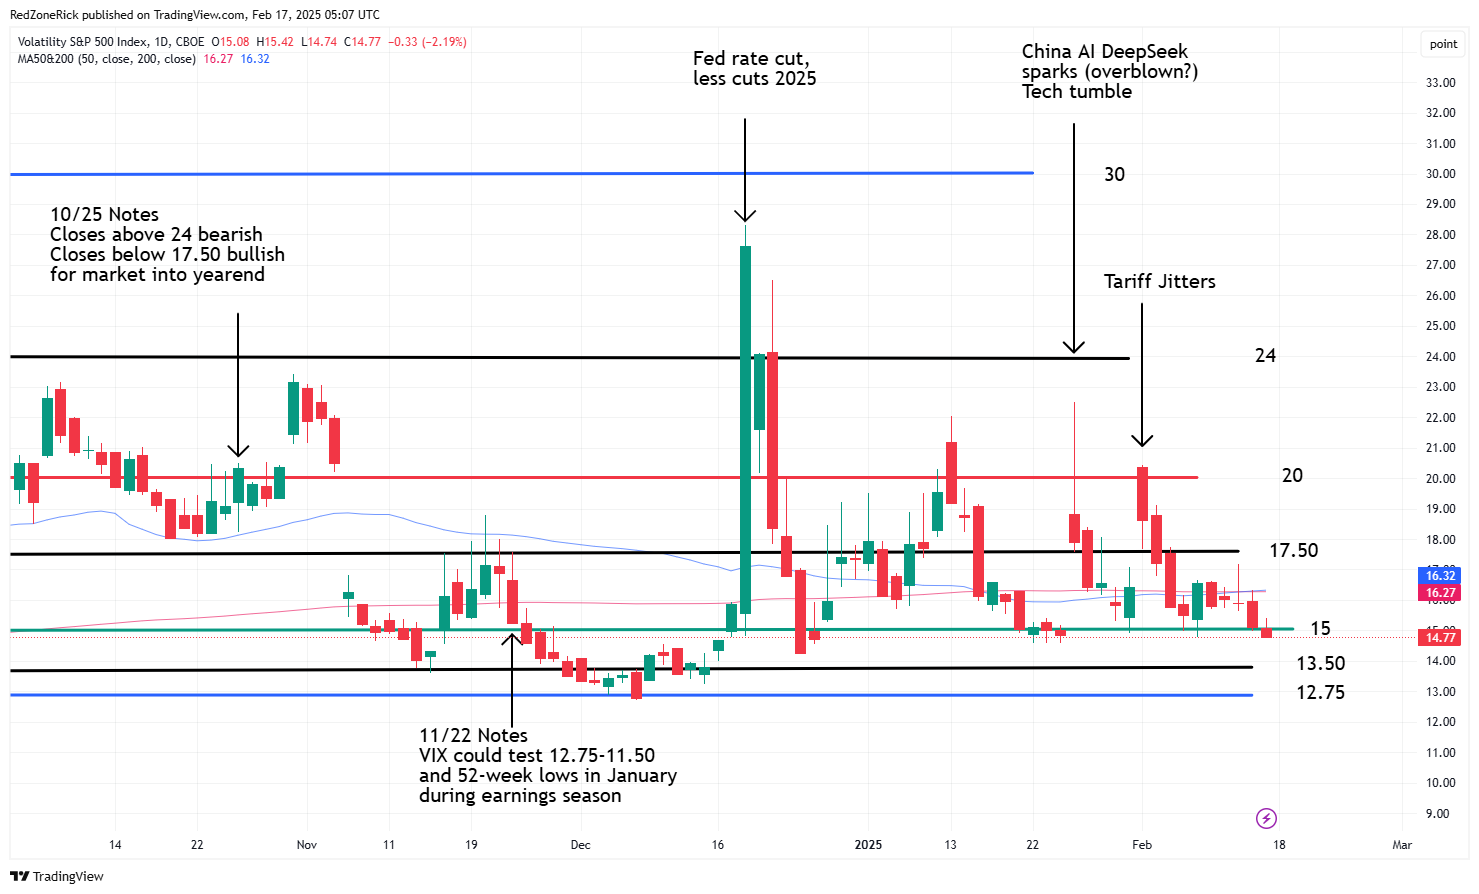
The most important development on Friday showed volatility easing while pushing the January lows. The Volatility Index (VIX) closed below key support at 15 for just the second time this year. Continued closes below this level would be bullish for the market with additional weakness towards 13.50-12.75 and December lows.
Lowered resistance is at 16.50 and the 200-day and 50-day moving averages with the latter closing above the former. This is typically known as a golden cross that signals higher highs down the road and would be bearish for the market. Lower lows would reverse this setup and why the bulls need to hold 15 throughout the upcoming week. Additional resistance is at 17.50.
The Nasdaq recovered its 50-day moving average on Thursday while clearing key resistance at 19,750. Friday’s close above 20,000 gets 20,250-20,500 in play with the December 16th all-time high at 20,204.
Rising but shaky support is at 19,500 which represents the bottom of the uptrend channel. A drop below 19,250 would indicate a possible near-term top with weakness towards 19,000-18,750.
The S&P came within a point of topping its January 24th all-time high at 6,128 following Thursday’s breakout above key resistance at 6,100. Continued closes above this level would signal upside towards 6,200-6,250 and the middle of the current uptrend channel.
Support is at 6,050-6,000 and the 50-day moving average. A drop below the latter and out of the uptrend channel would imply a further slide to 5,950-5,900.
The Dow’s has remained in a 1,000-point range between 44,000-45,000 since January 23rd, or 18 trading sessions. Resistance is at 44,750-45,000. There is breakout potential towards 45,500-46,000 and the middle of the current uptrend channel on multiple closes above 45,000 and the December 4th all-time top at 45,073.
Support is at 44,250-44,000 with backup help at 43,750 and the 50-day moving average. A close below 43,500 and out of the current uptrend channel could lead to a retest to 43,250.
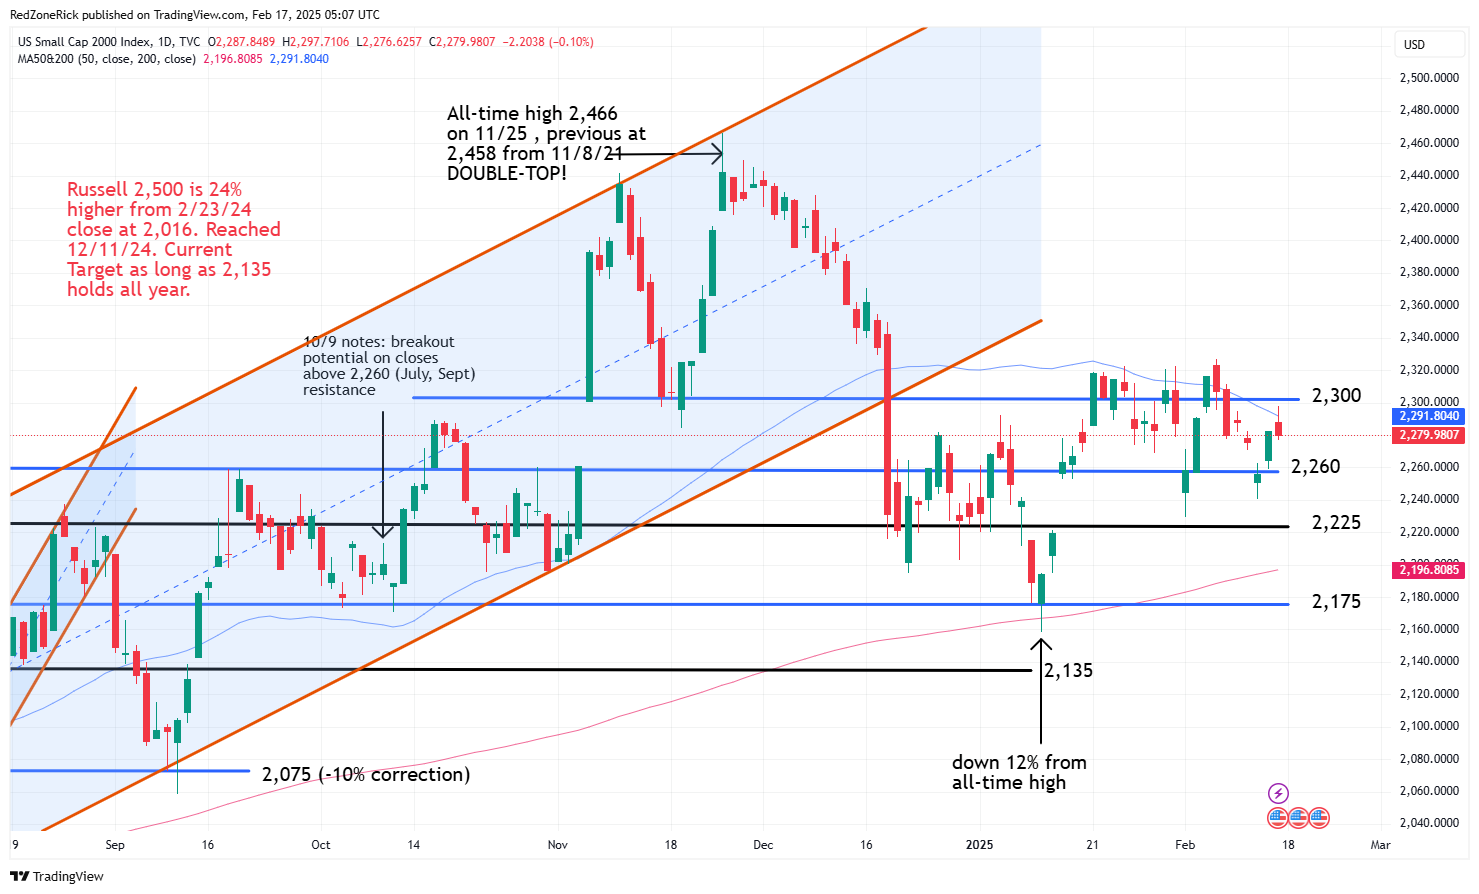
The Russell 2000 tested a high of 2,297 with key resistance at 2,300 holding. The 50-day moving average continues to rollover and has been a hassle since the December 18th close below this level. A breakout above 2,325 could lead to a fear-of-missing-out moment.
Key support is at 2,260 followed by 2,225-2,200 and the 200-day moving average.
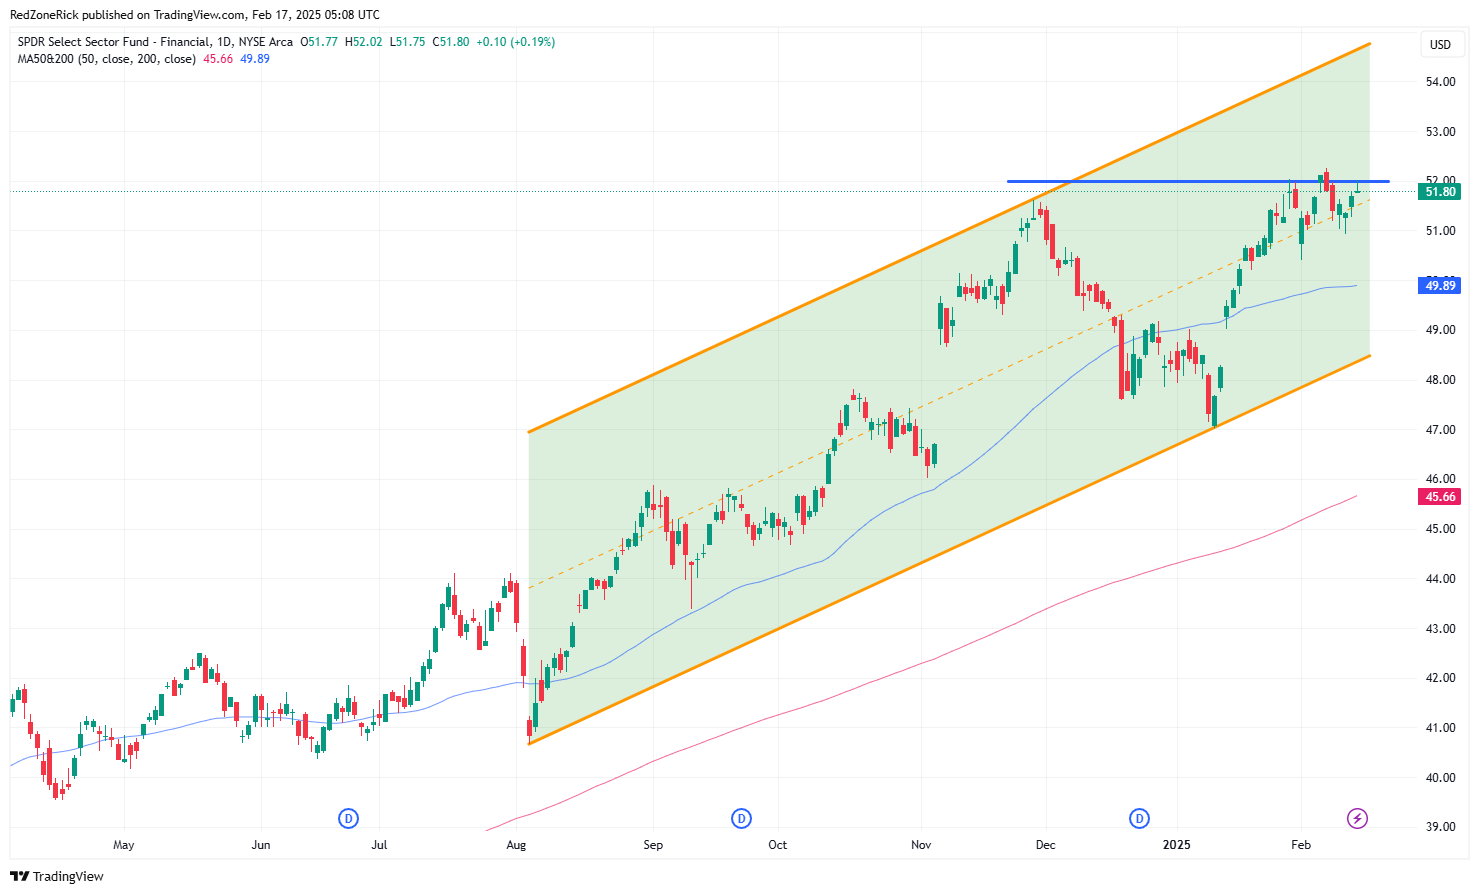
The Financial sector is showing signs of breaking out with the Spider Select Financial Sector Fund (XLF) clearing $52 on Friday. The record high from earlier this month is at $52.26. The top of the current uptrend channel off the August low is showing a near-term price target of $55.
Key support levels are at $51 followed by $50 and the 50-day moving average. The XLF April 55 calls (XLF250417C00055000) closed at 25 cents and traded over 16,000 contracts versus open interest of 6,800 on Friday. This is suggesting traders are positioning for a move towards double-nickels by mid-April.
Other financial stocks are also showing signs of breaking out to record highs and a sector breakout could be a rising tide that lifts all boats.
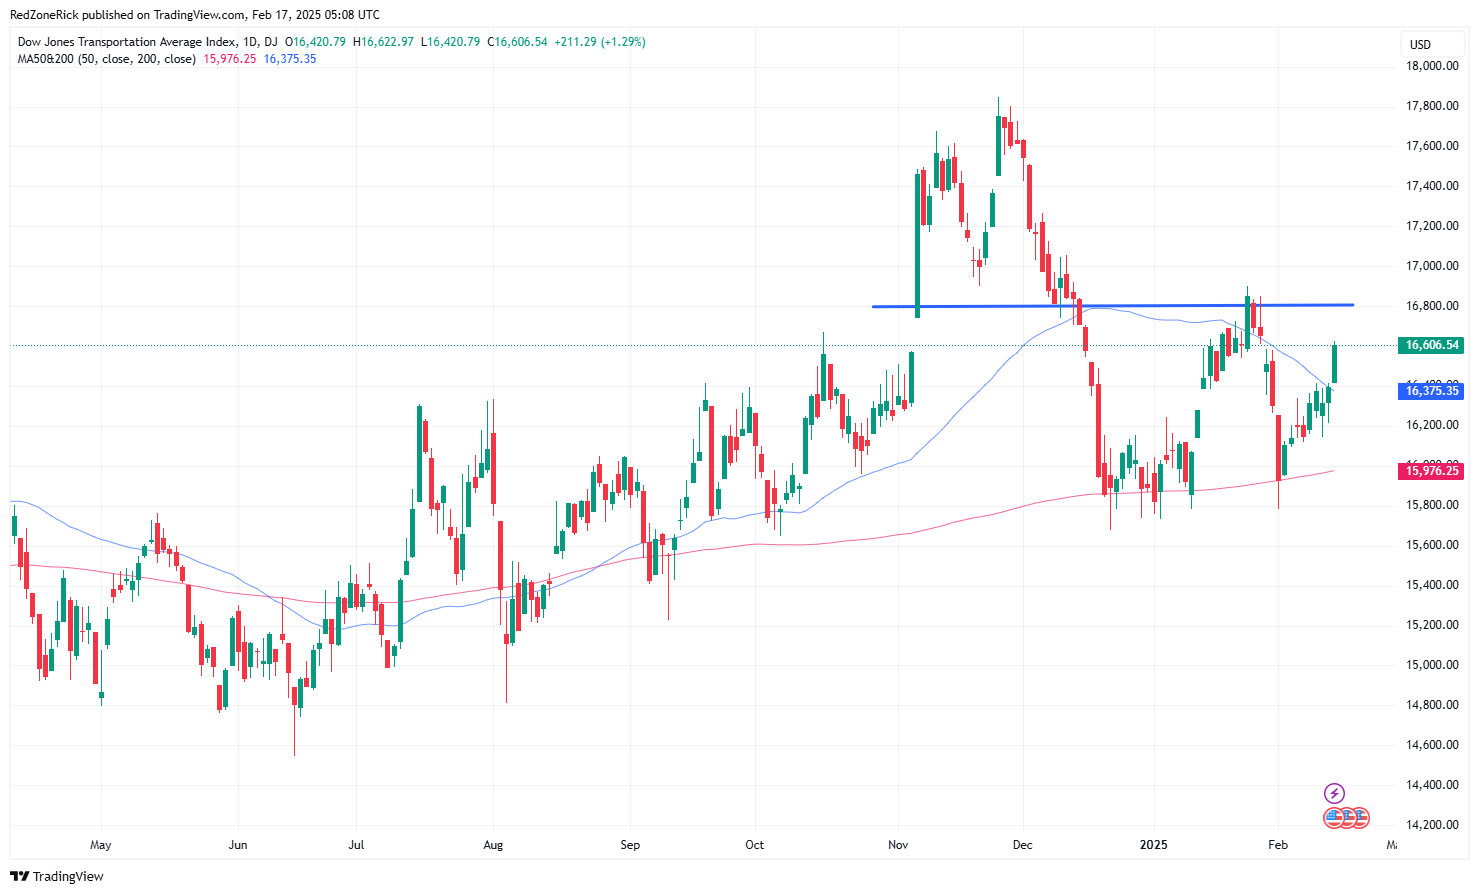
The Transportation sector is also worth watching after the Dow Jones Transportation Average Index (DJT) reclaimed its 50-day moving average on Friday. Continues closes above key resistance at 16,800 would be a more bullish development. Key support at 15,800 and the 200-day moving average has been holding since mid-December.