

Volatility Remains Elevated
8:00am (EST)
Wall Street did a little dip buying on Wednesday with the major indexes remaining in oversold territory. Tech showed the most strength but the blue-chips slacked to keep a bit of uncertainty in play for a near-term bottom forming.
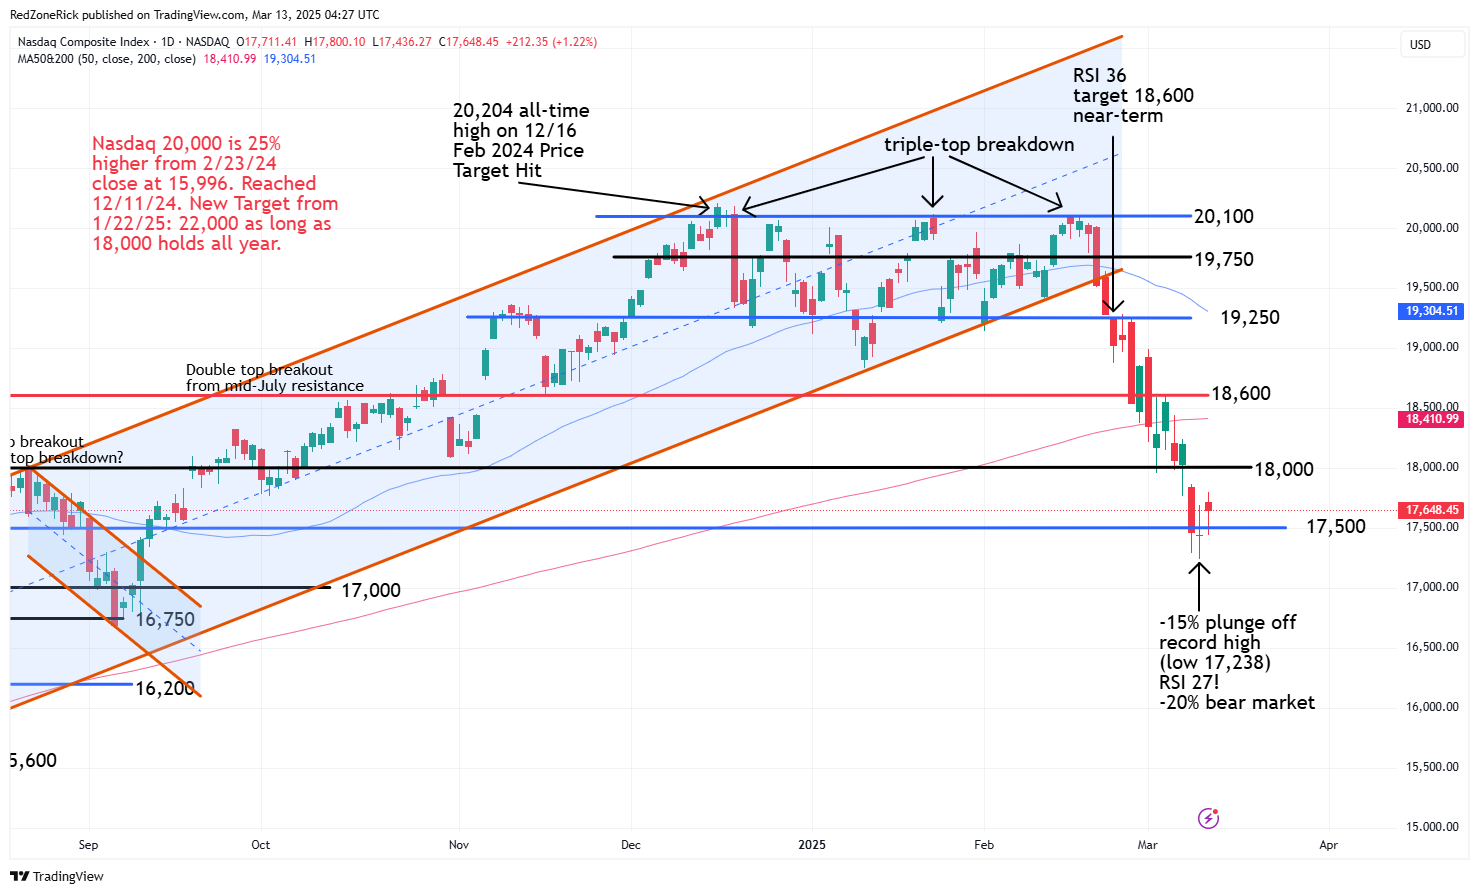
The Nasdaq traded up to 17,800 while ending at 17,648 (+1.2%). New resistance at 17,750 was cleared but held. Key support is at 17,500.
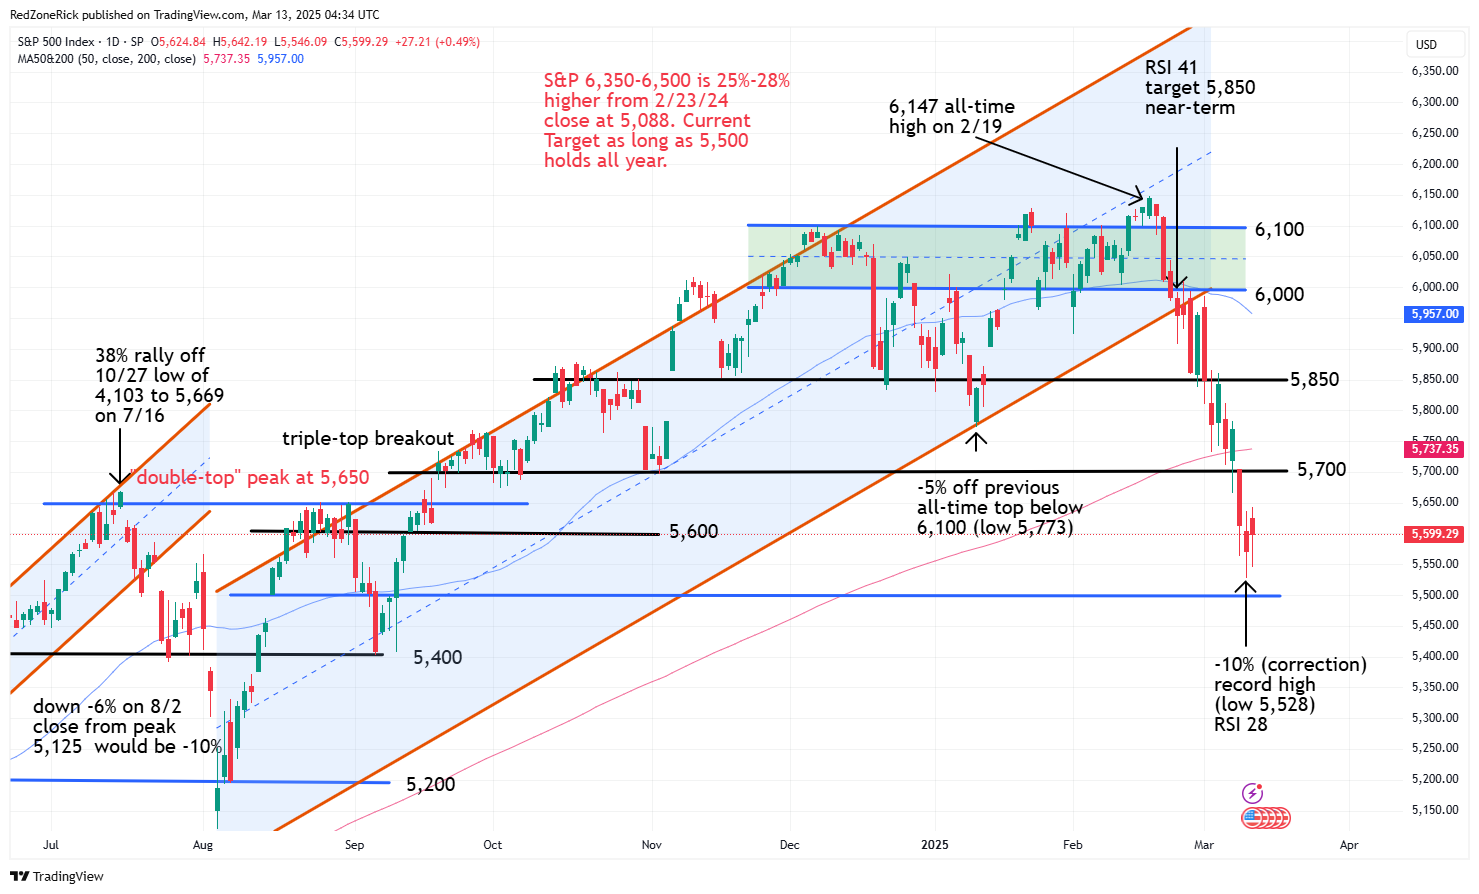
The S&P 500 closed at 5,599 (+0.5%) after making a run to 5,642. Fresh resistance at 5,650 held. Key support is at 5,550.
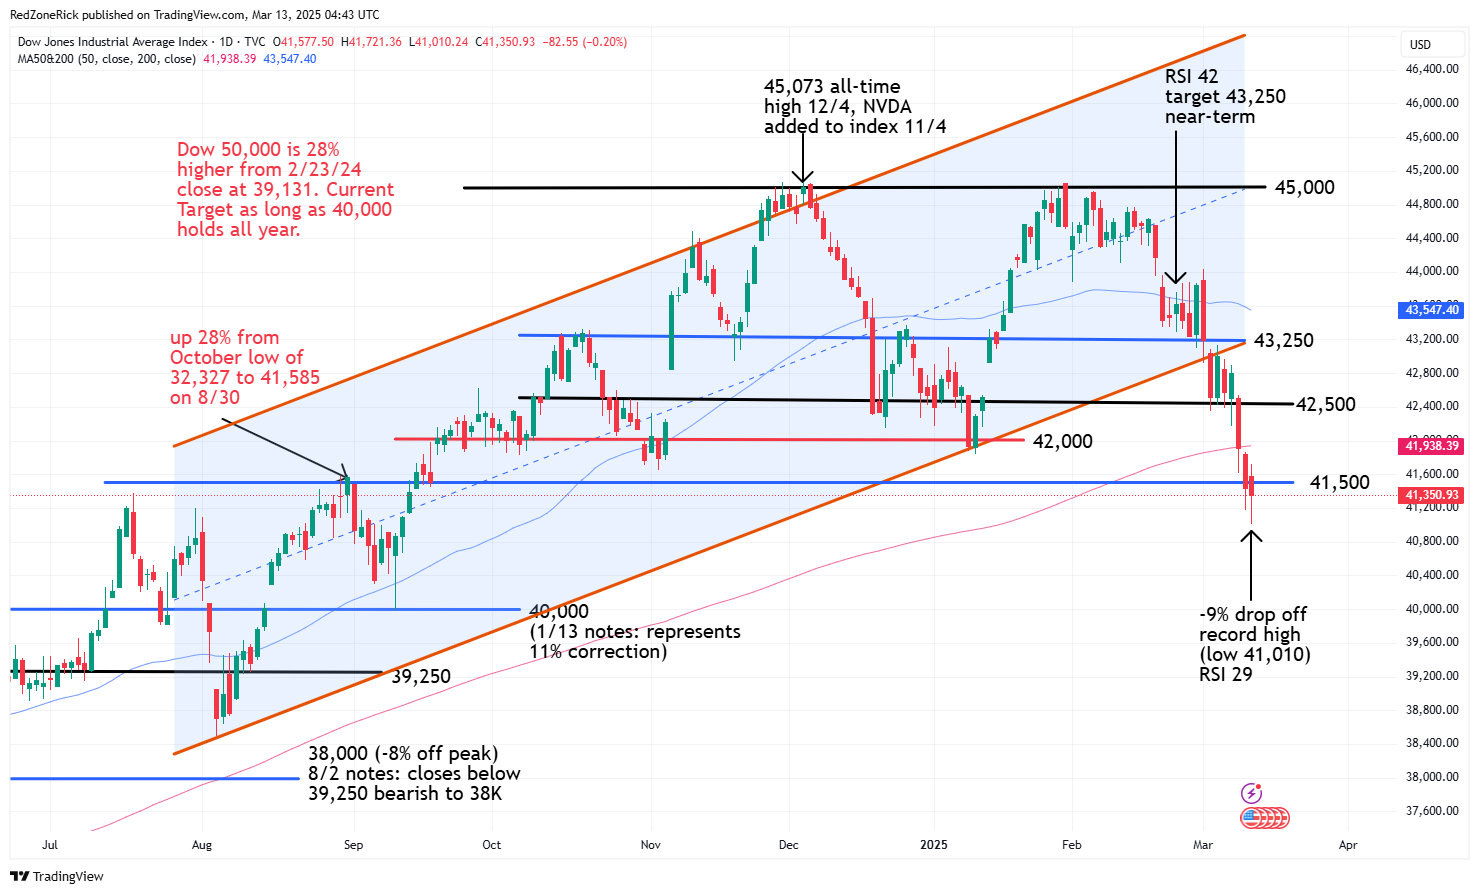
The Dow tested a low of 41,010 before settling at 41,350 (-0.2%). Support at 41,000 was approached and held. Key resistance is at 42,000.
Earnings and Economic News
Before the open: Dollar General (DG), Futu Holdings (FUTU), Weibo (WB)
After the close: Ballard Power (BLDP), Crown Castle (CCI), DocuSign (DOCU), PagerDuty (PD), ULTA Beauty (ULTA)
Economic news:
Initial Jobless Claims – 8:30am
Producer Price Index – 8:30am
Technical Outlook and Market Thoughts
The major indexes made lower lows to start the week with Tuesday’s bottom nearly pushing the small-caps into bear market territory. The backup support levels we highlighted to start the week came into play and we will just have to see how the rest of the week unfolds.
If the bulls can hold near-term support levels and avoid lower lows that will be a start. Secondly, we would like to see volatility hit lower lows into an up day for the market to close out Friday.
The Nasdaq tested an intraday low of 17,238 on Tuesday which represented a 15% plunge from its December 16th all-time high at 20,204. Backup and upper support at 17,500-17,000 failed to hold. A close below the latter would indicate additional weakness towards 16,750-16,500 with the latter representing a 18% selloff. A correction of 20% would occur at 16,250.
Lowered and key resistance is at 18,000 following Monday’s close below this level. Closes back above 18,600 and the 200-day moving average would indicate a possible near-term bottom. Tuesday’s RSI on the Nasdaq hit 27 and very oversold levels.
The S&P tagged a 10% selloff from the February 19th record high at 6,147 following Tuesday’s fade to 5,528. Key support from mid-September at 5,500 held. A move below this level would imply a further slide to 5,400-5,200. The latter would represent a 15% drubbing from the all-time high. RSI was at 28 on Tuesday’s close and recovered 30 on Wednesday.
Lowered resistance is at 5,700-5,750 and the 200-day moving average. Continued closes above 5,850 would be a more bullish signal for the index.
The Dow failed to hold prior and key support from mid-September at 41,500 on Tuesday and failed to recover and hold this level on Wednesday’s intraday strength. There is risk down to 40,000 on continued closes below this level. If reached, it would represent an 11% pounding from the all-time high of 45,073 from November 4th.
Key and lowered resistance is at 42,000 and the 200-day moving average followed by 42,500. RSI closed at 29 on Wednesday for the index.
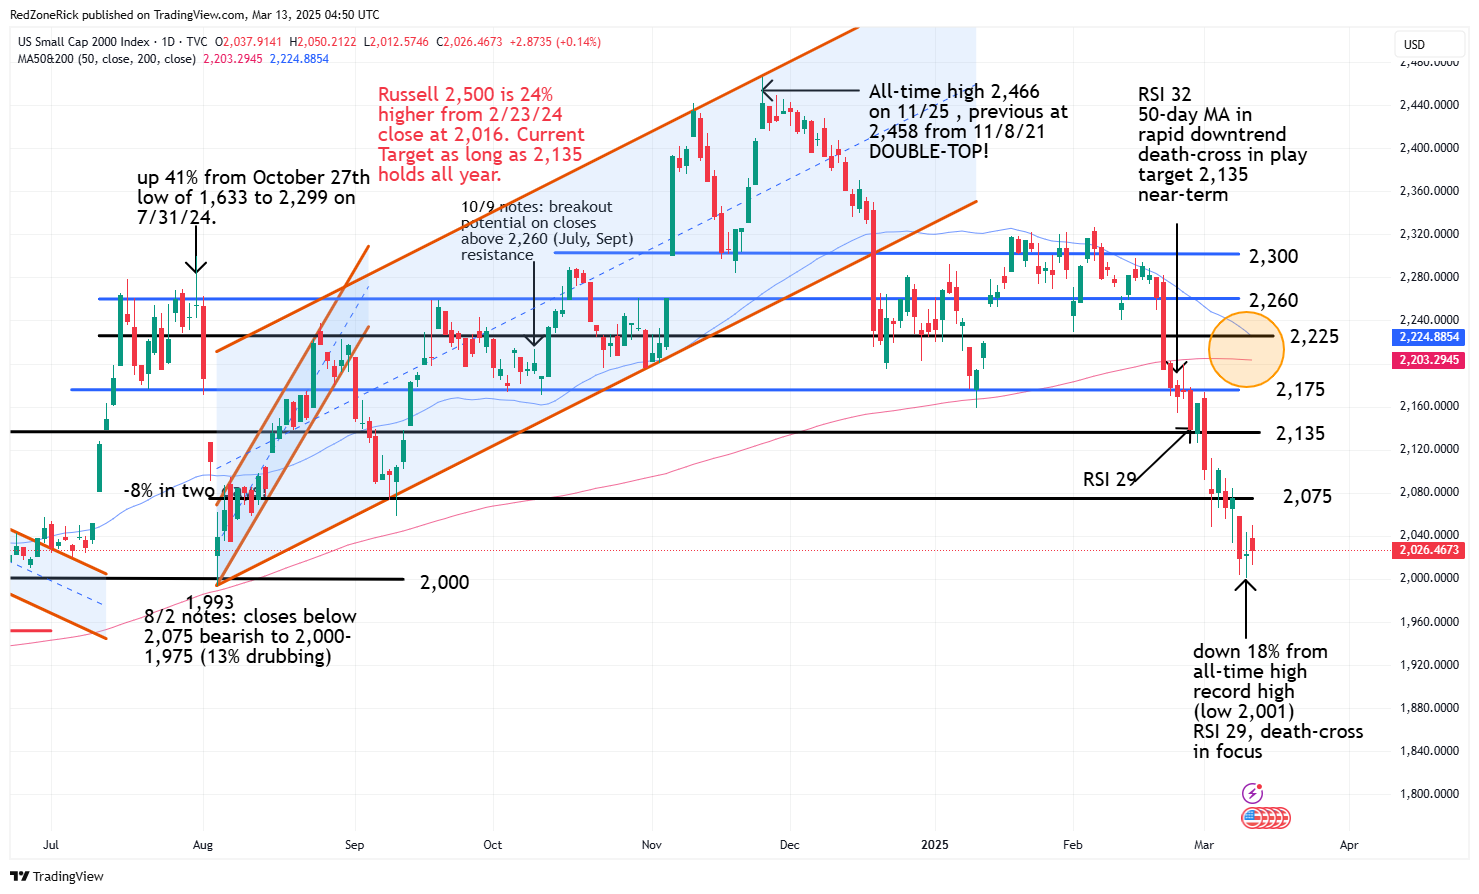
The Russell 2000 was down 19% intraday from its all-time record high of 2,466 on Tuesday’s intraday low at 2,001. A move below 2,000 and the August 5th low at 1,993 would likely get 1,975 in focus and bear market territory.
Key and lowered resistance is 2,075 following Monday’s close back below this level. Additional hurdles are at 2,135-2,175. A death-cross remains in focus near the 2,200 level and is a bearish development for lower lows.
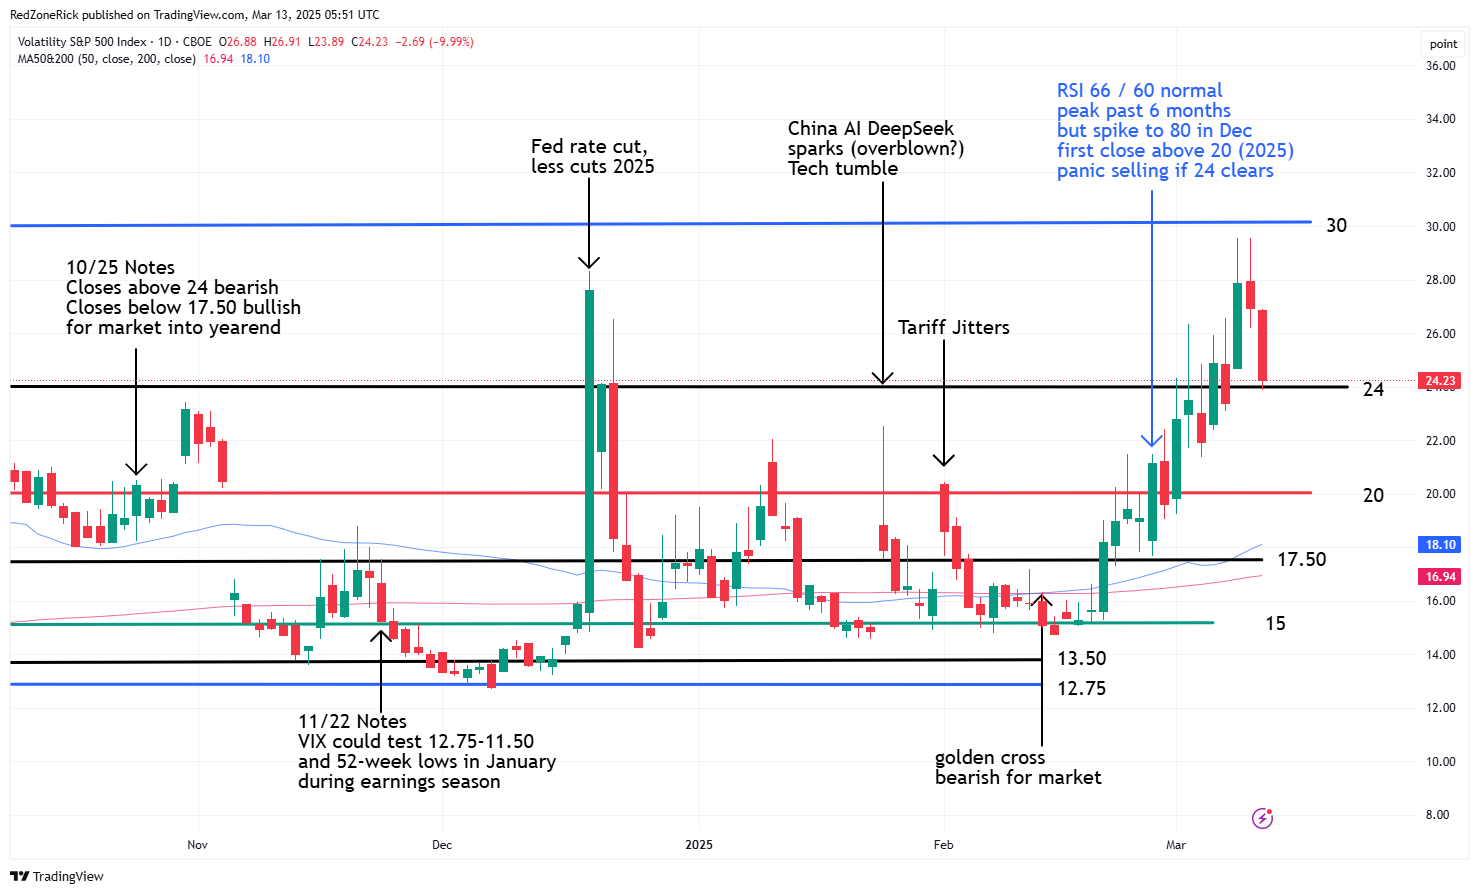
The Volatility Index (VIX) continues to give some of the best market clues as far as near-term direction with Monday and Tuesday’s peaks at 29.56 and 29.57. Key resistance at 30 held and a level we said if cleared could induce “blood-in-the-streets” selling pressure. It is too early to say this is a near-term double-top but it looks bullish for the market.
We wanted to see a close below 24 on Wednesday with the intraday low kissing 23.89. If recovered by the weekend, the next levels of support are at 22.50-20.
We have tried to remain active during the month-long downdraft and we have been very selective at adding New Alerts. We still need to see if a near-term bottom starts to form to end this week and one that stretched into next week.
Up Friday’s and Monday’s typically suggests money is moving into or staying in the market. Negative Friday’s and Monday’s imply money is moving to the sidelines or out of the market.