Lira Down 40% in 2018, U.S. Sanctions on Russia Hurt Ruble
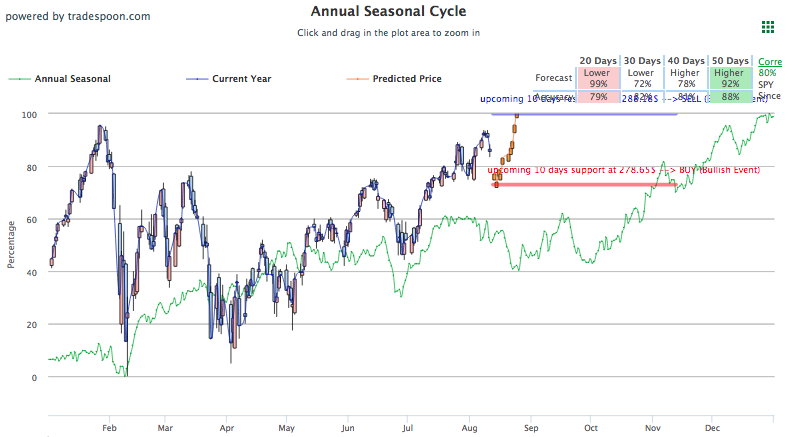
After flirting with all-time lows for most of the summer, the Turkish currency, lira, hit historic lows on Friday, and trader even lower today, which propelled the dollar and other haven currencies and commodities higher. Similarly trending downward is the Russian ruble, which has hit two-year lows amid new U.S. sanctions. Though neither nation does a significant-enough amount of business with the U.S. to severely influence U.S. assets, all three major U.S. indices were slightly down today. As long as the market trades below 52-week high, the market should be considered overbought. With this in mind, investors should look to hedge on long positions. Seasonal Charts, shown below for SPY, offer traders 20, 30, 40, and50-day probabilities, which are good for spotting optimal entry and exit positions on those long-term hedges.
The lira crash on Friday spelled one of the worst trading days for the Dow this summer and is currently on track for its fifth straight day of losses. Today, Turkey central bank announced it will provide “all the liquidity” banks need. Turkish banks were also granted permission to borrow foreign exchanges deposits from the central bank, however, interest rates have not changed. On Friday, the exchange rate for one dollar to lira was at 6.4275, even reaching 7.13 at one point; while today the lira is going at 6.8275. The dollar saw nice gains from this as it, along with the Japanese yen and Swedish krona, continue trading higher. The ruble, however, has been struggling.
New U.S. sanctions on Russia caused the rubble to drop 2% today; coupled with Friday’s losses, the ruble has been strongly trending down. The newest sanctions come as a response to the chemical attack on former Russian intelligence officer and his daughter that took place earlier this year in England. Congress is also preparing sanctions for Russia’s role in the 2016 U.S. presidential election interference.
More earnings will be released this week, though fewer than the last few weeks as earnings season is winding down. Look for Macy’s, Wal Mart, Home Depot, among others, to report this week, as well as a retail report set to be released Wednesday.
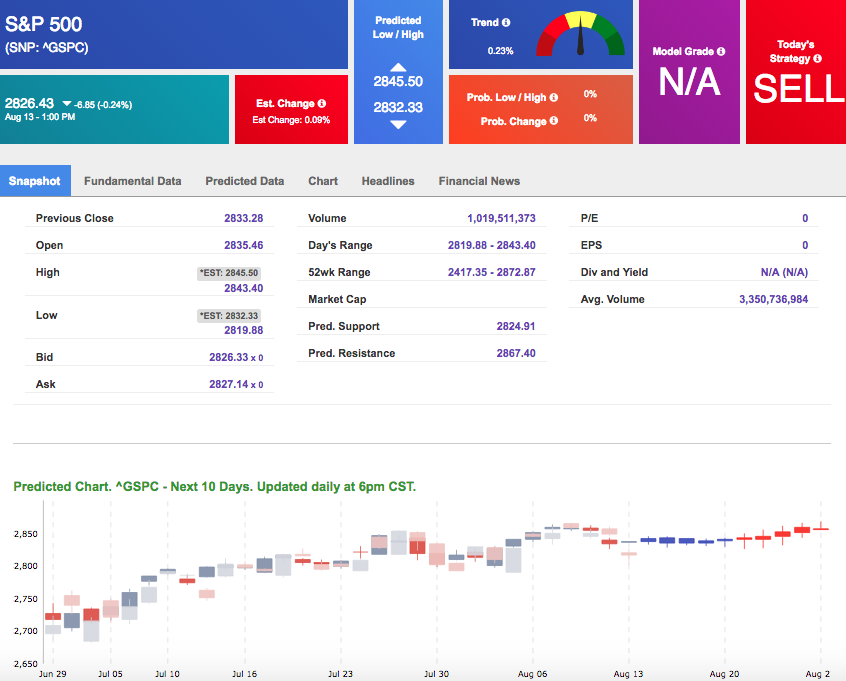
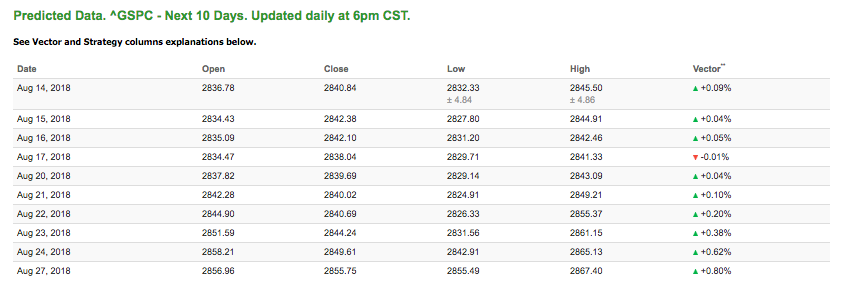
Using the ^GSPC symbol to analyze the S&P 500, our 10-day prediction window shows mixed signals. Today’s vector figure of +0.62% moves to -0.04% in five trading sessions. The predicted close for tomorrow is 2,869.20. Prediction data is uploaded after market close at 6 p.m., CST. Today’s data is based on market signals from the previous trading session.
Highlight of a Recent Winning Trade
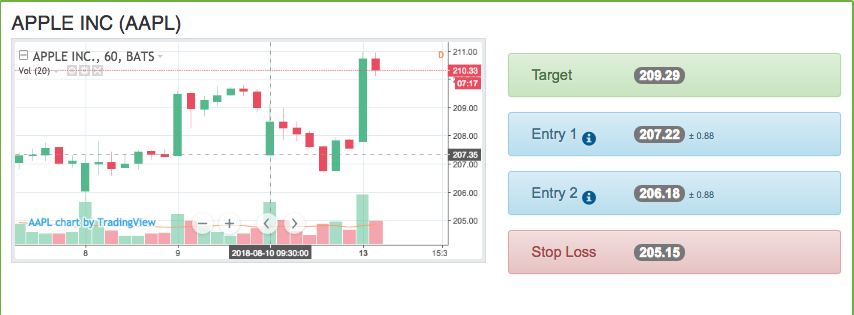
On August 10th, our ActiveTrader service produced a bullish recommendation for Apple Inc (AAPL). ActiveTrader is included in all paid Tradespoon membership plans and is designed for intraday trading.
Trade Breakdown
AAPL opened within Entry 1 price range of $207.22 (± 0.88) and moved through its Target price of $209.29 , the following trading session, within the first hour of trading, reaching a high of $210.70. The Stop Loss was set at $205.15.
Live Trading Room Update
Click here to see how we traded in volatile conditions and what you might expect in our next Live Trading Room. During recent volatility, we held Live Trading Room Session, on August 9th, where our winning trades ranged 8.16% to over 122% ROI!
Symbol Net Gain%
| TJX | 8.16% |
| ALL | 50.00% |
| ES | 9.37% |
| TJX | 122.22% |
| PH | 20.83% |
| XLY | 29.31% |
Tuesday Morning Featured Stock
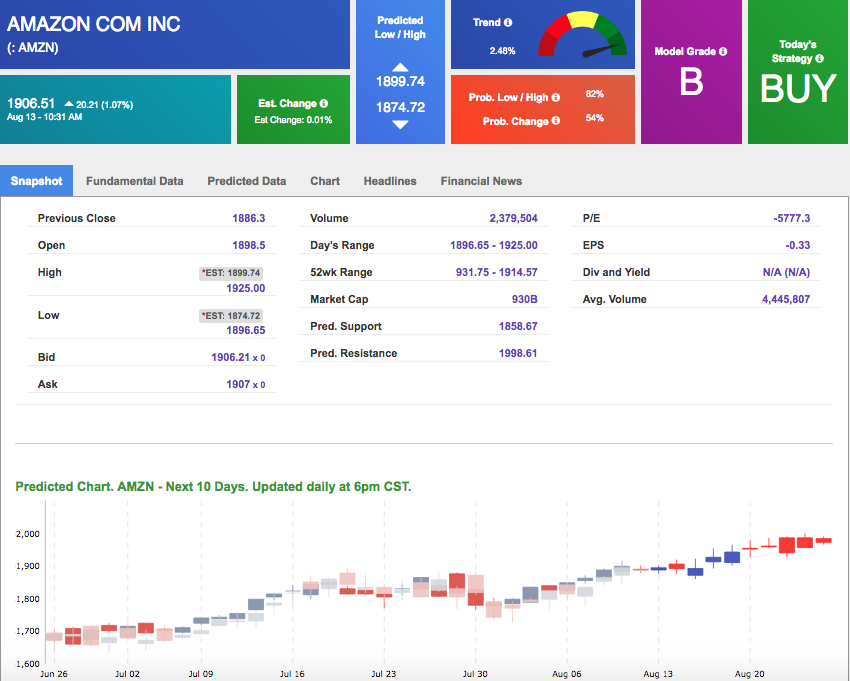
Our featured stock for Tuesday is Amazon.com Inc(AMZN). AMZN is showing a confident vector trend in our Stock Forecast Toolbox’s 10-day forecast. This stock is assigned a Model Grade of (B) indicating it ranks in the top 25th percentile for accuracy for predicted support and resistance, relative to our entire data universe.
*Please note: Our featured stock is part of your free subscription service. It is not included in any paid Tradespoon subscription service. Vlad Karpel only trades his own personal money in paid subscription services. If you are a paid subscriber, please review your Premium Member Picks, ActiveTrader or ActiveInvestor recommendations. If you are interested in receiving Vlad’s personal picks, please click here.
The stock is trading at $1906.51 at the time of publication, up 1.07% from the open with a +0.01% vector figure.
Tuesday’s prediction shows an open price of $1905.35, a low of $1875.50 and a high of $1918.27.
Prediction data is uploaded after market close at 6 p.m., CST. Today’s data is based on market signals from the previous trading session.
Note: The Vector column calculates the change of the Forecasted Average Price for next trading session relative to the average of actual prices for last trading session. The column shows expected average price movement “Up or Down”, in percent. Trend traders should trade along the predicted direction of the Vector. The higher the value of the Vector the higher its momentum.
ALL-NEW
Breakthrough, mind-boggling, high-tech Artificial Intelligence platform available to Tradespoon’s individual investors:
Click Here – To See Where AI Places My Money
Oil
West Texas Intermediate for September delivery (CLU8) is priced at $66.93 per barrel, down 0.99% from the open, at the time of publication. After closing higher on Friday amid rising global crude demand and trade concerns, oil traded lower today as the International Energy Agency raised its forecast for global oil demand in 2019.
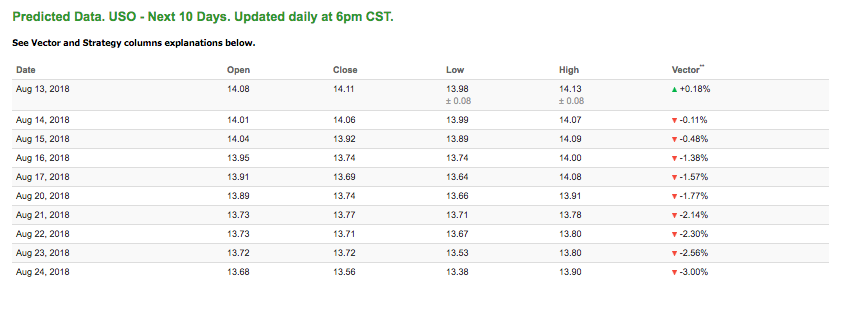
Looking at USO, a crude oil tracker, our 10-day prediction model mostly all negative signals. The fund is trading at $13.8 at the time of publication, down 1.99% from the open. Vector figures show 0.18% today, which turns -0.48% in two trading sessions. Prediction data is uploaded after market close at 6 p.m., CST. Today’s data is based on market signals from the previous trading session.
Gold
With the Lira crisis, the dollar continues to make gains which pushes gold lower. The dollar is up nearly 2% off the Lira’s struggles today, which is nearing a 10% for the Turkish currency. The price for December gold (GCZ8) is down 1.51% at $1,200.60 at the time of publication.
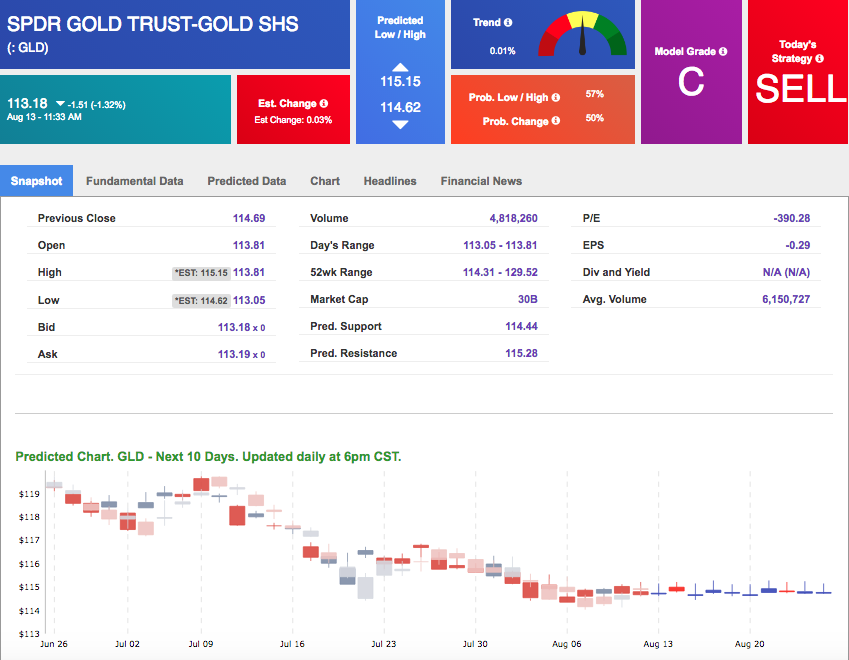
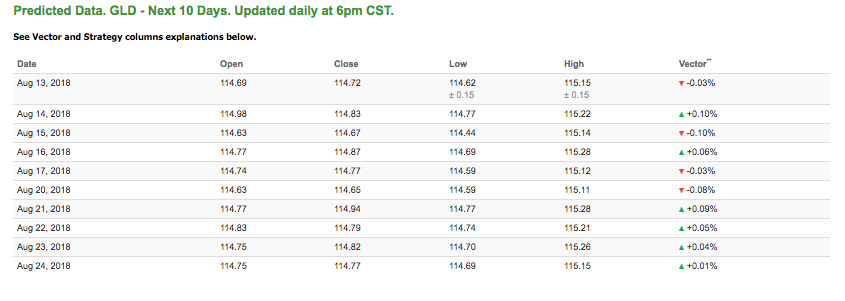
Using SPDR GOLD TRUST (GLD) as a tracker in our Stock Forecast Tool, the 10-day prediction window shows mixed signals. The gold proxy is trading at $113.18, up down 1.32% at the time of publication. Vector signals show -0.03% for today. Prediction data is uploaded after market close at 6 p.m., CST. Today’s data is based on market signals from the previous trading session.
Treasuries
Unlike the dollar, turmoil in Turkey has pushed longer-dated bonds lower, nearing multi-month lows. As treasury note yields lower, note prices increases. The yield on the 10-year Treasury note is down 2.16% at 2.87% at the time of publication. The yield on the 30-year Treasury note is down 1.18% at 3.04% at the time of publication.
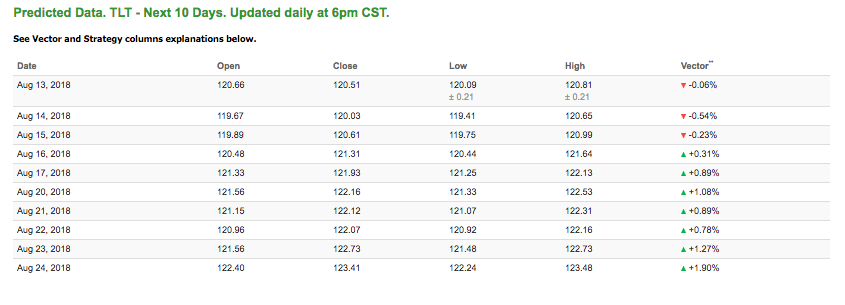
Using the iShares 20+ Year Treasury Bond ETF (TLT) as a proxy for bond prices in our Stock Forecast Tool, we see mixed signals in our 10-day prediction window. Today’s vector of -0.06% moves to +0.31% in three sessions. Prediction data is uploaded after market close at 6 p.m., CST. Today’s data is based on market signals from the previous trading session.
Volatility
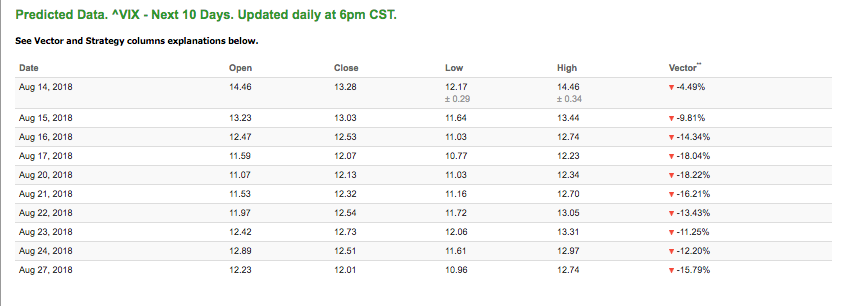
The CBOE Volatility Index (^VIX) is up 9.88% at $14.46 at the time of publication, and our 10-day prediction window shows all negative signals. The predicted close for tomorrow is $13.03 with a vector of -9.61%. Prediction data is uploaded after market close at 6 p.m., CST. Today’s data is based on market signals from the previous trading session.
