

Bears Regain Momentum on False Breakout
Wall Street had a nasty Friday as disappointing economic news weighed on sentiment and reversed the weekly gains into losses. Specifically, consumer sentiment missed forecasts while the personal consumption expenditures price index, a key Fed inflation measure, checked in higher than expected.
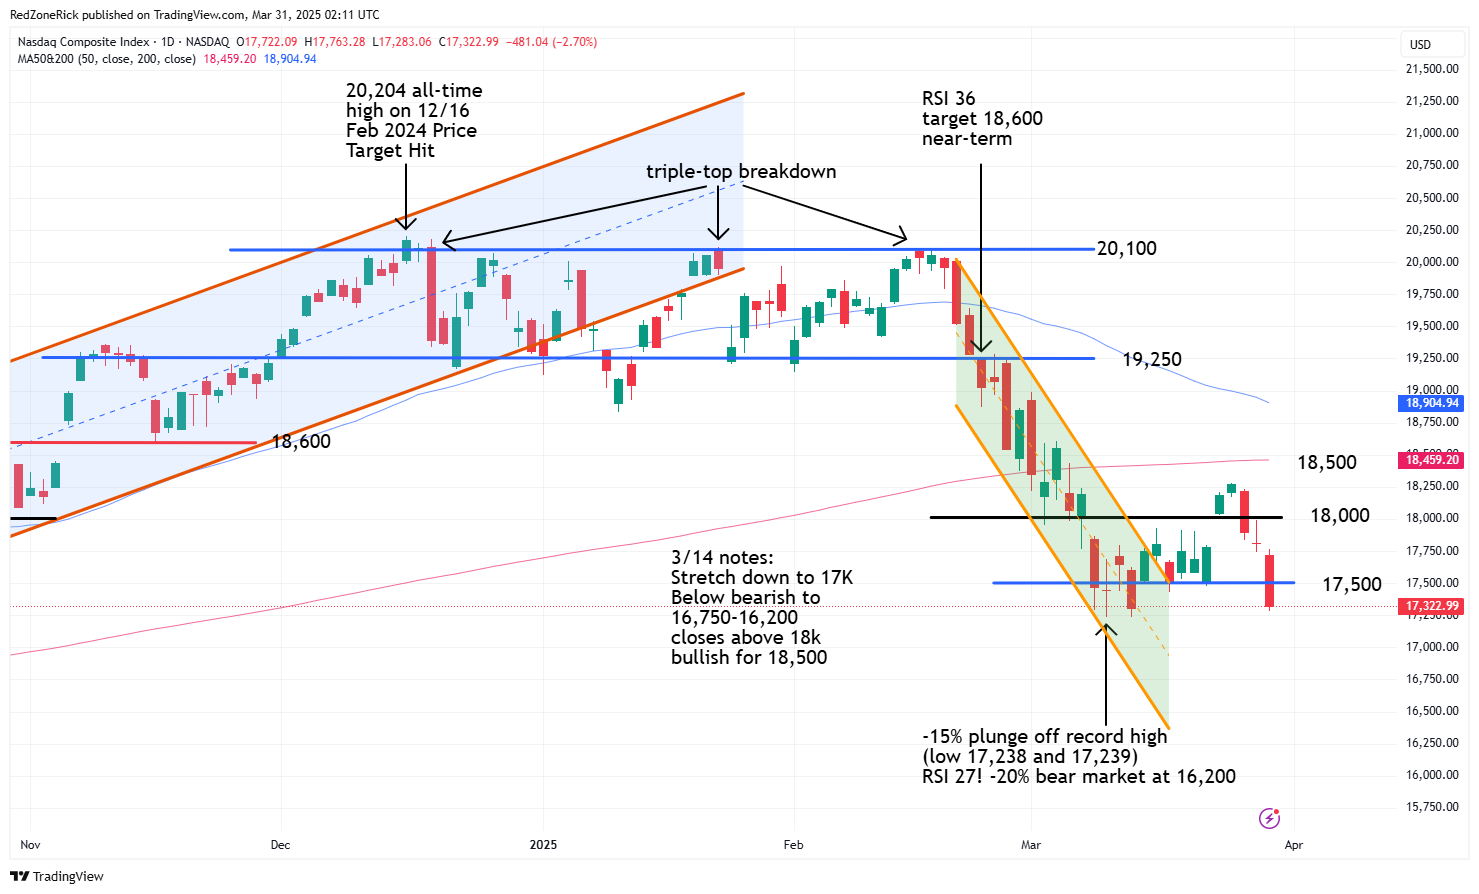
The Nasdaq ended at 17,322 (-2.7%) with the low at 17,283. Critical support at 17,250 held. Resistance is at 17,500.
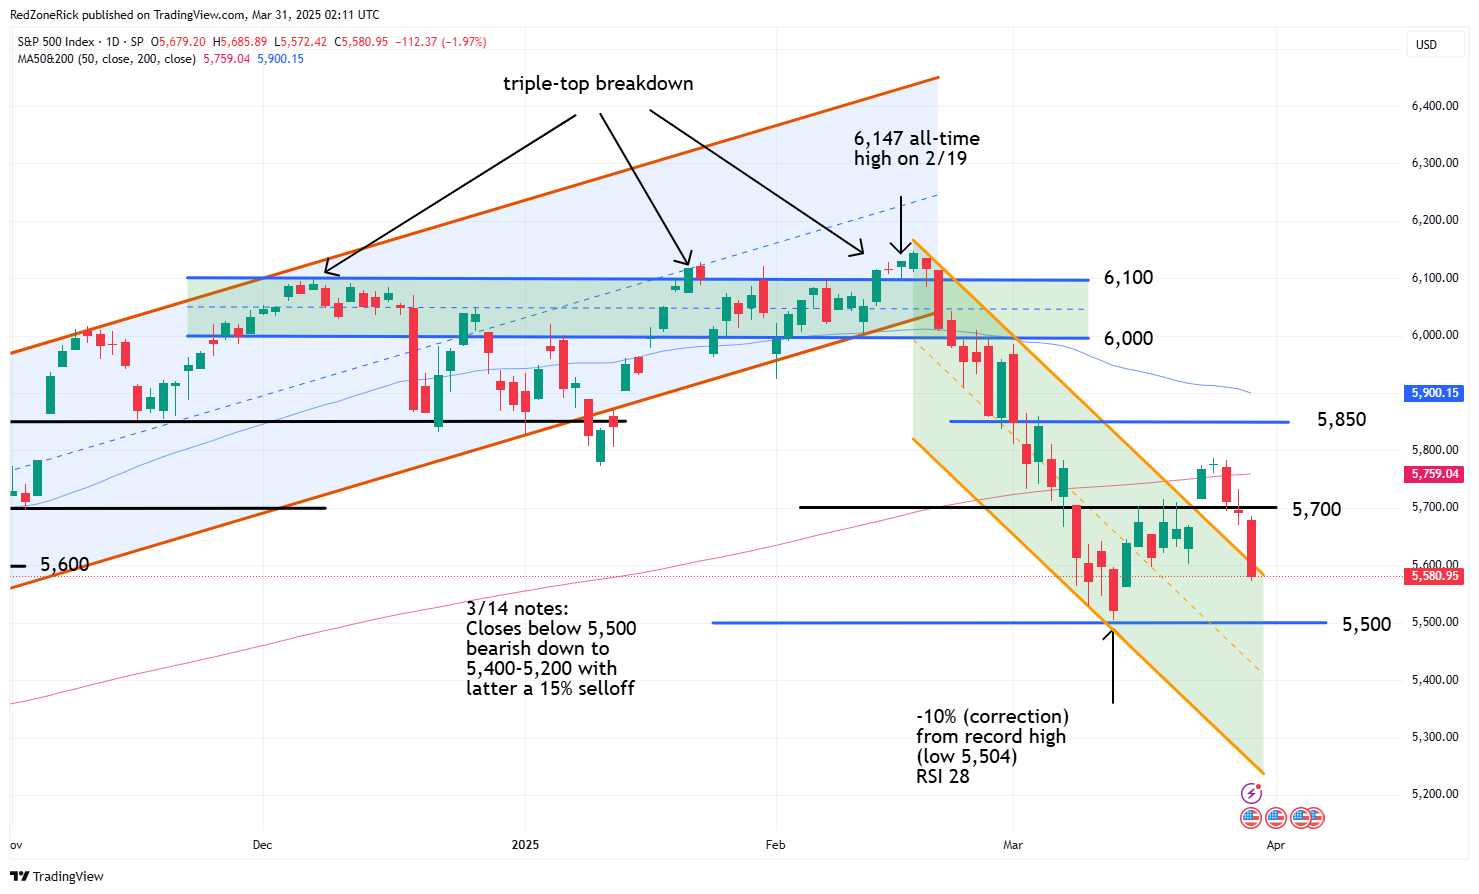
The S&P 500 sank down to 5,572 before settling at 5,580 (-2%). Support at 5,600 failed to hold. Resistance is at 5,700.
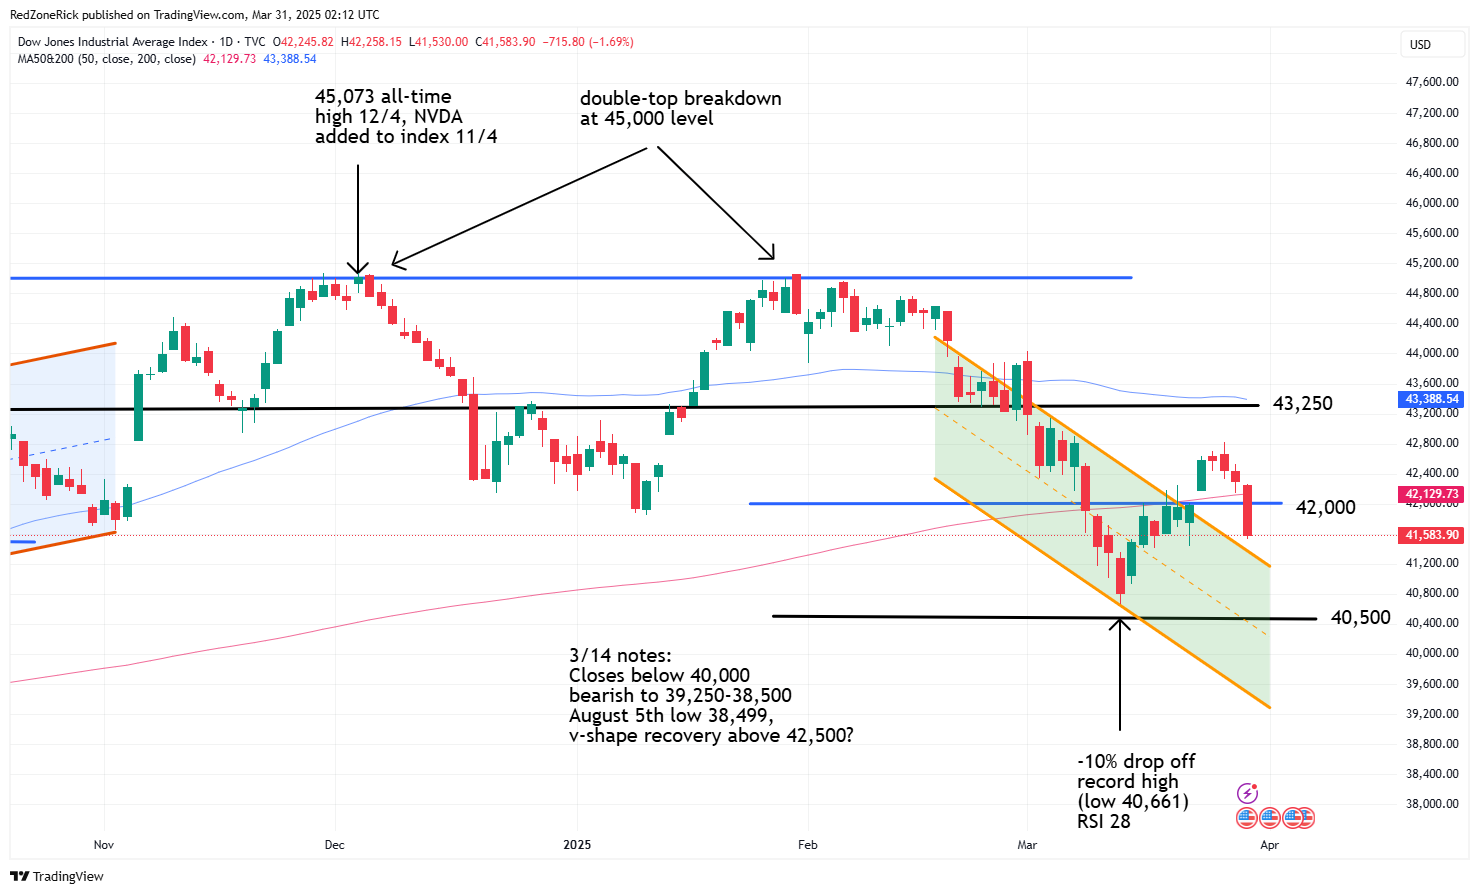
The Dow closed at 41,583 (-1.7%) following the late day fade to 41,530. Support at 41,500 held. Resistance is at 42,000.
Earnings and Economic News
Before the open: FTC Solar (FTCI), Nano-X Imaging (NNOX), Workhorse Group (WKHS)
After the close: Open Lending (LPRO), Progress Software (PRGS), Red Cat Holdings (RCAT), TechTarget (TTGT)
Economic News
Chicago Business Barometer (PMI) – 9:45am
Technical Outlook and Market Thoughts
For the week, the Nasdaq sank 2.6%; the S&P 500 fell 1.53%; the Dow dropped 1%, and the Russell was off 1.2%. The breakdown from the prior week’s rebound proved to be a false rally or an extended dead cat bounce but the charts and volatility warned of a stalled rally midweek.
The weakness on Thursday pushed the Dow towards its 200-day moving average and the S&P below 5,700. The Nasdaq and the Russell also made lower lows and these events were an omen to Friday’s pullback. It is not uncommon for prior resistance to be tested as support immediately after a breakout. However, failure to hold these levels might suggest a false breakout and exactly what we saw.
The breakdowns in the Nasdaq and the Russell are once again pushing prior support levels from earlier this month with a good chance fresh 2025 lows return. The Dow and the S&P have some wiggle room but their failure to hold key resistance has the 50-day moving averages back in a downtrend. Not good.
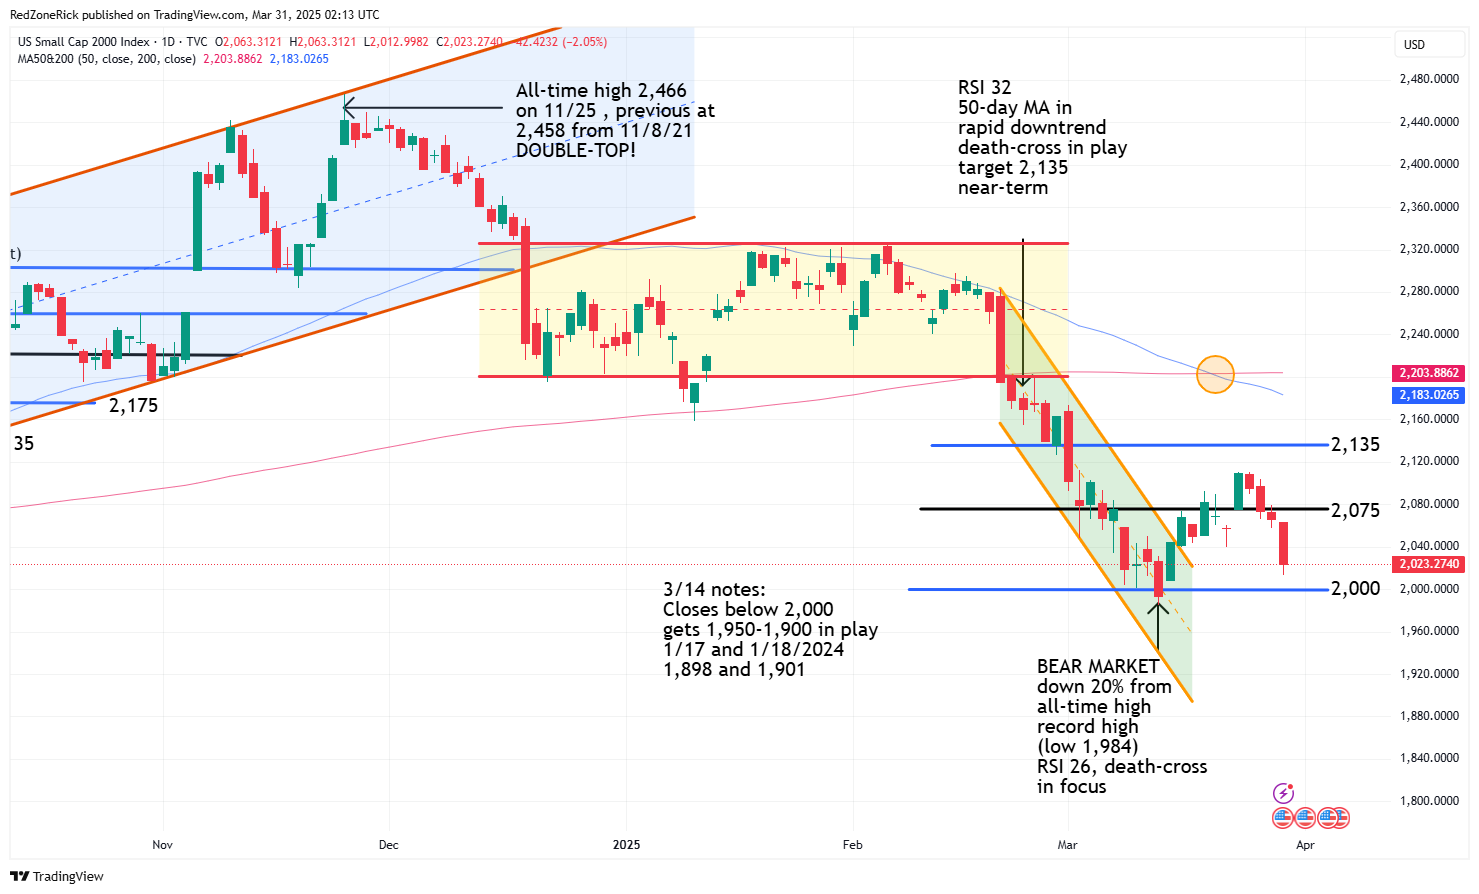
The Russell 2000 cleared and held 2,075 on Monday and Tuesday but a level that is once again resistance. We highlighted Wednesday’s close back below 2,075 and the near-term double-top at 2,110 the previous two sessions.
Friday’s trip to 2,012 held crucial support at 2,000. The intraday yearly low at 1,984 from March 13th briefly triggered a bear market (-20%) for the small-caps. Multiple closes below these levels gets 1,950-1,900 in focus with the January 17th and 18th (2024) lows at 1,898 and 1,901, respectively. The latter would represent a 23% plunge off the all-time peak at 2,466 from last November.
The Nasdaq failed to hold upper support at 17,500-17,250 on Friday with the March 11th low at 17,238 and the March 13th bottom at 17,239. These lows represented a 15% spanking from the all-time top at 20,204 from last December. Multiple closes below 17,250 would be a renewed bearish signal for additional risk down to 16,750-16,200. The latter represents bear market territory (-20%).
The S&P is back in the middle of its current three-week trading range on the close below mid-month support at 5,600. The March 13th intraday low kissed 5,504 and represented a 10% correction. Closes below this level would imply a further slide to 5,400-5,200 and levels from the first half of last August. The latter would also represent a 15% drubbing from the February 19th all-time top at 6,147.
Lowered resistance is at 5,650-5,700. The bigger hurdles remain at 5,750-5,800 and the 200-day moving average.
The Dow finished back below 42,000 and its 200-day moving average on Friday. These levels are now resistance followed by 43,250 and the 50-day moving average.
The blue-chips are also back in a previous trading range from March 11th with shaky support at 41,500. A move below this level would indicate another near-term top with weakness down to 41,000-40,500. The March 10th low at 40,661 represented a 10% selloff from the December 4th lifetime top at 45,073.
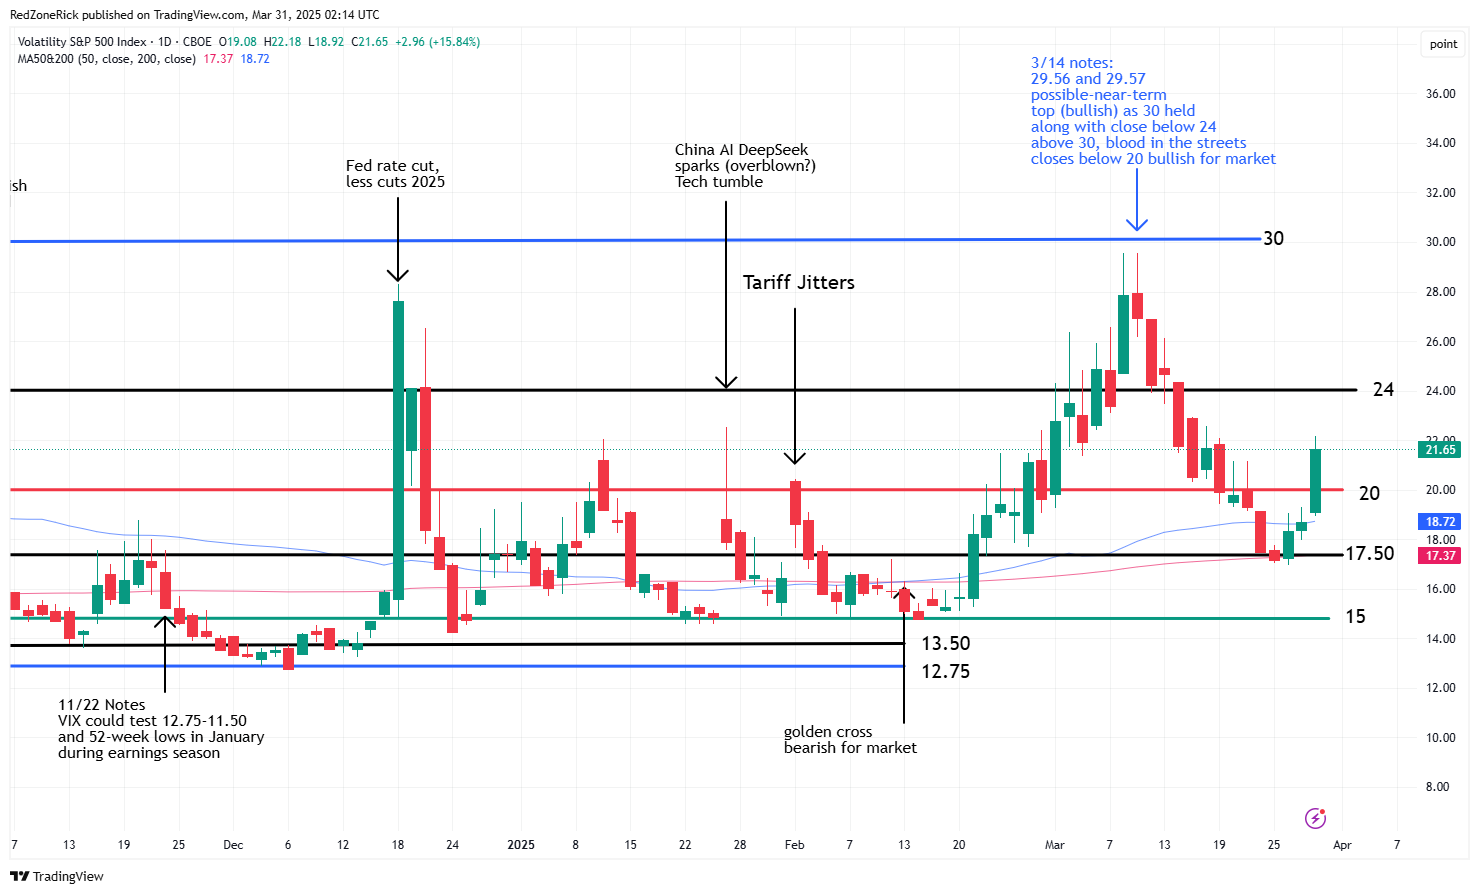
The Volatility Index (VIX) zoomed 15% on Friday to a high of 22.18. Lower resistance at 20-22.50 was cleared and held. Backup resistance is at 24 with extreme selling pressure in the market once again possibly getting 30 in focus.
Support at 19-18.50 and the 50-day moving average. The 17.50 level and the 200-day moving average proved to be a major battle ground throughout the first part of last week.
The overall technical outlook could remain choppy into the first-quarter earnings season which begins mid-April. The financial sector gets the ball rolling with Bank of America (BAC), Citigroup (C) and PNC Financial Services (PNC) announcing numbers on April 15th, before the opening bell.
We mentioned last week that the VIX could trade between 17.50 and up to 20-22.50 over the next couple of weeks and into earnings season. This would also mean a trading range for the major indexes but it won’t take much to get the selling pressure going, especially if Monday’s session is weak.
The charts have highlighted key support levels from mid-month, and if breached, the bears will likely take a stab at fresh 2025 lows. The bulls (slash algorithms) bought the recent selloff at -10% for the Dow and S&P, -15% for the Nasdaq, and -20% for the small-caps so anything can happen.
This is important, so take notes and write this down. If the March 13th lows are breached, we believe the major indexes could fall an additional 5%-10% while pushing the August 5th lows. The bulls once again have their backs against the wall and this will be another big test as this week will be full of tariff news.