Beige Book Shows Modest Growth, Q3 Earnings Season In Full-Swing
After seeing gains on Tuesday, markets turned lower on Wednesday with all three major U.S. indices closing in the red. Without notable progress on an economic relief package, markets had little to go off today as additional earnings and economic reports continue to direct stocks.
The Federal Reserve released its latest Beige Book, measuring key economic indicators in its twelve Federal districts, showing modest growth throughout the U.S.; employment, retail sales, and consumer prices showed growth while concern was raised regarding continued activity in the months to come. Tesla, Verizon, and Abbott Labs were the marquee earnings on the docket for Wednesday while tomorrow’s key reports are AT&T, Coca-Cola, and Intel.
Our models are projecting the SPY to trade in the range of $318-$360 and we will look to be buyers into any short-term corrections. Markets dipped today as fiscal stimulus talks continue to stall. Short-term traders could consider adding to positions when SPY is near $340. We continue monitoring VIX levels as the market can overshoot support and resistance levels when VIX is trading near the $25 level. As always, we encourage all market commentary readers to maintain clearly defined stop-levels for all positions. For reference, the SPY Seasonal Chart is shown below:

Key U.S. Economic Reports/Events This Week
- Beige Book – Wednesday
- Existing Home Sales (September) – Thursday
- Weekly Jobless Claims (10/17) – Thursday
- Markit Manufacturing PMI (October) – Friday
- Markit Services PMI (October) – Friday
Upcoming Earnings
- TSLA – Tesla, Inc. – Wednesday
- VZ – Verizon Communications – Wednesday
- ABT – Abbott Laboratories – Wednesday
- CSX – CSX Corporations – Wednesday
- CMG – Chipotle Mexican Grill – Wednesday
- DFS – Discover Financial – Wednesday
- INTC – Intel Corporation – Thursday
- KO – Coca Cola Corporation – Thursday
- T – AT&T Inc. – Thursday
- LUV – Southwest Airlines – Thursday
- COF – Capital One Financial – Thursday
- AXP – American Express Company – Friday
(Want free training resources? Check our our training section for videos and tips!)
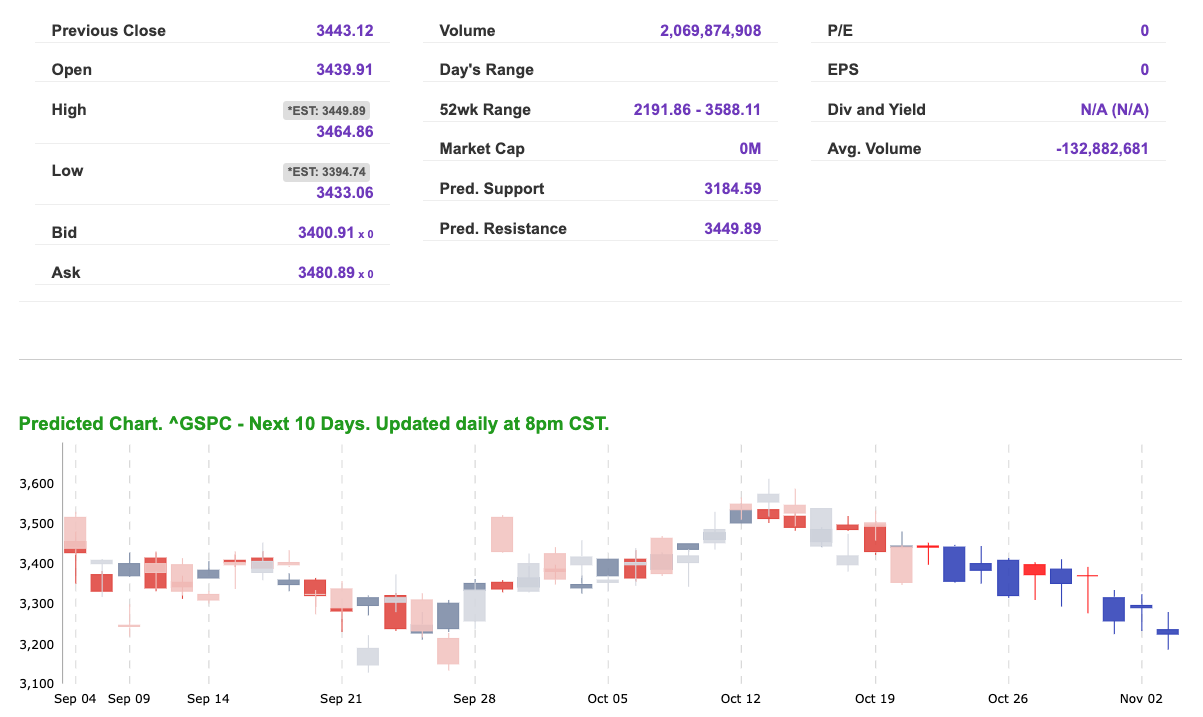
For reference, the S&P 10-Day Forecast is shown below:
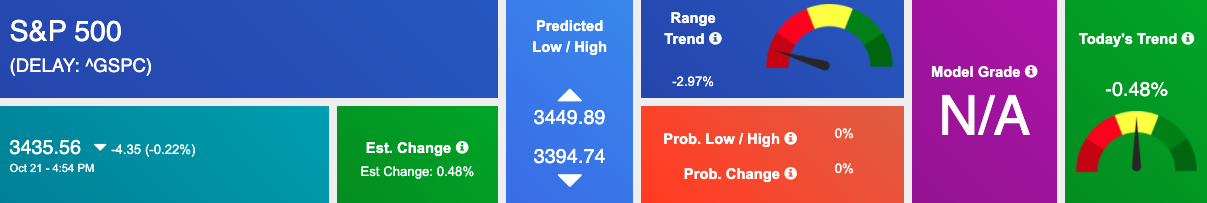
Using the “^GSPC” symbol to analyze the S&P 500 our 10-day prediction window shows a near-term positive outlook. Prediction data is uploaded after the market closes at 6 p.m. CST. Today’s data is based on market signals from the previous trading session.
Vlad’s Portfolio Lifetime Membership!
DO AS I DO… AS I DO IT WATCH LIVE AS I WORK THE MARKETS! TRY IT NOW RISK-FREE!
Click Here to Sign Up
Thursday Morning Featured Symbol
Our featured symbol for Thursday is The Charles Schwab Corporation (SCHW). SCHW is showing a steady vector in our Stock Forecast Toolbox’s 10-day forecast.
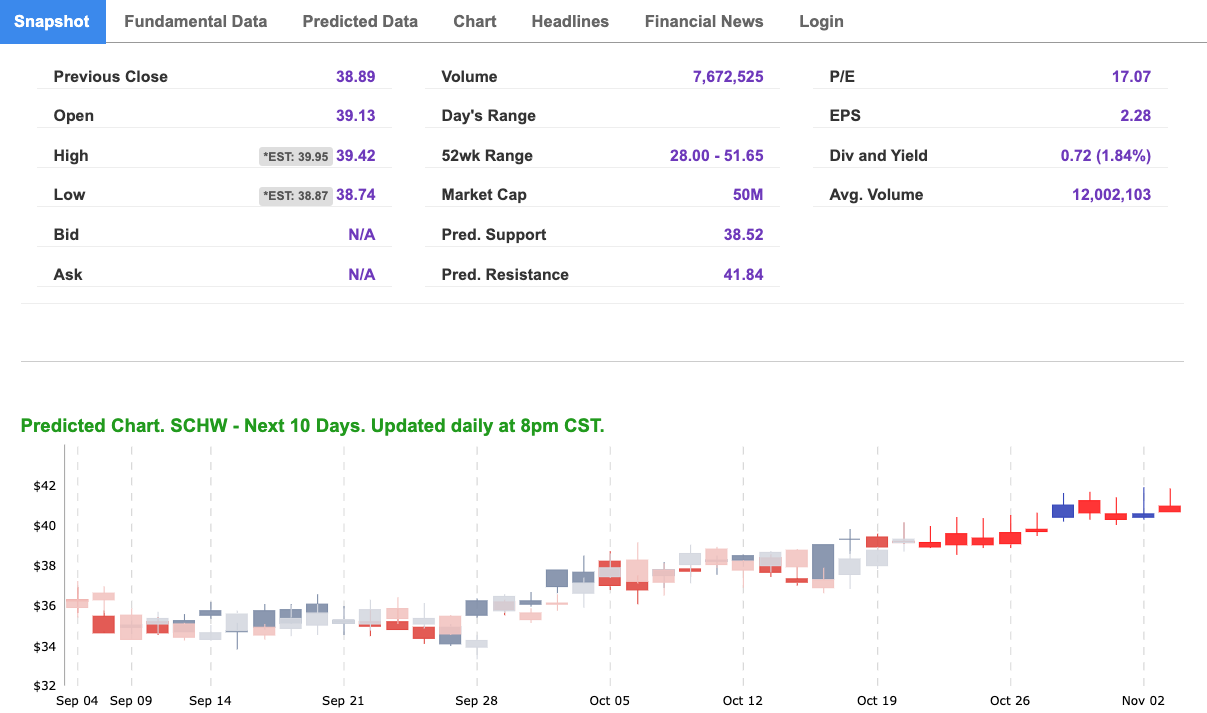
The stock is trading at $38.93 with a vector of -0.43% at the time of publication.
10-Day Prediction data is uploaded after the market close at 6 p.m., CST. Today’s data is based on market signals from the previous trading session.
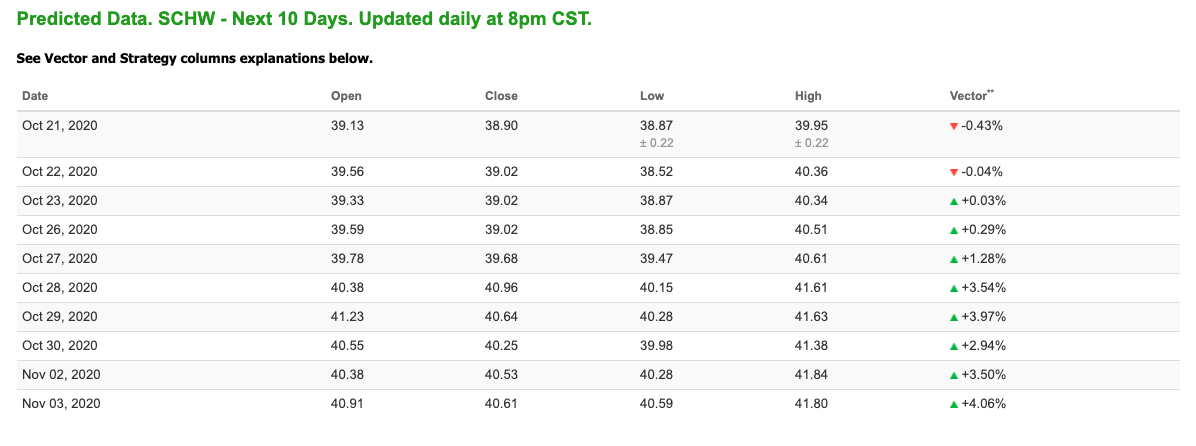
Note: The Vector column calculates the change of the Forecasted Average Price for the next trading session relative to the average of actual prices for the last trading session. The column shows the expected average price movement “Up or Down”, in percent. Trend traders should trade along the predicted direction of the Vector. The higher the value of the Vector the higher its momentum.
*Please note: At the time of publication Vlad Karpel does have a position in the featured symbol, SCHW. Our featured symbol is part of your free subscription service. It is not included in any paid Tradespoon subscription service. Vlad Karpel only trades his money in paid subscription services. If you are a paid subscriber, please review your Premium Member Picks, ActiveTrader, or MonthlyTrader recommendations. If you are interested in receiving Vlad’s picks, please click here.
Oil
West Texas Intermediate for Crude Oil delivery (CL.1) is priced at $40.00 per barrel, down 0.07% at the time of publication.
Looking at USO, a crude oil tracker, our 10-day prediction model shows mixed signals. The fund is trading at $28.59 at the time of publication. Prediction data is uploaded after the market close at 6 p.m., CST. Today’s data is based on market signals from the previous trading session.
Gold
The price for the Gold Continuous Contract (GC00) is down 1.50% at $1,928.00 at the time of publication.
Using SPDR GOLD TRUST (GLD) as a tracker in our Stock Forecast Tool, the 10-day prediction window shows mixed signals. The gold proxy is trading at $178.39, at the time of publication. Vector signals show -0.52% for today. Prediction data is uploaded after the market close at 6 p.m., CST. Today’s data is based on market signals from the previous trading session.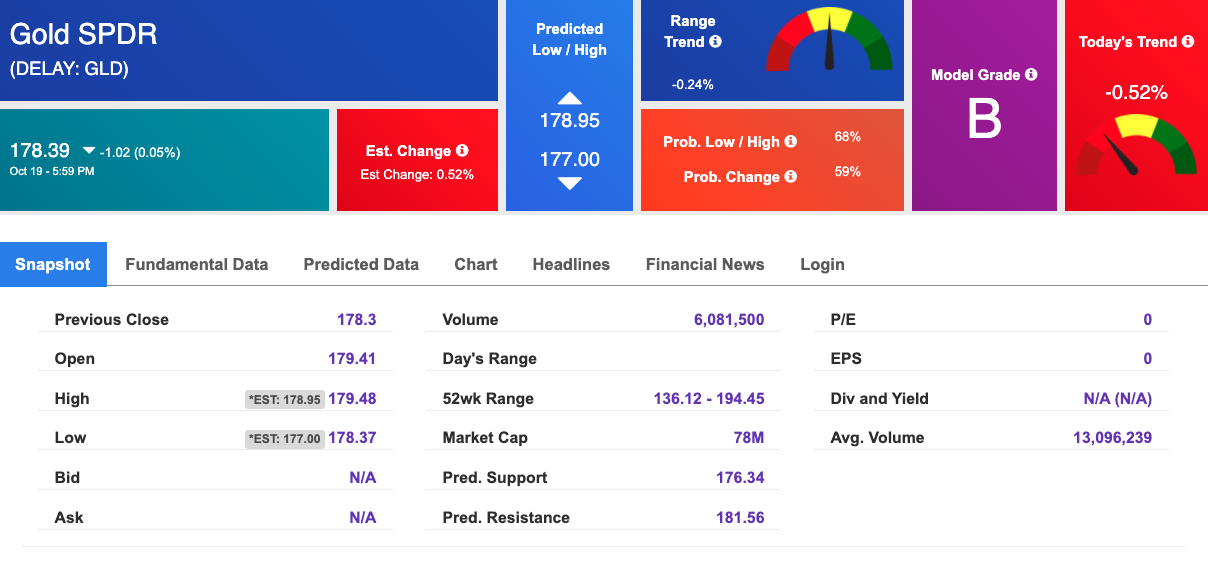
Treasuries
The yield on the 10-year Treasury note is up, at 0.772% at the time of publication.
The yield on the 30-year Treasury note is down, at 1.581% at the time of publication.
Using the iShares 20+ Year Treasury Bond ETF (TLT) as a proxy for bond prices in our Stock Forecast Tool, we see mixed signals in our 10-day prediction window. Prediction data is uploaded after the market close at 6 p.m., CST. Today’s data is based on market signals from the previous trading session.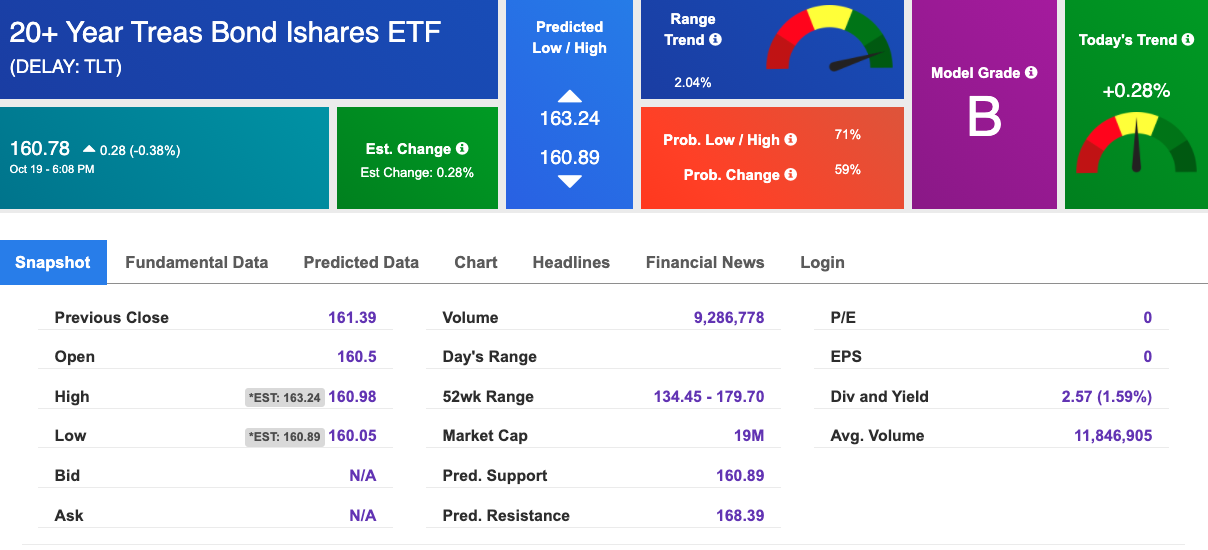
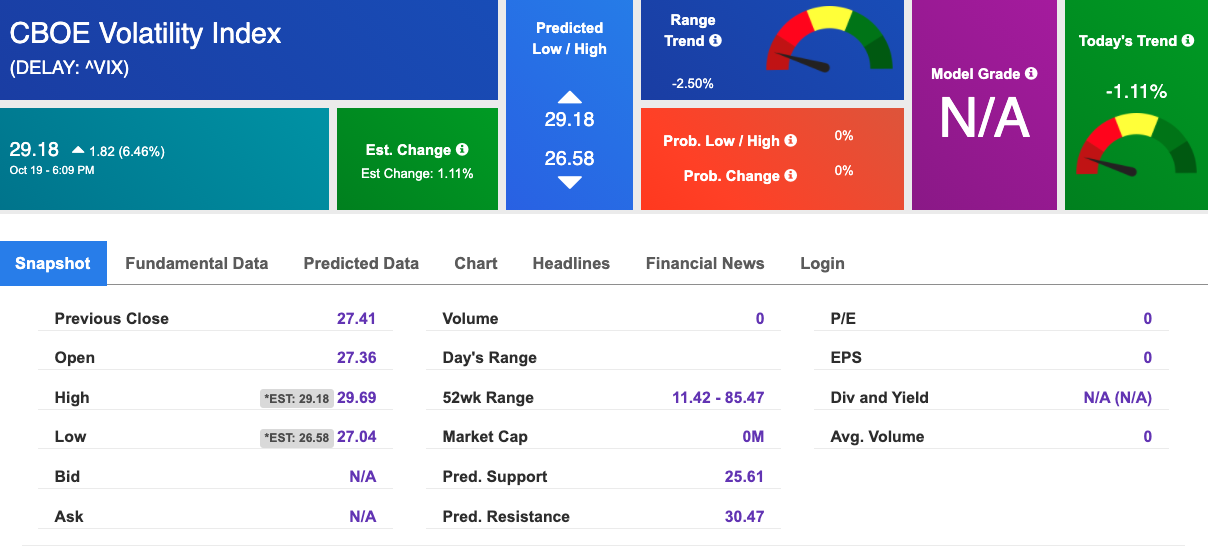
Volatility
The CBOE Volatility Index (^VIX) is $29.18 at the time of publication, and our 10-day prediction window shows mixed signals. Prediction data is uploaded after the market close at 6 p.m., CST. Today’s data is based on market signals from the previous trading session.