

Bulls Keep Momentum Following Jobs Report
- For the week, the Nasdaq jumped 2.2% while the S&P rose 1.4%. The Dow was up 1.2%. The big story was the Russell as the small-caps soared over 3%. All of the major indexes are still holding current and adjusted uptrend channels with volatility also closing below a key level of support.
- Last Tuesday’s break above key resistance levels were very bullish clues the rest of the week could see higher highs. The Nasdaq closed above 19,250; the S&P reclaimed 5,950; the Dow recovered its 200-day moving average; and the Russell cleared 2,075.
- At current levels, the S&P is now just 2% away from a fresh all-time high while the Nasdaq is 3% shy of a new record high.
Wall Street rebounded on Friday as the May jobs data came in better-than-expected. The U.S. economy added 139,000 jobs last month, slightly above expectations, while the unemployment rate held steady at 4.2%. This follows Wednesday’s weak private payrolls update and helped ease concerns about an economic slowdown amid ongoing tariff turbulences.
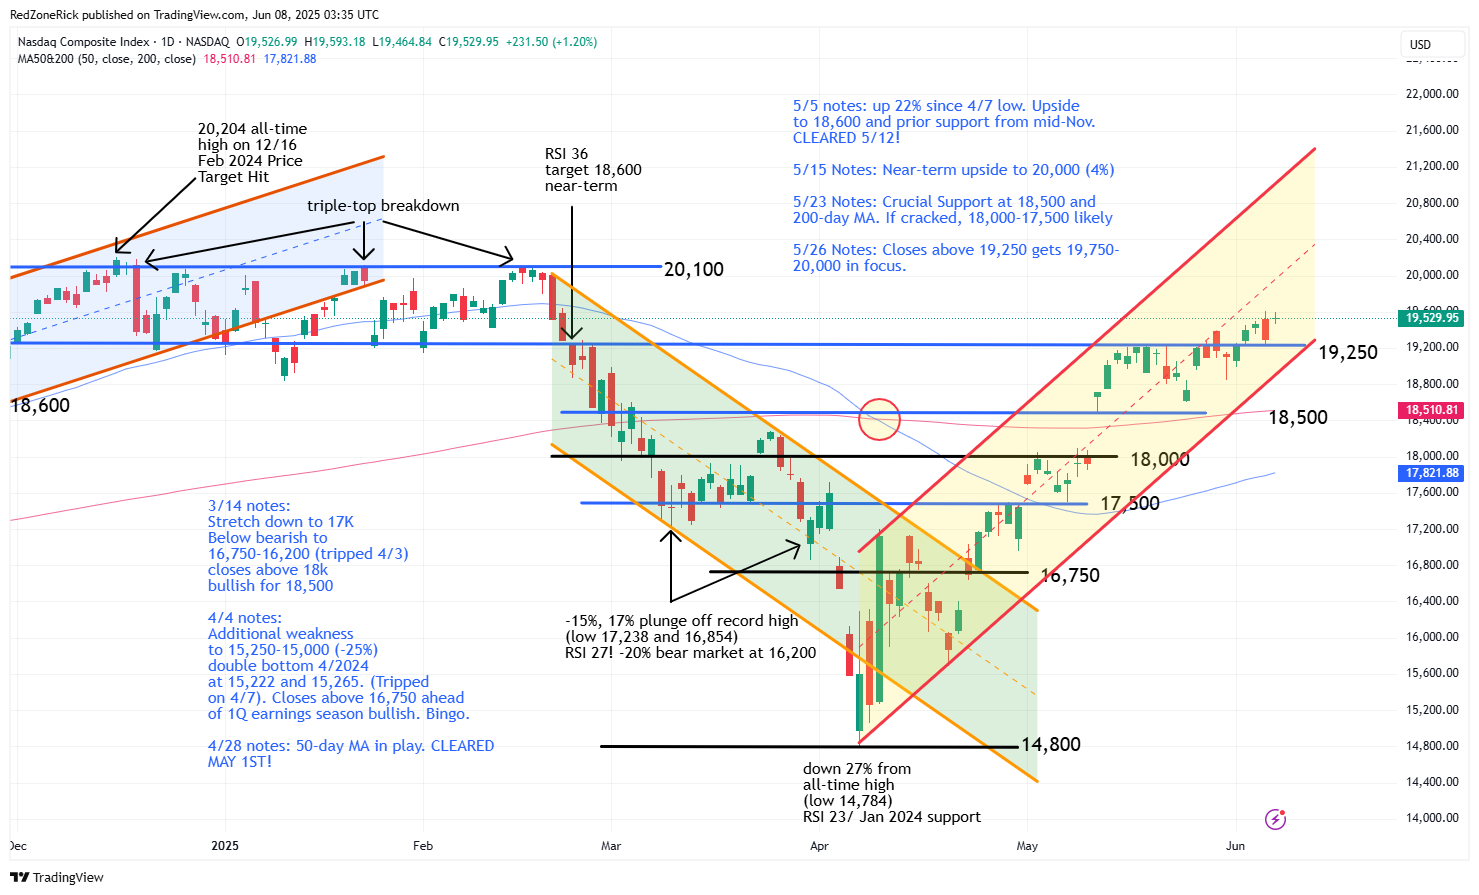
The Nasdaq ended at 19,529 (+1.2%) with the high hitting 19,593. Key resistance at 19,500 was cleared and held. Support is at 19,250.
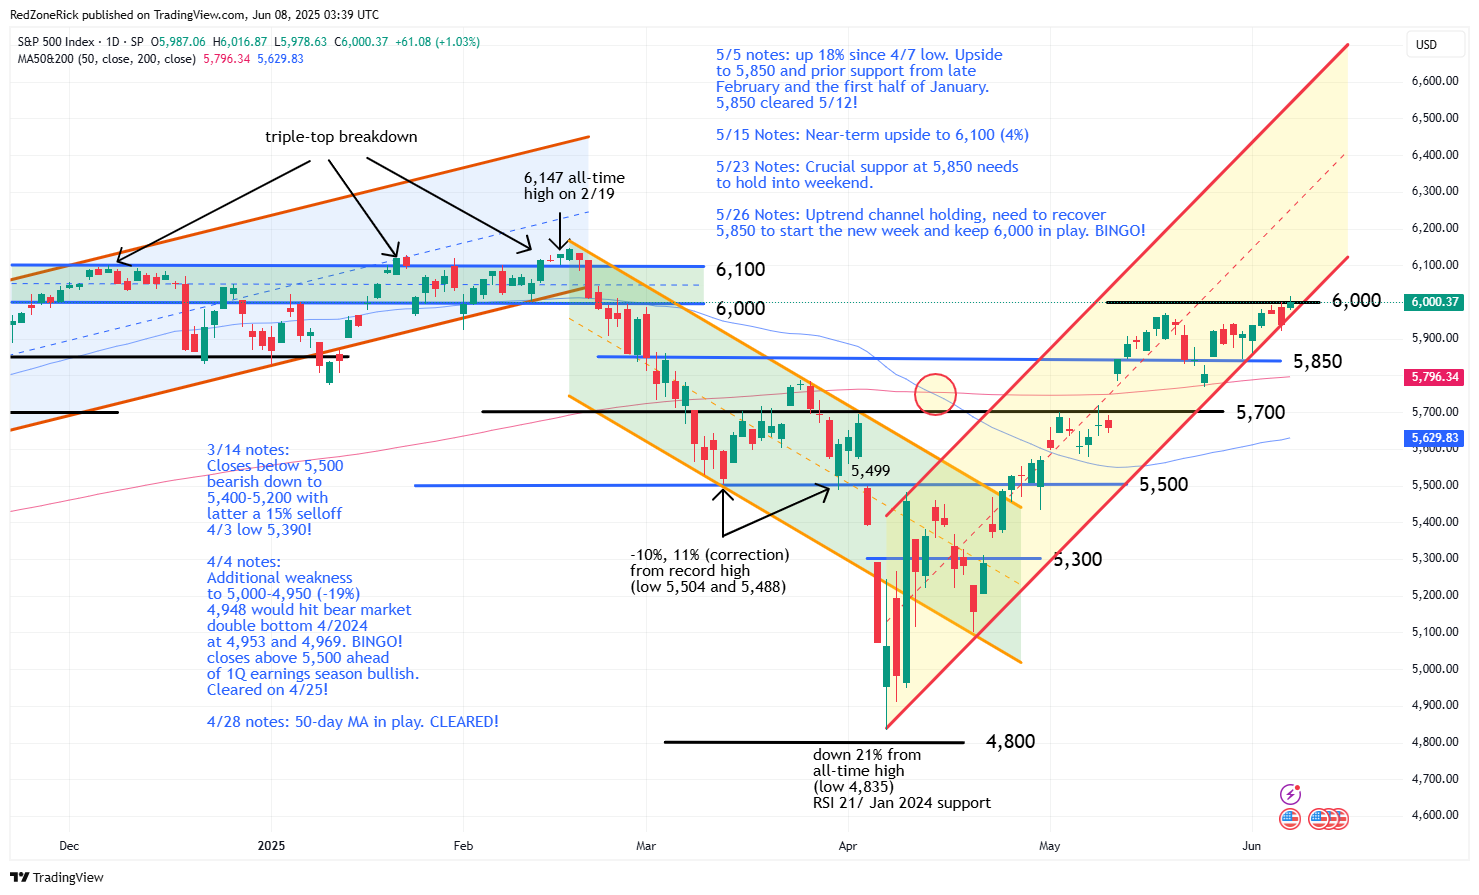
The S&P 500 made a run to 6,016 while closing at 6,000 (+1%). Key resistance at 6,000 was recovered. Support is at 5,950.
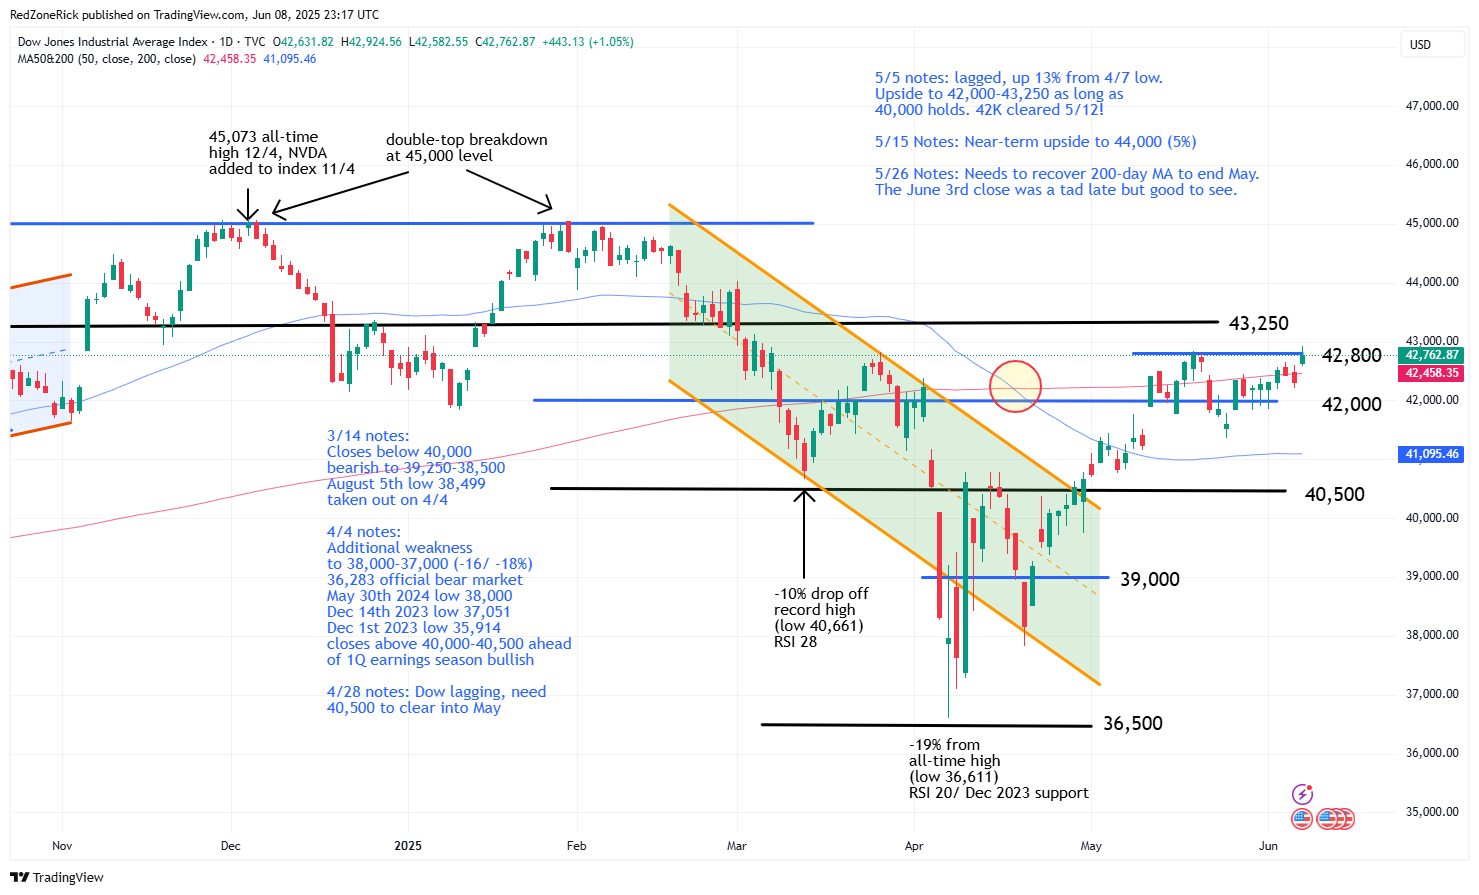
The Dow was last seen at 42,762 (+1.1%) after testing an intraday peak of 42,924. Resistance at 42,800 was topped but held. Support is at 42,500.
Earnings and Economic News
Before the open: China Online Education Group (COE), Graham (GHM), Motorcar Parts of America (MPAA)
After the close: Calavo Growers (CVGW), Casey’s General Store (CASY), Limoneira Company (LMNR), Skillsoft (SKIL)
Economic News
Wholesale Trade Sales – 10:00am
Technical Outlook and Market Thoughts
For the week, the Nasdaq jumped 2.2% while the S&P rose 1.4%. The Dow was up 1.2%. The big story was the Russell as the small-caps soared over 3%. All of the major indexes are still holding current and adjusted uptrend channels with volatility also closing below a key level of support.
The Nasdaq’s close above 19,500 was the first since February 21st. Continued closes above this level and the February 24th intraday top at 19,644 would suggest ongoing strength towards 19,750-20,000.
The index has been holding fresh support at 19,250 since last Tuesday’s breakout and close above this level. Backup help is at 19,000-18,750.
The S&P 500 is holding a slightly adjusted uptrend channel off the April 7th low and the May 30th intraday low. The latter replaces the April 21st low. The close above 6,000 was the first since February 22nd. A trading range between 6,000-6,100 lasted for 19 days before the S&P tagged a fresh all-time high of 6,147 on February 19th.
Support is at 5,950-5,900. A close back below the latter gets 5,850 and the 200-day moving average back in focus.
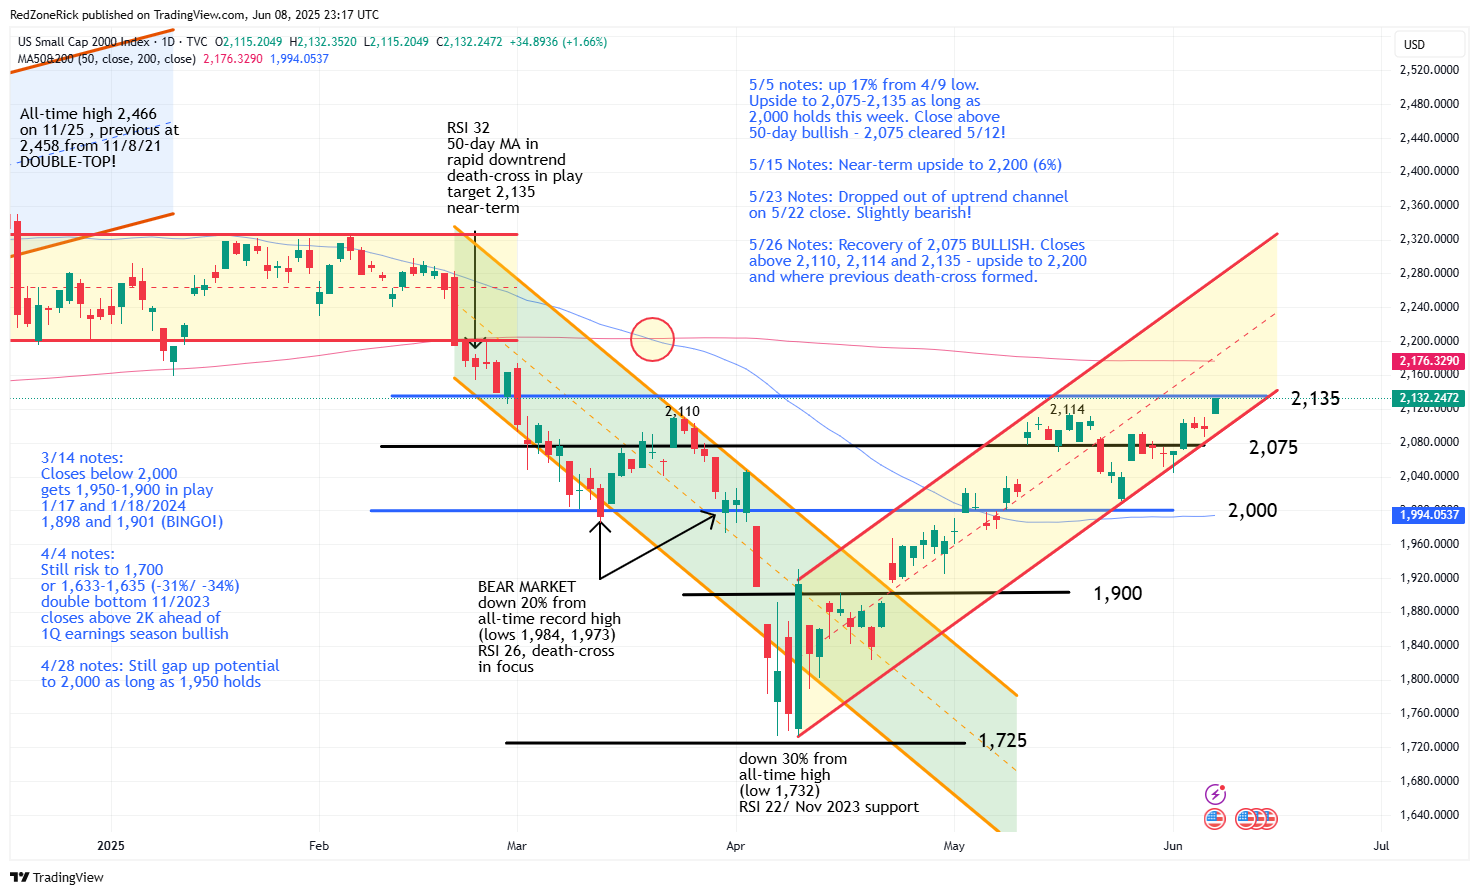
The Russell 2000 closed on the session peak of 2,132. Major resistance at 2,135 held by a field goal with closes above this level possibly leading to a quick trip to 2,175-2,200 and the 200-day moving average.
New support is at 2,100. A drop below 2,075 and out of the uptrend channel would suggest a retest to 2,050 with last Monday’s low at 2,043.
The Dow cleared key resistance from May 19th and 20th at 42,800 but a level that held. The close above 42,750 keeps upside towards 43,000-43,250 in the picture.
Key support remains at 42,000 and a level that has been holding for nine-straight sessions. Backup support is at 41,500-41,000 and the 50-day moving average.
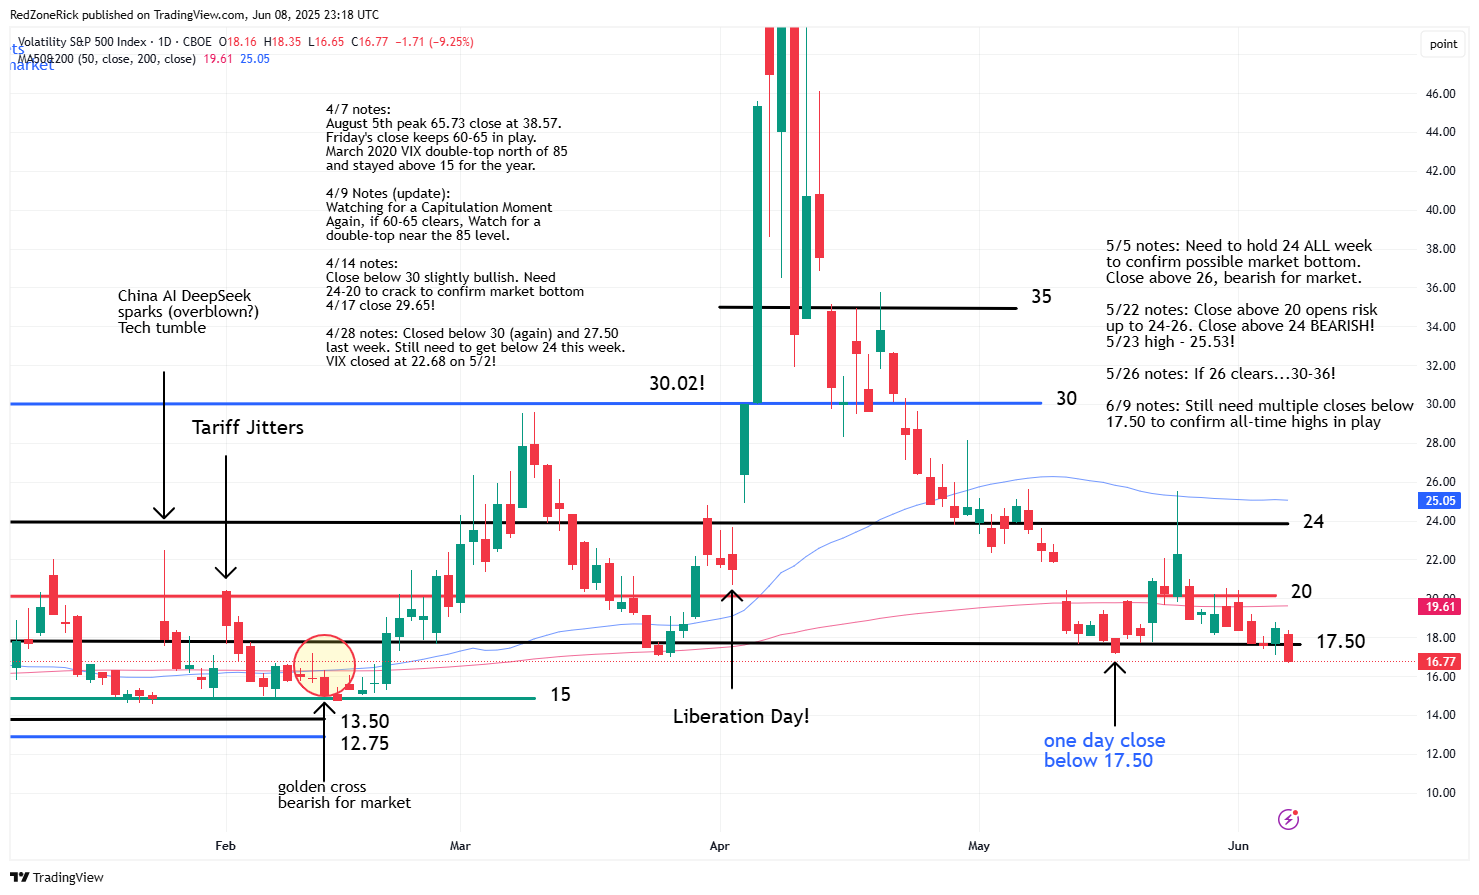
The Volatility Index (VIX) closed below 17.50 following Friday’s 9% drop. The last close below this level on May 16th was a tease and highlights the importance of holding it to confirm all-time market highs remain in play. New support is at 16.50-15.50. The last close below 15 was on February 14th.
Resistance is at 18-18.50. A close back above 20 would be a yellow flag for the bulls.
Last Tuesday’s break above key resistance levels were very bullish clues the rest of the week could see higher highs. The Nasdaq closed above 19,250; the S&P reclaimed 5,950; the Dow recovered its 200-day moving average; and the Russell cleared 2,075.
All of the aforementioned price points represent fresh but shaky support levels. This is the biggest takeaway from the charts this week so we will be watching these levels like a hawk throughout the upcoming week.
At current levels, the S&P is now just 2% away from a fresh all-time high while the Nasdaq is 3% shy of a new record high.