Dow Down Seven-Straight Sessions
The major indexes showed mixed action for the week with Tech breaking out to all-time highs while the broader market maintained a mini-trading range. Meanwhile, the blue-chips and the small-caps trended lower throughout the week while making another round of lower lows on Friday.
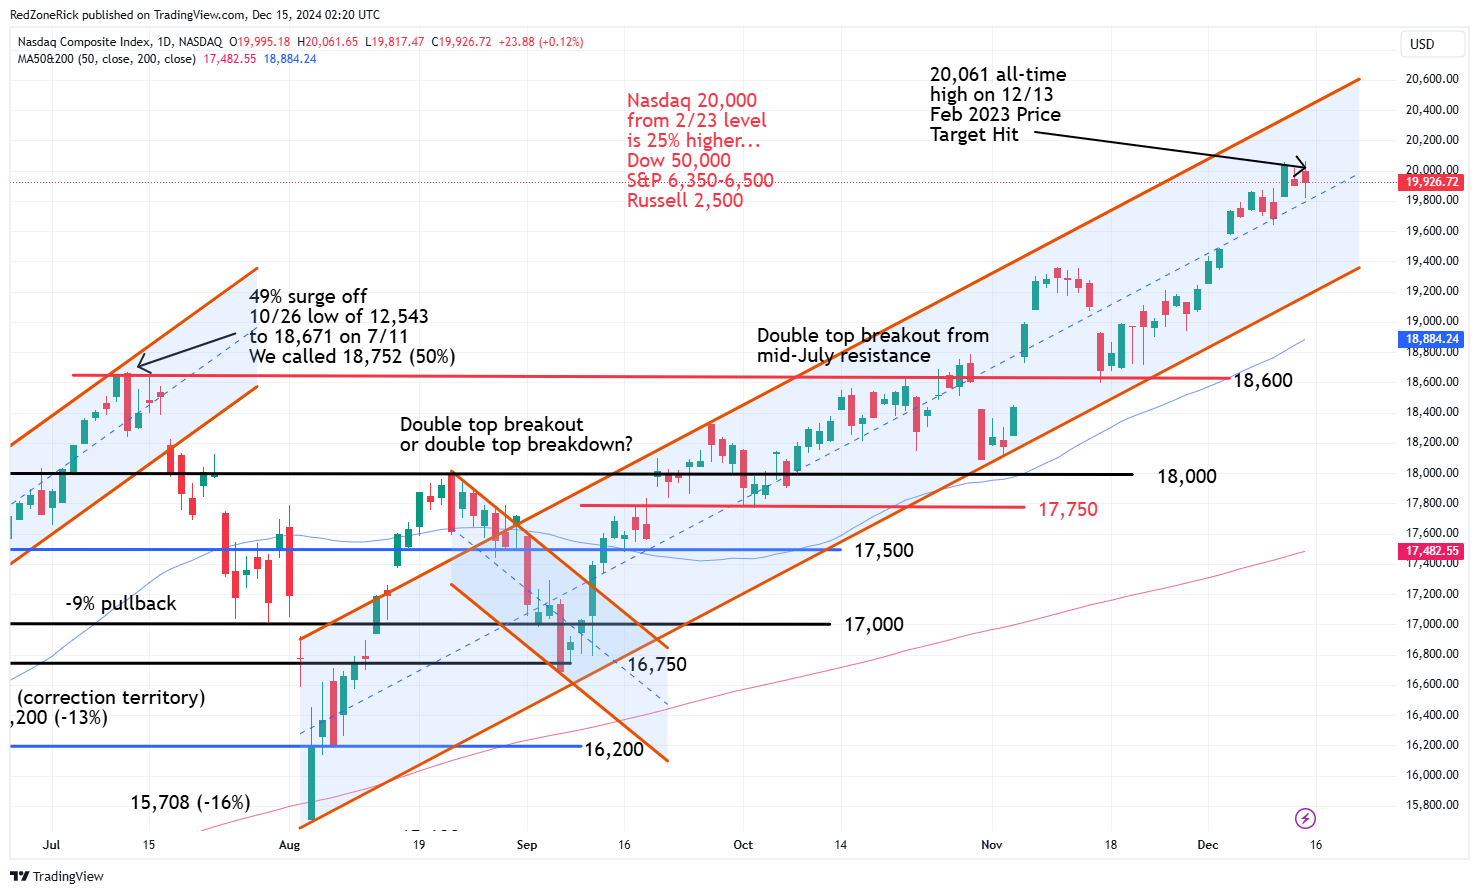
Let’s start with the Nasdaq following its run to an all-time high of 20,055 on Wednesday. This tripped our February 23rd Price Target of 20,000 when the index was at 15,996. Continued closes above these levels would signal strength towards 20,200-20,400 with the top of the current uptrend channel at 20,600.
Key support is at 19,600 that was established on the December 4th breakout and the December 10th back test. A close below 19,400 and the bottom of the uptrend channel would be a bearish development.

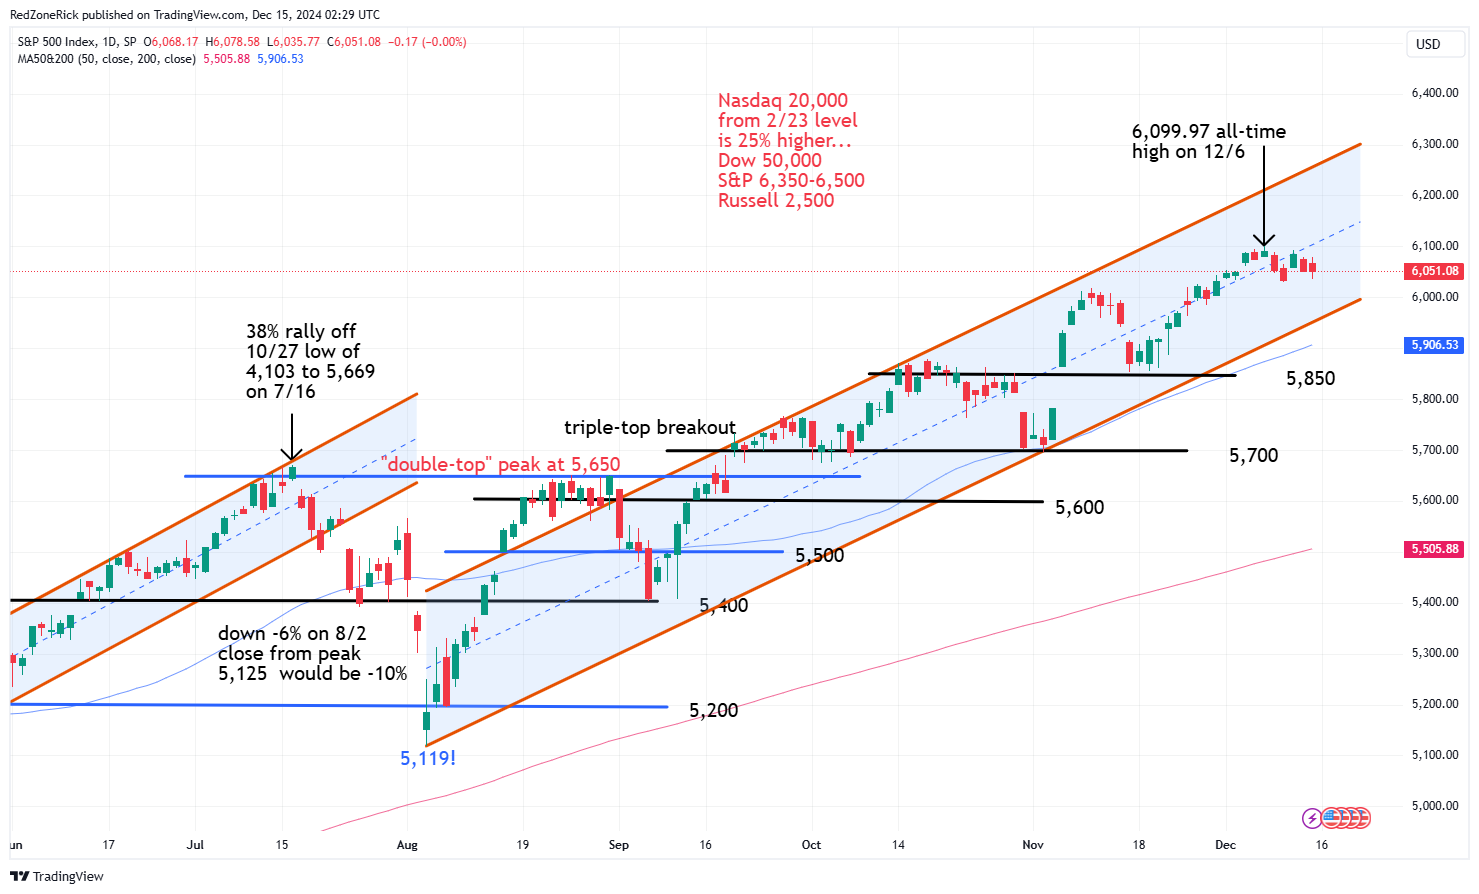
The S&P topped out at 6,092 last Wednesday and fell shy of clearing key resistance at 6,100 and the December 6th all-time high of 6,099.97. The top of the current uptrend channel shows momentum to 6,300 with our February price target for yearend at 6,500 when the index was at 5,088. This was slightly higher than the other indexes at 28% with 6,350 representing a 25% run.
The 6,000 level has been holding since early November and represents the bottom of the current uptrend channel. There is stretch down to 5,950-5,900 and the 50-day moving average if 6,000 fails. A close below 5,850 would suggest a near-term top.

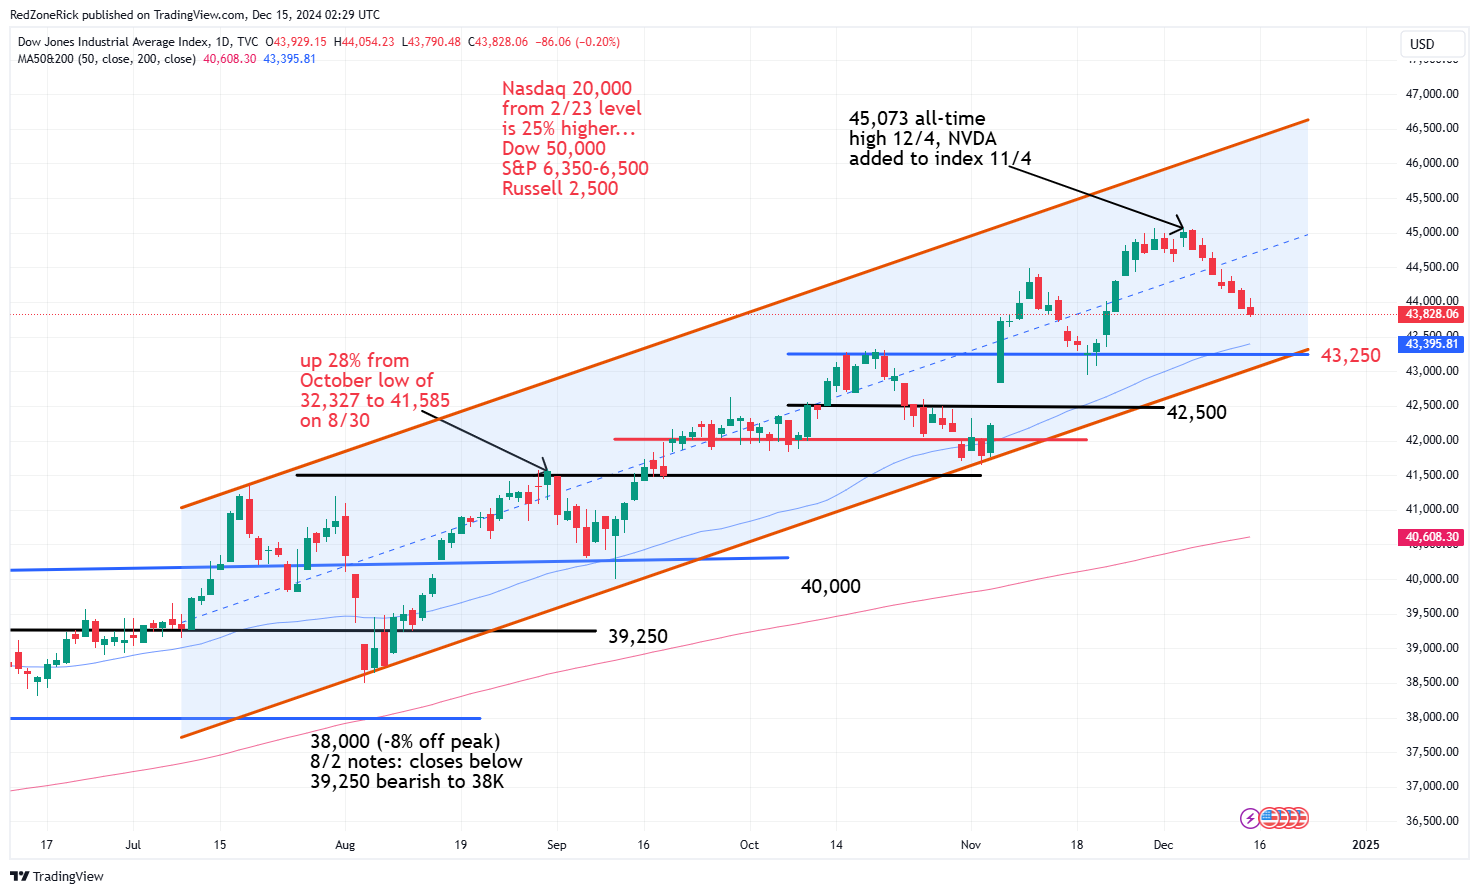
The Dow fell for the 7th-straight session with the close below 44,000 likely getting 43,500-43,250 and the 50-day moving average in play. The latter represents the bottom of our readjusted uptrend channel and could get buyers to start nibbling. If not, there is risk to 42,500 on continued weakness.
The blue-chips are down 3% from the all-time high of 45,073. Continued closes back above 44,500 would suggest a near-term bottom. The middle of the uptrend channel is now at 45,000.

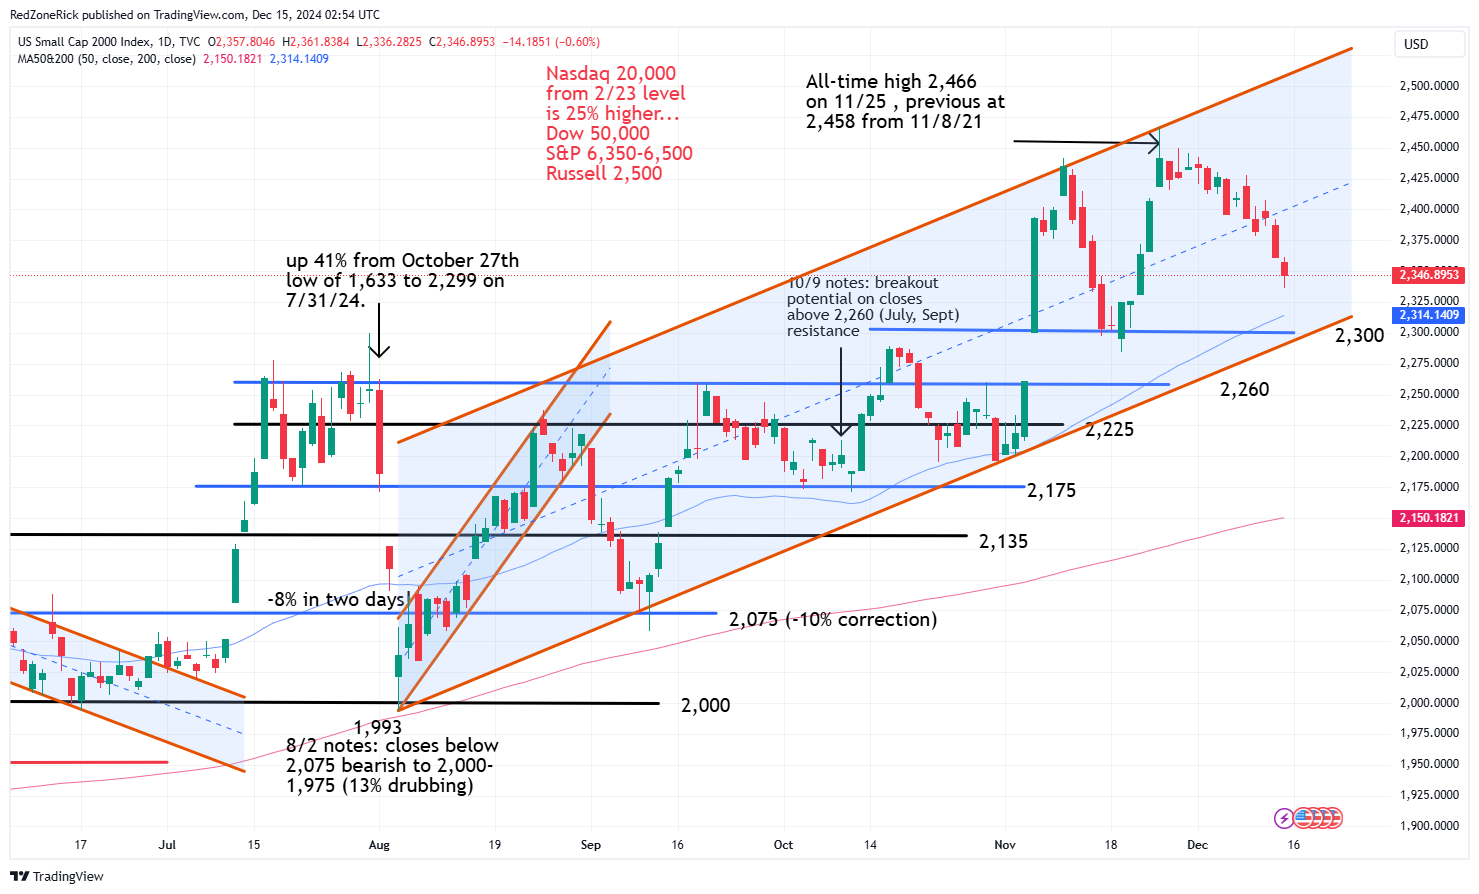
The Russell is down 5% from the November 25th all-time high at 2,466. Key resistance is now firmly at 2,400 following the December 5th close below this level. We want to wait for 2,425 to clear before we say new all-time highs are back on the board.
We mentioned last week there was major support at 2,300 and the bottom of the current uptrend channel on continued weakness. The 50-day moving average is at 2,314. Closes below both these levels would be an ongoing bearish development for the small-caps.

In our notes last Monday we said there was “no need to turn cautious on the overall market until the Nasdaq falls back below 19,250; the Dow slips under 44,000; and the S&P fails to hold 6,000.”
The Dow’s inability to hold 44,000 could be considered “stretch” if there is a recovery back above this level to start the week. If not, the Nasdaq and the S&P could test their key support areas at some point this month. We also said to watch 2,300 on the Russell with Friday’s low at 2,336.
The Volatility Index (VIX) closed back above 13.50 to start last week and a level that held. Friday’s low kissed 13.24 with the close at 13.81. More crucial support is at 12.75 with the prior Friday’s low at 12.70. We are still targeting a possible drop towards 11.50 on continued closes below 12.75. Key resistance is at 15 and a level that has been holding since November 25th. If cleared, we will start easing on bullish setups, and instead, start focusing on bearish plays.