
Dow Finally Clears 45,000
- For the week, the Nasdaq added 0.8% and the S&P rose 0.9%. The Dow jumped 1.7% while the Russell surged 3%. Year-to-date, the Nasdaq has soared 12% and the S&P has rallied 9.7%. The Dow is higher by 5.6% and the Russell is up 56 points, or 2.5%, for 2025.
- The (RSI) relative strength index level for the Nasdaq fell back below 70 on Friday as the index was once again trading in overbought territory. We have been mentioning all summer extended periods of fluff territory could keep RSI levels elevated and above 70 so we are still watching them. The S&P pulled back off the 68 level.
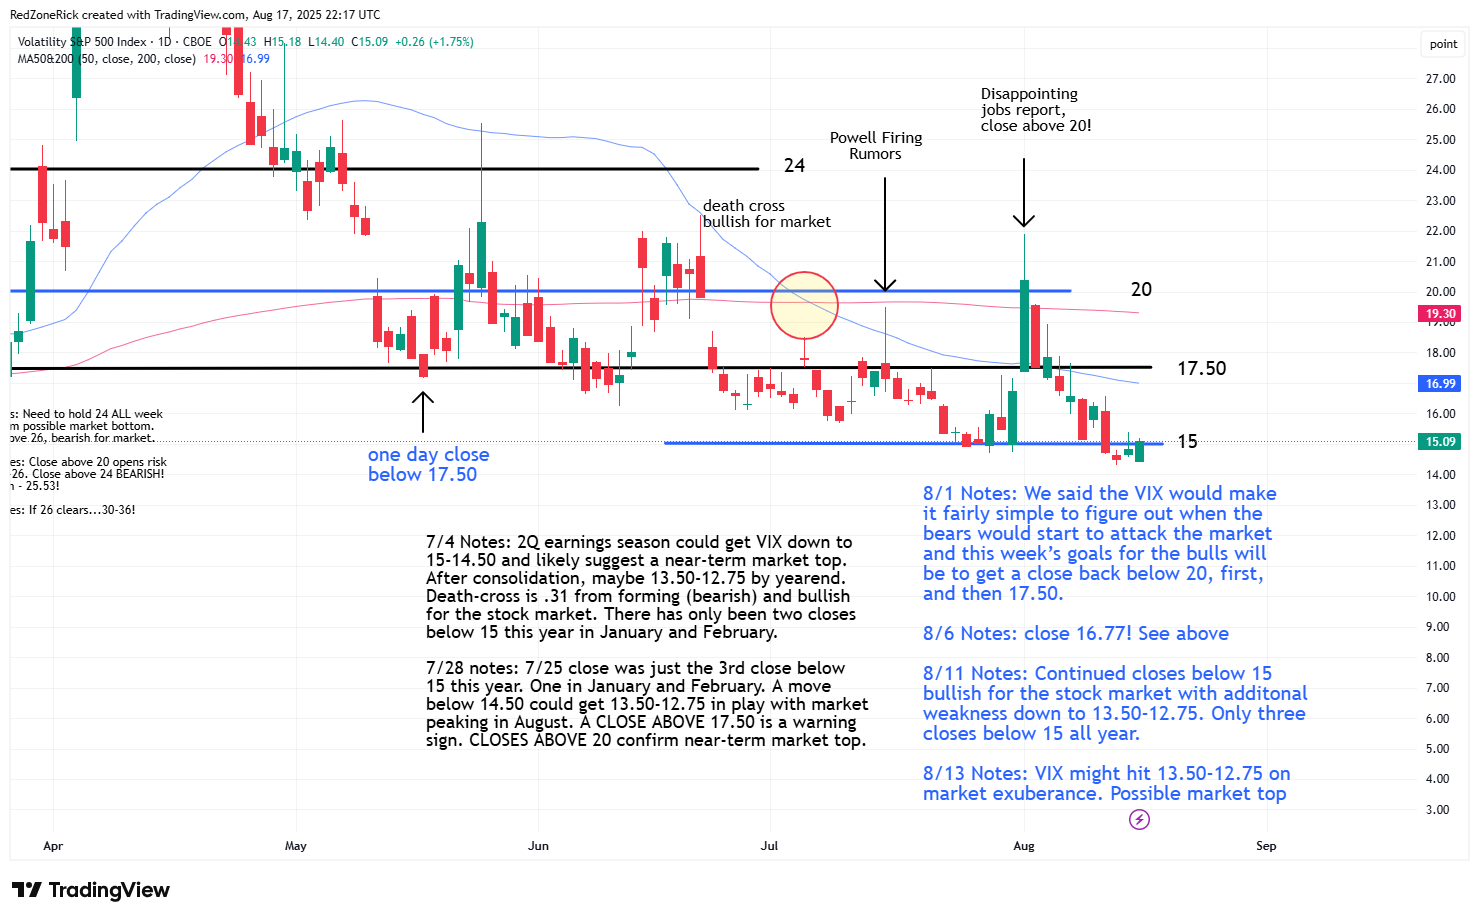
- The Volatility Index (VIX) had settled below 15 for three-straight sessions before Friday’s close back above this level. On July 4th, we predicted weakness down to 15-14.50 during earnings season with the market peaking at some point in August. Wednesday’s low hit 14.30. There is still a chance 13.50-12.75 comes into play on closes below 14.50-14.
It was another bullish week for Wall Street as the major indexes continued to set record highs despite Friday’s slight pullback. Consumer sentiment weighed on the action after souring in August for the first time in four months.
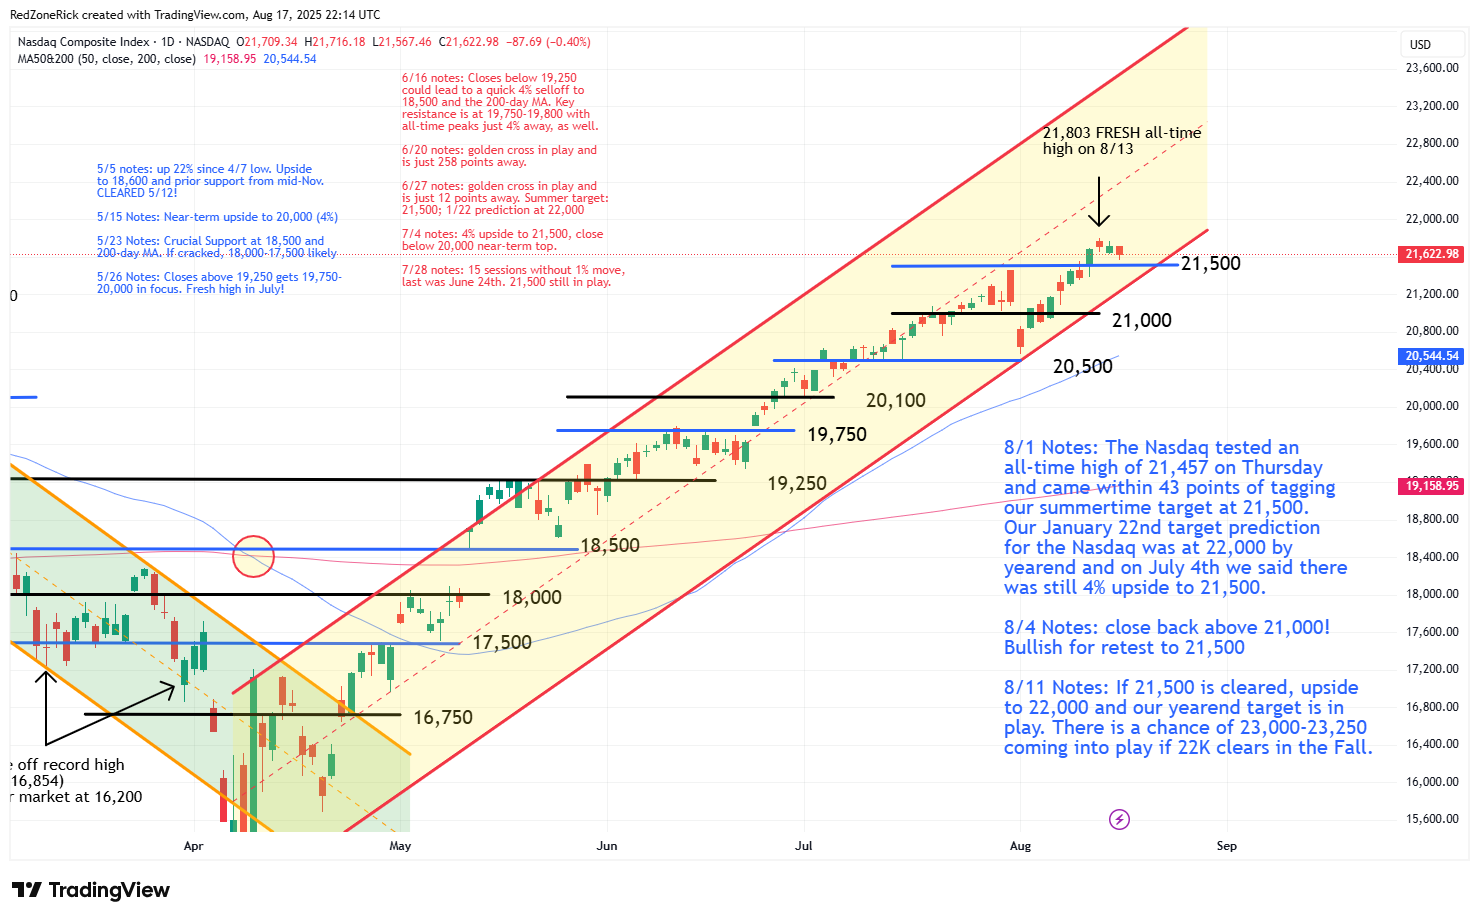
The Nasdaq touched a low of 21,567 while closing at 21,622 (-0.4%). Key support at 21,500 held. Resistance is at 21,750.
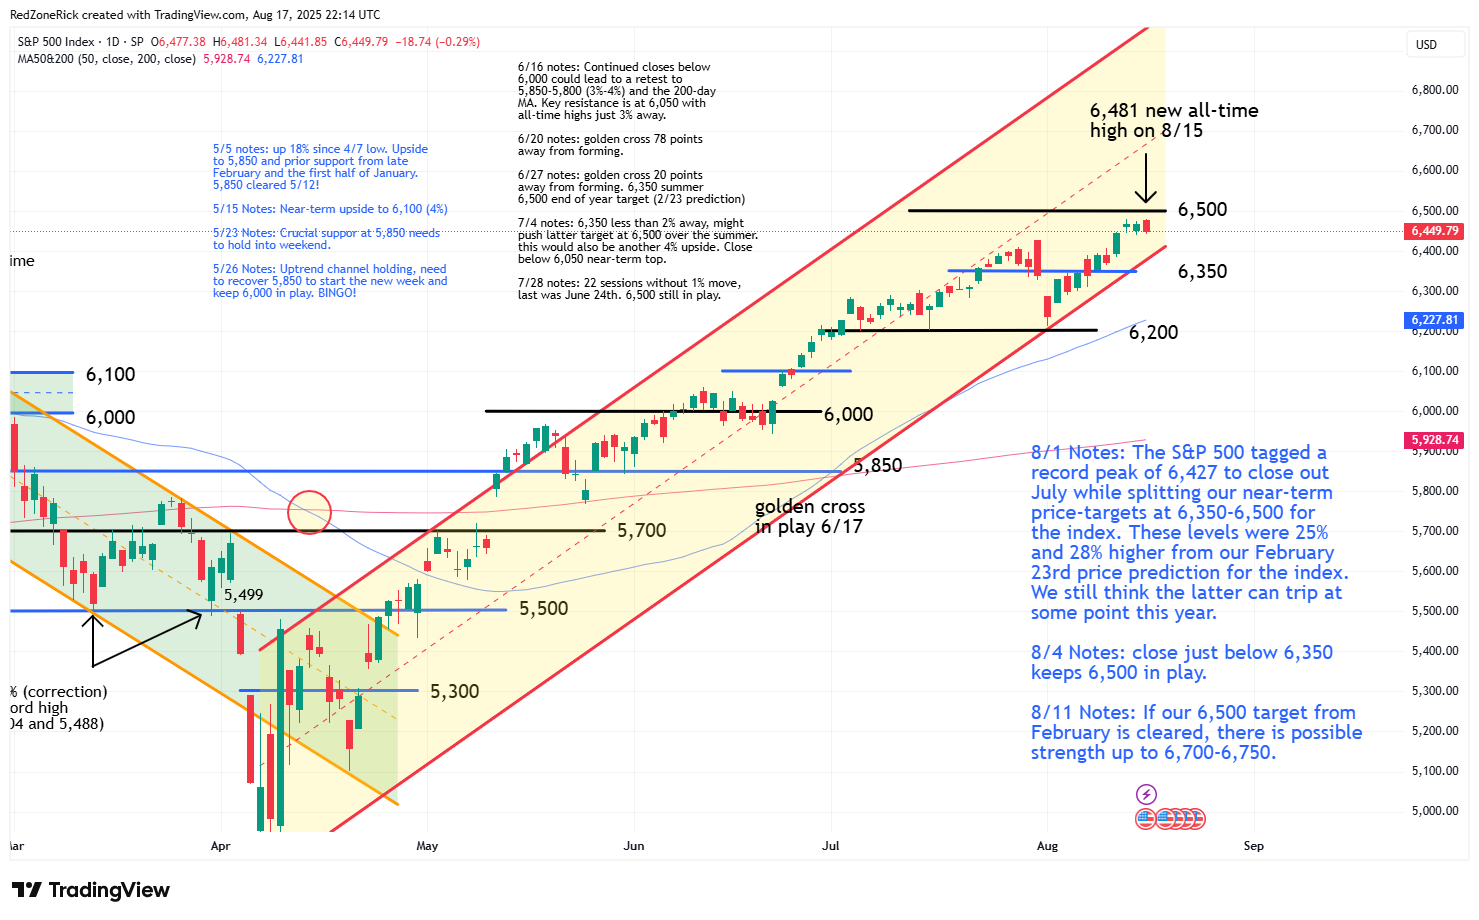
The S&P 500 ended at 6,449 (-0.3%) with the intraday low at 6,441. Support at 6,400 held. Undefined resistance is at 6,500.
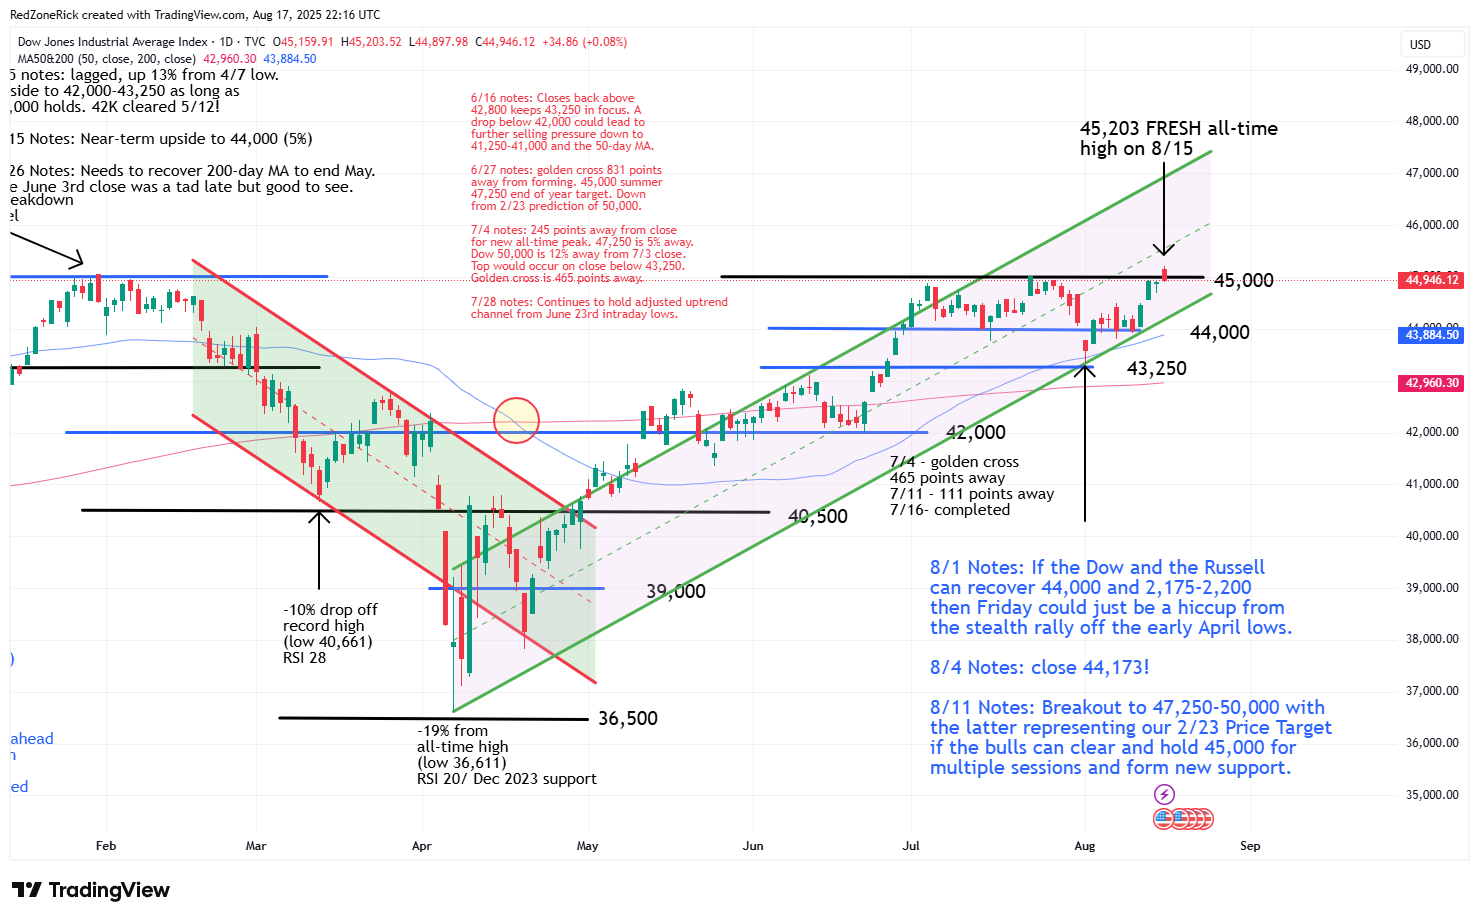
The Dow tagged a record high of 45,203 before settling at 44,946 (+0.1%). Resistance at 45,000 was cleared but held. Support is at 44,500.
Earnings and Economic News
Before the open: Bitdeer Technologies (BTDR), Freightos (CRGO)
After the close: Agora (API), Blink Charging (BLNK), Palo Alto Networks (PANW)
Economic News
Home Builder Confidence Index – 10:00am
Technical Outlook and Market Thoughts
For the week, the Nasdaq added 0.8% and the S&P rose 0.9%. The Dow jumped 1.7% while the Russell surged 3%. Year-to-date, the Nasdaq has soared 12% and the S&P has rallied 9.7%. The Dow is higher by 5.6% and the Russell is up 56 points, or 2.5%, for 2025.
The (RSI) relative strength index level for the Nasdaq fell back below 70 on Friday as the index was once again trading in overbought territory. We have been mentioning all summer extended periods of fluff territory could keep RSI levels elevated and above 70 so we are still watching them. The S&P pulled back off the 68 level.
The 50 level has been holding since mid-April and off of the market lows from April 7th. The Nasdaq and the S&P tested and fell below this level on the August 1st (Frida) selloff but made a steady run to 70 afterwards. The Russell and the Dow’s RSI levels stalled at 67 and 60 last week and closed at 60 and 58, respectively.
When the RSI levels for the Nasdaq and the S&P close below 50, and the Dow and the Russell RSI levels fall below 40, it would possibly start to signal money is moving out of the market and to the sidelines. Otherwise, we don’t see a major issue with RSI levels remaining extended over the near-term.
The Nasdaq tagged a lifetime high of 21,803 last Wednesday and came within 197 points of tagging our January 22nd, 2025 price target at 22,000. Last week we said there is a chance 23,000-23,250 comes into play if 22,000 is cleared over the near-term.
Fresh and key support is at 21,500 followed by 21,250-21,000. A close below the latter (and an adjusted uptrend channel) will likely lead to a further fade down to 20,500 and the 50-day moving average (20,544). Closes below these two levels would likely confirm a near-term peak.
The S&P 500 traded to a record high of 6,481 and came within 19 points of kissing our February upper end price target at 6,500 for the index. Closes above 6,500 would be bullish for ongoing strength towards 6,700-6,750.
Key support has moved up to 6,400 with 6,350 serving as backup. A drop below the latter and out of an adjusted uptrend channel off the August 1st low would be a slightly bearish development with risk down to 6,200 and the 50-day moving average.
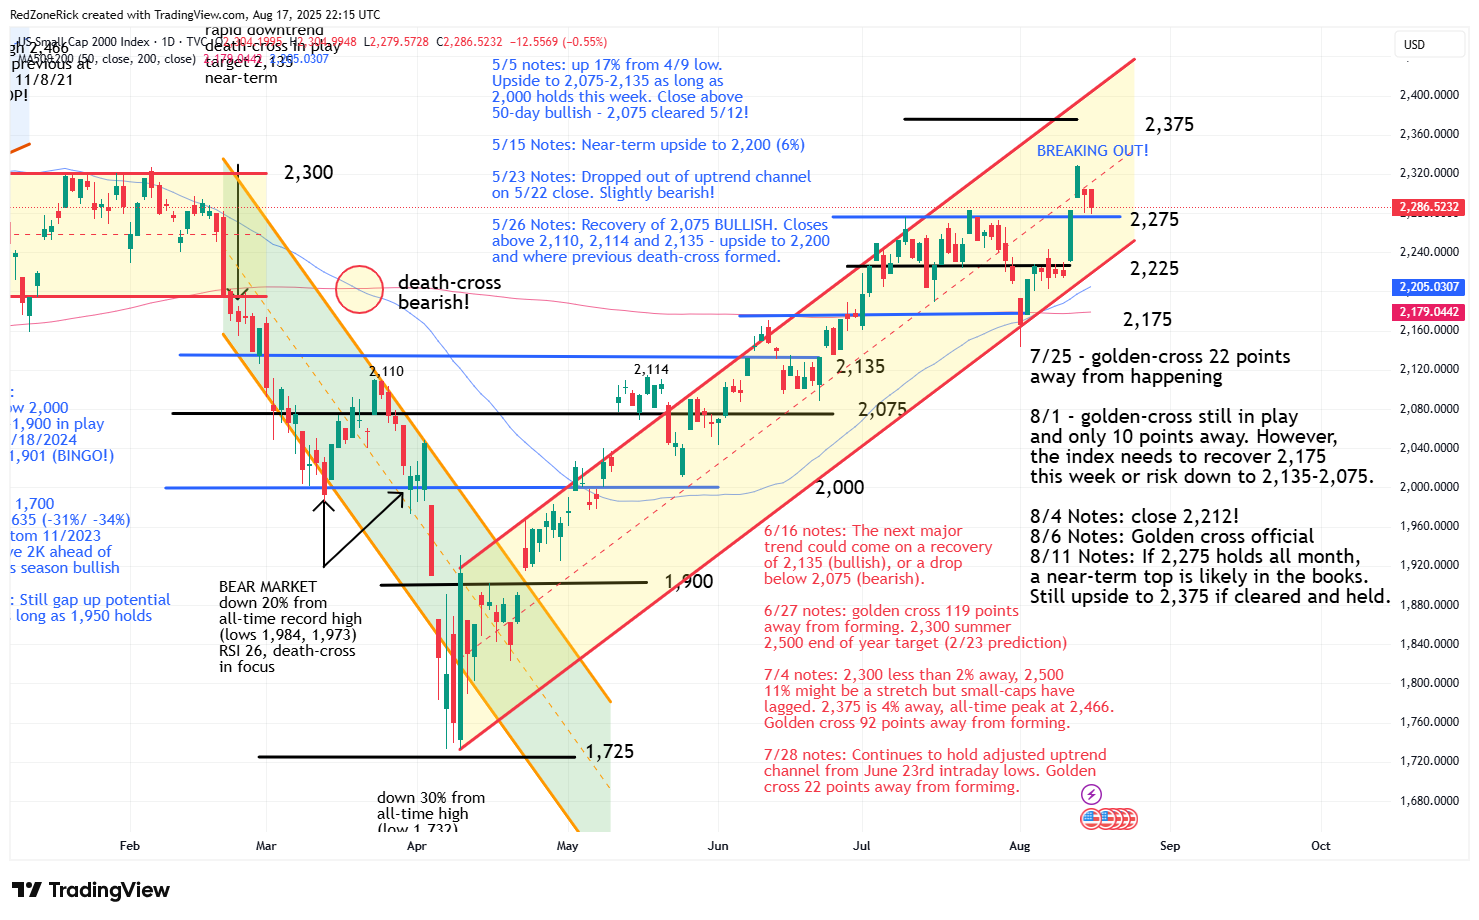
The Russell 2000 made a massive breakout on Tuesday and Wednesday with the midweek peak reaching 2,329. Our near-term target remains at 2,375 for the index with closes above this level getting all-time highs north of 2,400-2,450 in the mix.
Thursday’s close back below 2,300 at 2,299 was a premonition that a backtest to 2,275 was a given. The lows from Thursday and Friday tapped 2,279. A close below 2,275 likely gets 2,225 back in focus. The 50-day moving average is just above the 2,200 level.
The Dow (finally) reached a fresh record high of 45,203 but failed to hold 45,000 into the closing bell. The blue-chips are looking at a possible triple-top breakout, or breakdown, this week with multiple closes above this level being bullish for strength up to 47,250-50,000. The latter represents our February 23rd price target we predicted for the index.
A fade below 44,000, the 50-day moving average at 43,884, and out of the current uptrend channel would imply a further breakdown to 43,250-43,000 and the 200-day moving average.
The Volatility Index (VIX) had settled below 15 for three-straight sessions before Friday’s close back above this level. On July 4th, we predicted weakness down to 15-14.50 during earnings season with the market peaking at some point in August. Wednesday’s low hit 14.30. There is still a chance 13.50-12.75 comes into play on closes below 14.50-14.
Resistance is at 17-17.50 and the 50-day moving average. Backup help is at 19-19.50 and the 200-day moving average. Multiple closes above 20 would suggest a near-term market top.
There are now several layers of support the bears will need to crack to regain control of the market. The first layers are just below last Tuesday’s lows at Nasdaq 21,250; S&P 6,350; Dow 44,000 and Russell 2,225. Backup support
Levels from the July 16th intraday support levels for the major indexes are at Nasdaq 20,500; S&P 6,200; Dow 44,000 and Russell 2,175. We moved the Dow’s backup support level down to 43,250 last week and this remains the case.
The second-quarter earnings season continues to wind down as does the end of summer. There could be sporadic bursts to higher highs into month end with the next major battle likely coming when Wall Street gets back from vacation at the start of September.
Underperforming fund managers will need to decide if they want to chase higher highs while some of the more savvy traders might look to lock-in near-term profits. Either way, we are prepared to play the next major trend as the technical indicators continue to give us great clues.