
Dow, S&P 500 Turn Positive for 2025
- For the week, the Nasdaq zoomed 7.2% while the S&P soared 5.3%. The Dow jumped 3.4% and the Russell rose 4.3% with the former index joining the Nasdaq and the S&P in recovering its 200-day moving average.
- The ongoing v-shape recovery continues to produce nice uptrend channels for the major indexes with the possibility of fresh all-time highs coming at some point over the summer. Any pullbacks, or sudden surprises, will need to hold fresh support levels but the action off the April 7th lows remains bullish.
- Last week’s market rally pushed the Dow and S&P back into positive for the year. The Nasdaq is just 70 points from turning positive for 2025 while the Russell is 5% away, or 117 points, from turning green.
Friday’s market gains capped a big week for Wall Street as the 90-day tariff pause with China removed some uncertainty. Additionally, President Trump stated that the US will set tariff rates on other trading partners over the next few weeks.
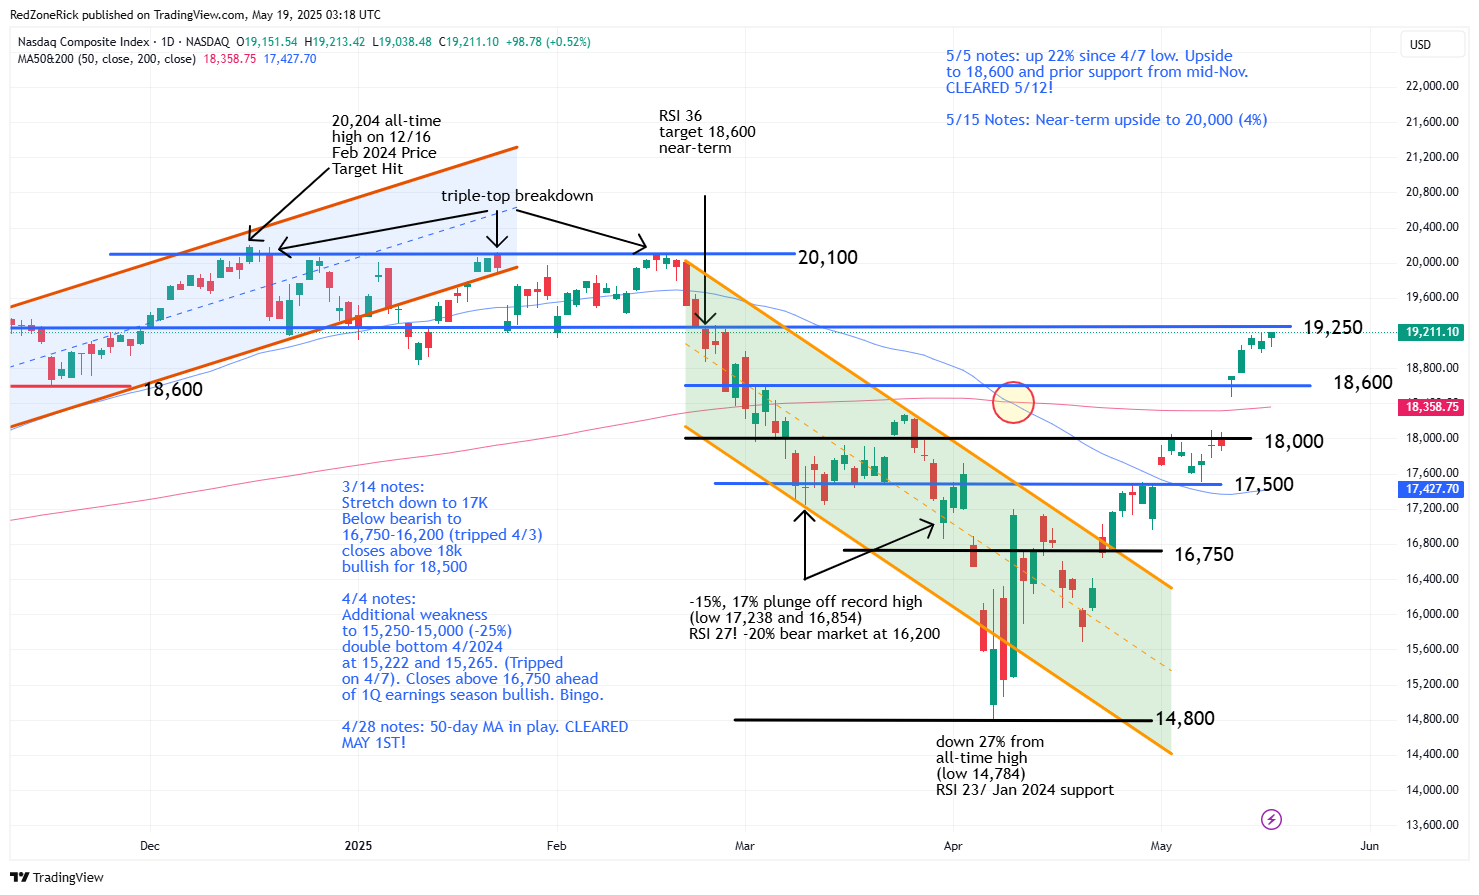
The Nasdaq settled 19,211 (+0.5%) after making an afternoon run to 19,213. Key resistance at 19,250 held. Support is at 19,000.
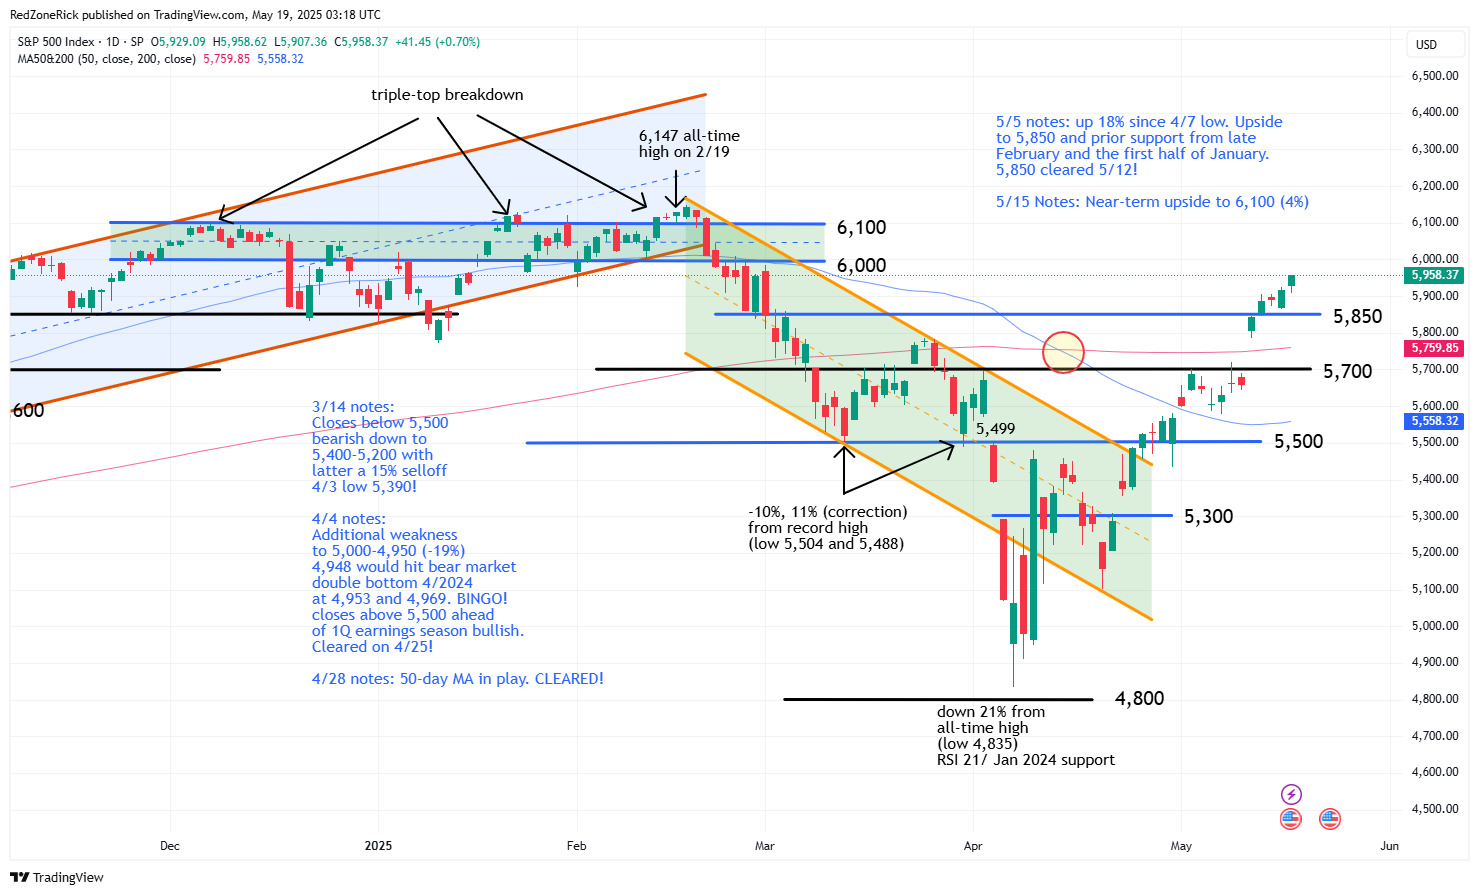
The S&P 500 ended on its session peak of 5,958 (+0.7%). Resistance at 5,950 was cleared and held. Support is at 5,900.
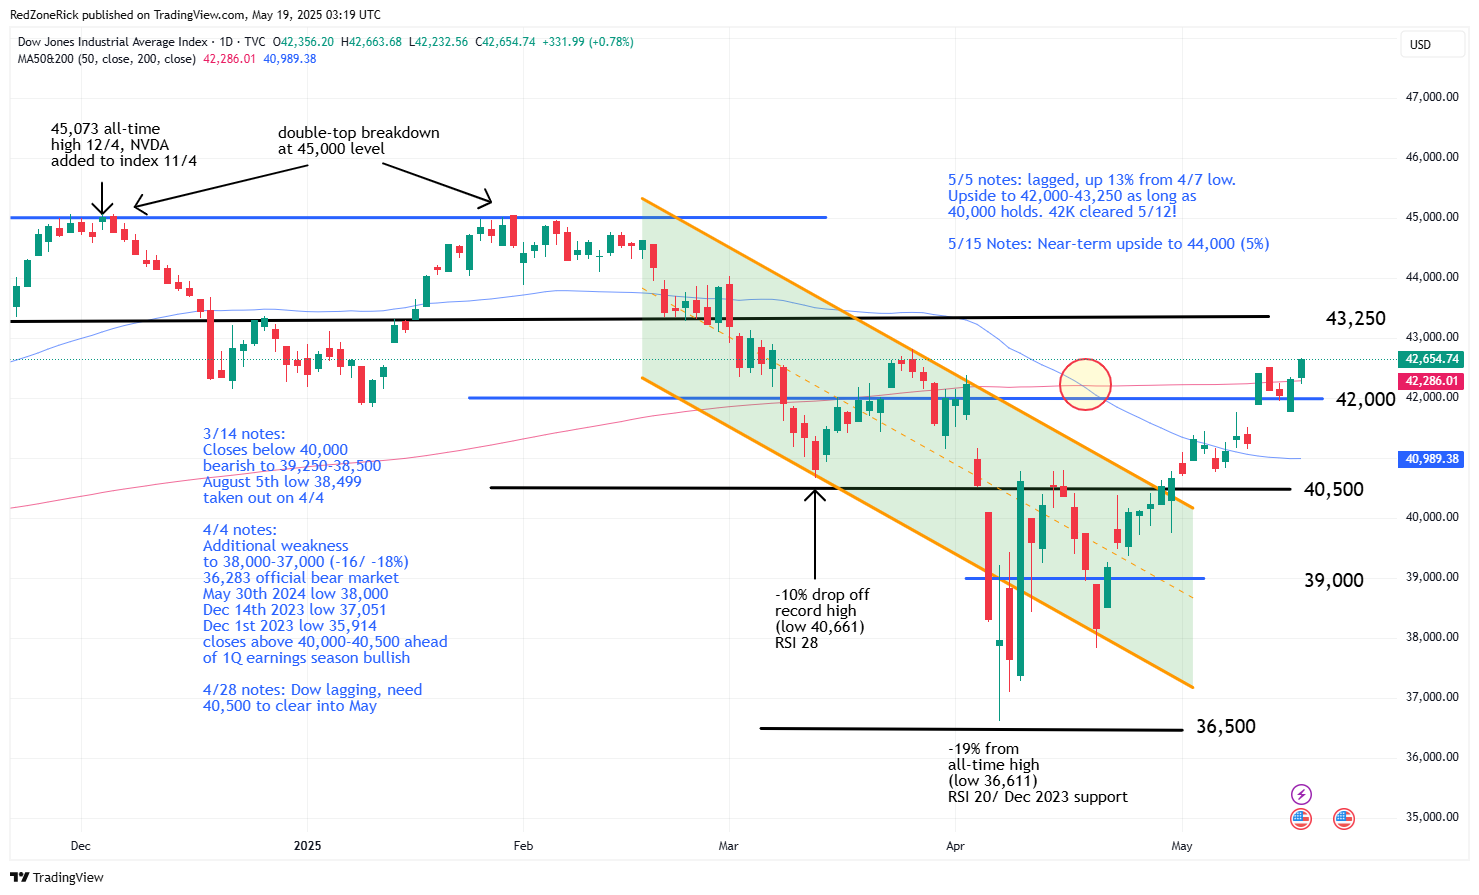
The Dow closed at 42,654 (+0.8%) with the high hitting 42,663. Resistance at 42,500 was reclaimed. Support is at 42,250.
Earnings and Economic News
Before the open: Compugen (CGEN), Gilat Satellite Networks (GILT), ZIM Integrated Shipping Services (ZIM)
After the close: 8×8 (RGHT), Agilysys (AGYS), Qifu Technology (QFIN), Safe Bulkers (SB), Trip.com Group (TCOM)
Economic News
Leading Indicators – 10:00am
Technical Outlook and Market Thoughts
For the week, the Nasdaq zoomed 7.2% while the S&P soared 5.3%. The Dow jumped 3.4% and the Russell rose 4.3% with the former index joining the Nasdaq and the S&P in recovering its 200-day moving average.
The ongoing v-shape recovery continues to produce nice uptrend channels for the major indexes with the possibility of fresh all-time highs coming at some point over the summer. Any pullbacks, or sudden surprises, will need to hold fresh support levels but the action off the April 7th lows remains bullish.
The Nasdaq has rallied 30% since the April 7th intraday low of 14,784 after being down 27% from its all-time high of 20,204. Continued closes above 19,250 gets upside to 19,500-20,000 in focus.
New support is at 19,000-18,750. A move back below 18,600 and the 200-day moving average (18,358) would suggest a near-term top with backtest potential to 18,250-18,000.
The S&P extended its winning streak to five-straight sessions and is up 23% from its early April low of 4,835. The action follows a 21% selloff from the mid-February all-time peak at 6,147. Continued closes above 5,950 would indicate ongoing strength towards 6,000 and prior support from late February.
New and rising support is at 5,900-5,850. A close back below the latter would be a slightly bearish development with further weakness down to 5,750-5,700 and the 200-day moving average.
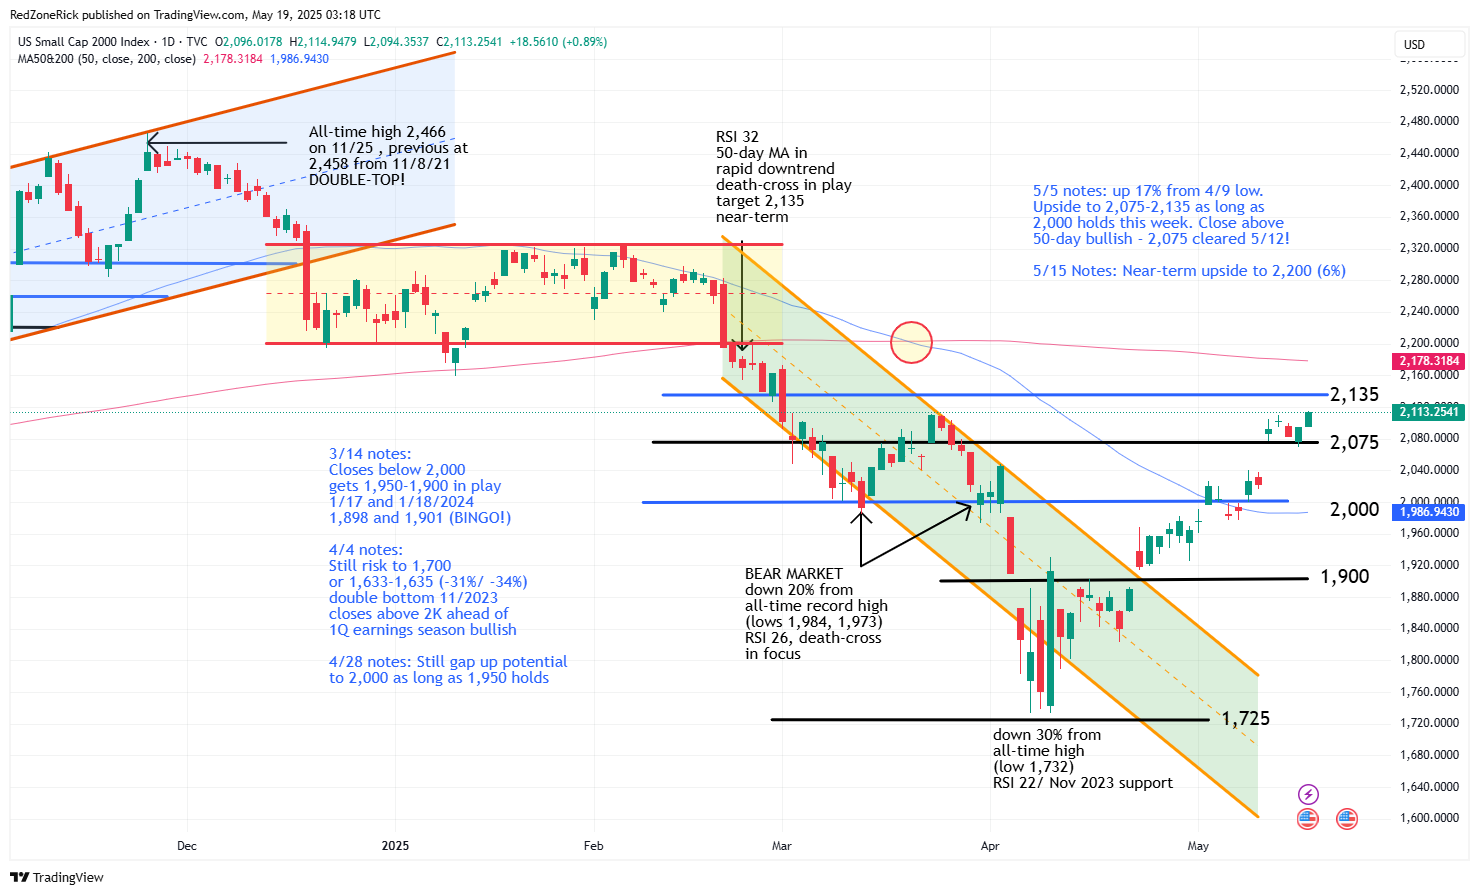
The Russell 2000 has jumped 22% from its April 9th intraday low of 1,732. The small-caps were up 0.9% on Friday and have made up two-thirds of the 30% drubbing from its all-time high of 2,466 set last November. The close at 2,113 keeps strength to 2,135-2,175 and the 200-day moving average in play.
Key support is at 2,075. A close back below this level has gap down risk to 2,050-2,000 and a flattening 50-day moving average.
The Dow has lagged the other major indexes in the current v-shape recovery but is still higher by 17% from its early April bottom at 36,611. The blue-chips were down 19% from the December 4th lifetime top at 45,073 after the first week of April. The next waves of resistance are at 42,750-43,250 on continued closes above the 200-day moving average.
Current support is at 42,000-41,750. A close below the latter would reopen weakness to 41,500-41,000 and the 50-day moving average.
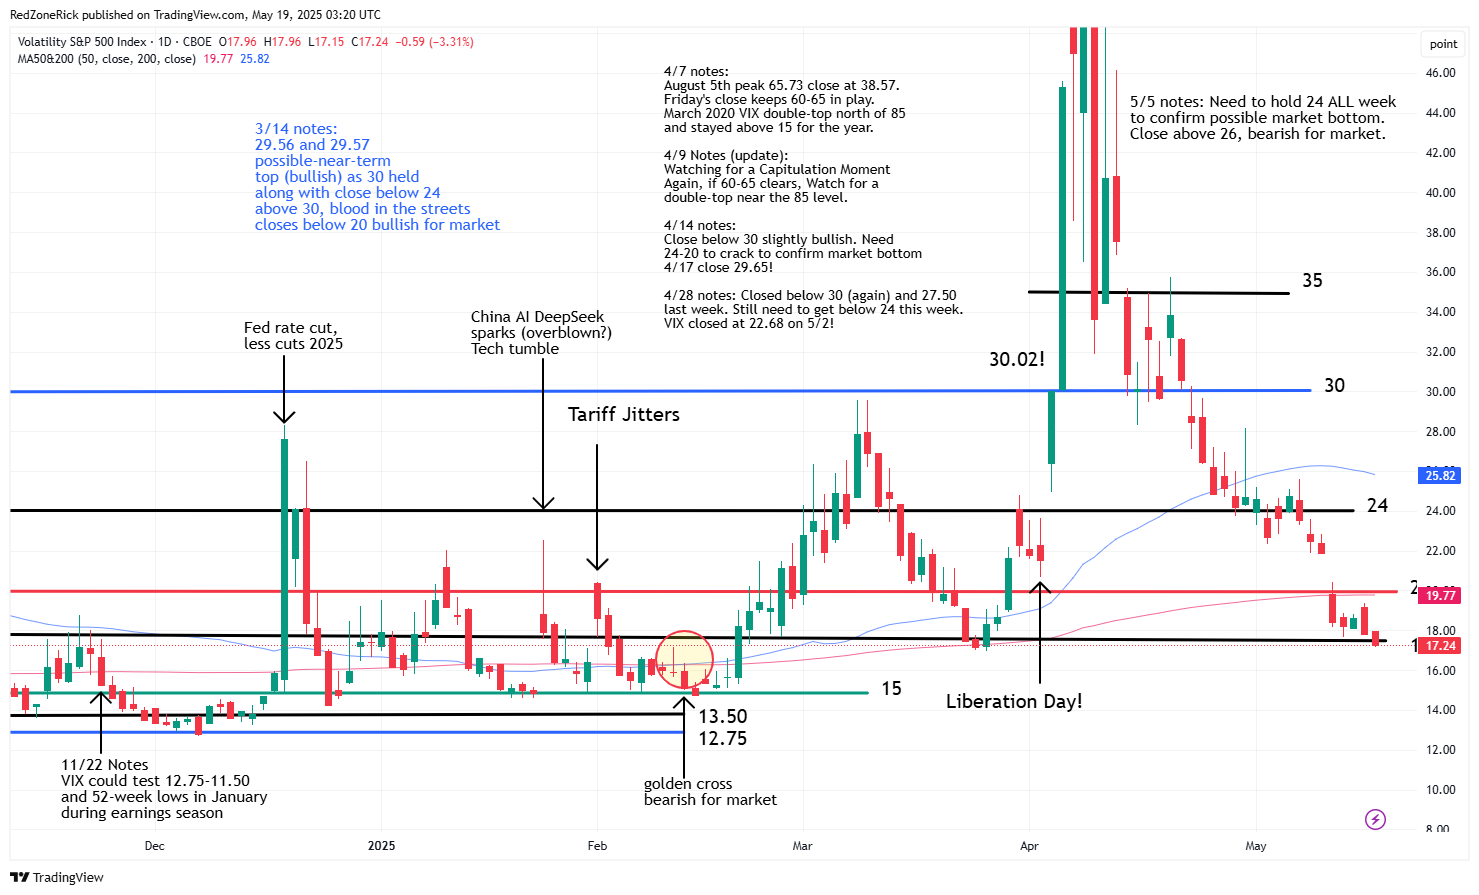
The Volatility Index (VIX) closed below 17.50 on Friday and this was a bullish sign heading into this week. Continued closes below this level will be very bullish for the market going forward and over the summer. At some point, if the major indexes do make a run at all-time highs, the VIX could trade down to 15-12.75.
Resistance is at 20 and the 200-day moving average with stretch potential to 22.50 if these levels are cleared. A close above 24-26 and the 50-day moving average would be the very first clues of a near-term market top.
Last week’s market rally pushed the Dow and S&P back into positive for the year. The Nasdaq is just 70 points from turning positive for 2025 while the Russell is 5% away, or 117 points, from turning green.