Employment Data and 2020 Budget Inform Market
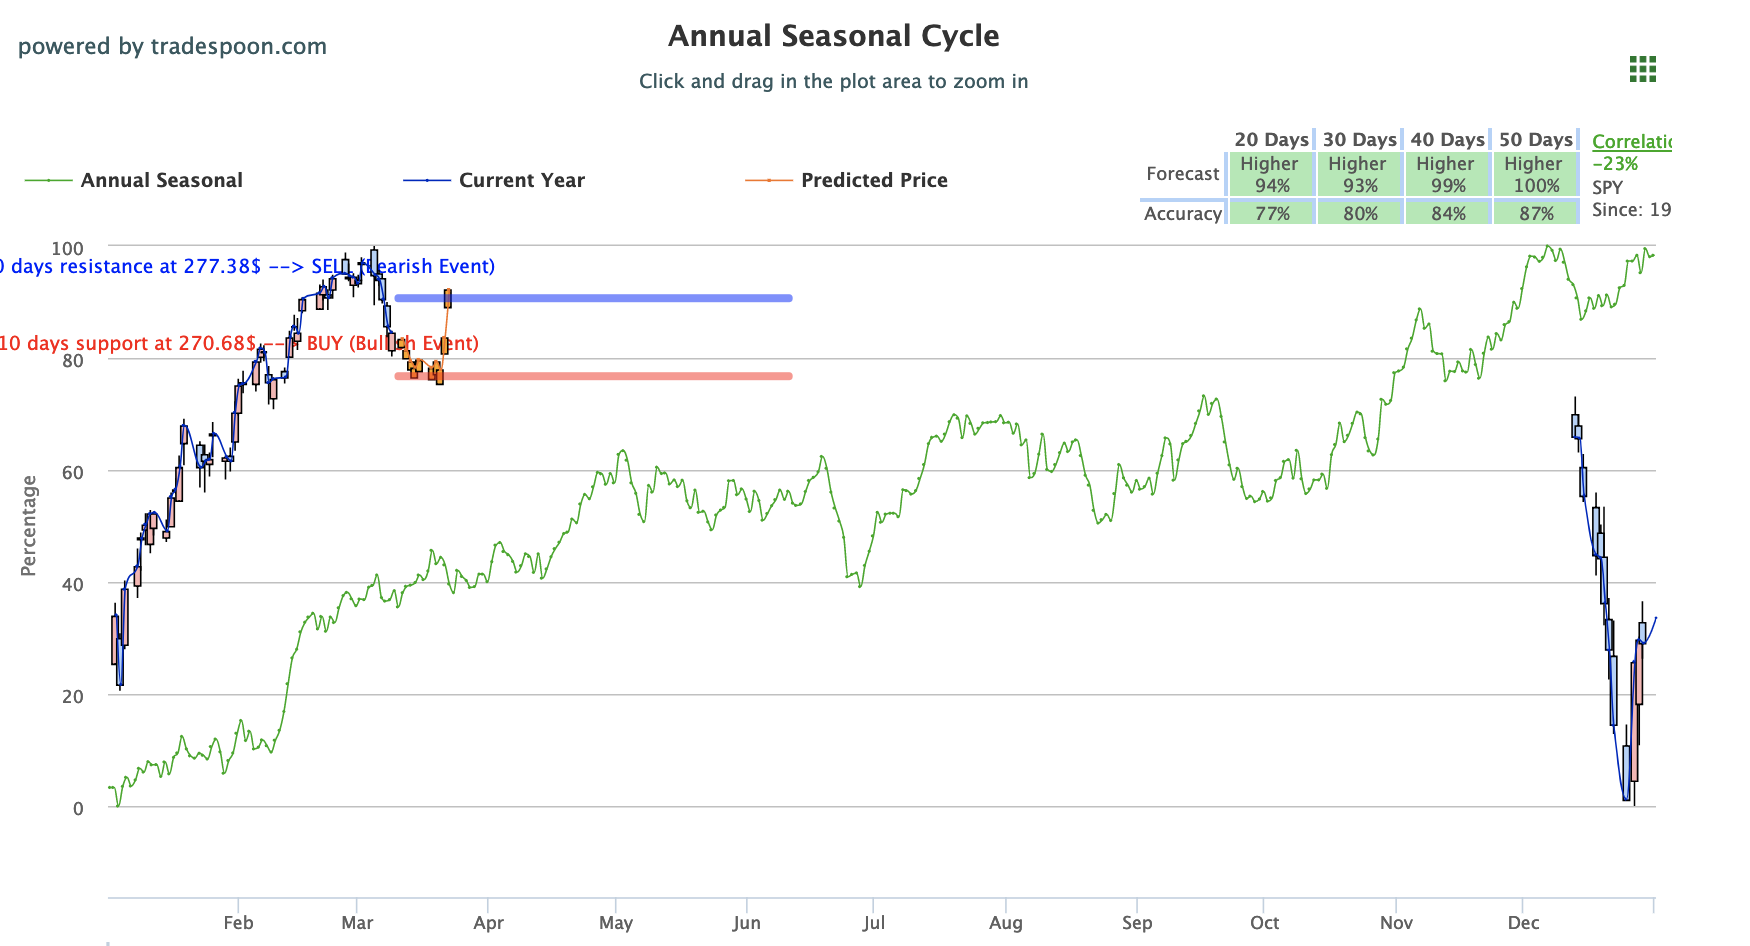
All three major indices are riding nice gains as sentiment around Friday’s low employment-data turns from troubling to promising. The low number of jobs added in February, coupled with rising wages, indicates a full workforce while this week’s release of retail and spending numbers will provide a good barometer of consumer market. Other news to follow this week includes the continued China-U.S. trade negotiations, Boeing’s decline after a fatal plane crash, and President Trump’s 2020 budget proposal. We encourage our highly-valued members to avoid chasing the rallies and monitor our proprietary tools for prime entry and exit positions. Monitor SPY 200-day moving average, currently at $275, for a good gauge of market direction; we are above the 200-day moving average but still could see a retrace to $268 level if we fall below this level for the SPY. Still, we are bullish in the long term and could see the SPY reaching a 52-week high before June. For reference, the SPY Seasonal Chart is shown below:

On Friday, employment data for February returned drastically lower than it has been in years. The lowest month in over 10 years, February saw only 20,000 jobs added, staunchly down form 180,000 that was projected. An initial reading of the data was troubling as employment continued to be a strong pillar of the economy for the last few years. However, after worried sentiment cooled off, the lack of jobs added coupled with rising wages, both hourly and year over year, proved to be a positive for the economy as investors are now interpreting the data to show a full workforce that is expanding and improving. Unemployment, once again, fell below 4%.
Look for more weekly employment data at week’s end as investor focus turns to retail data this week. Key inflation reading will release tomorrow along with February CPU, Producer Price Index on Wednesday, and Consumer Sentiment on Friday. Earnings are slim this week with Dick’s Sporting Goods tomorrow and Adobe on Thursday.
Boeing is taking a big hit after an Ethiopian Airline crash over the weekend featured one of their planes and saw over 100 casualties. An investigation on the crash, which happened directly after liftoff, is taking place while Boeing shares are down over 6%. This is noticeably weighing on the Dow, which currently is holding on the lowest gains of the three major indices for today, as Boeing is a major player in the index.
Once more, border security and funding is in the spotlight as Trump has put forth his 2020 budget plans. Though widely considered as a blueprint and only the beginning of negotiations, these plans look to cut down spending and even remove certain domestic programs. Military and border security are seeing large increases in spending, with $8.6 billion allocated for the wall, while cutting over $2 trillion in nondefense spending. Other notable numbers from this plan include $80 billion added for veterans, $2 trillion cut between Medicare and Medicaid, and $25 billion cut in social security spending. Public student loans, Temporary Assistance for Needy Families, and food stamps are also seeing large cuts. The new budget year begins on October 1st.
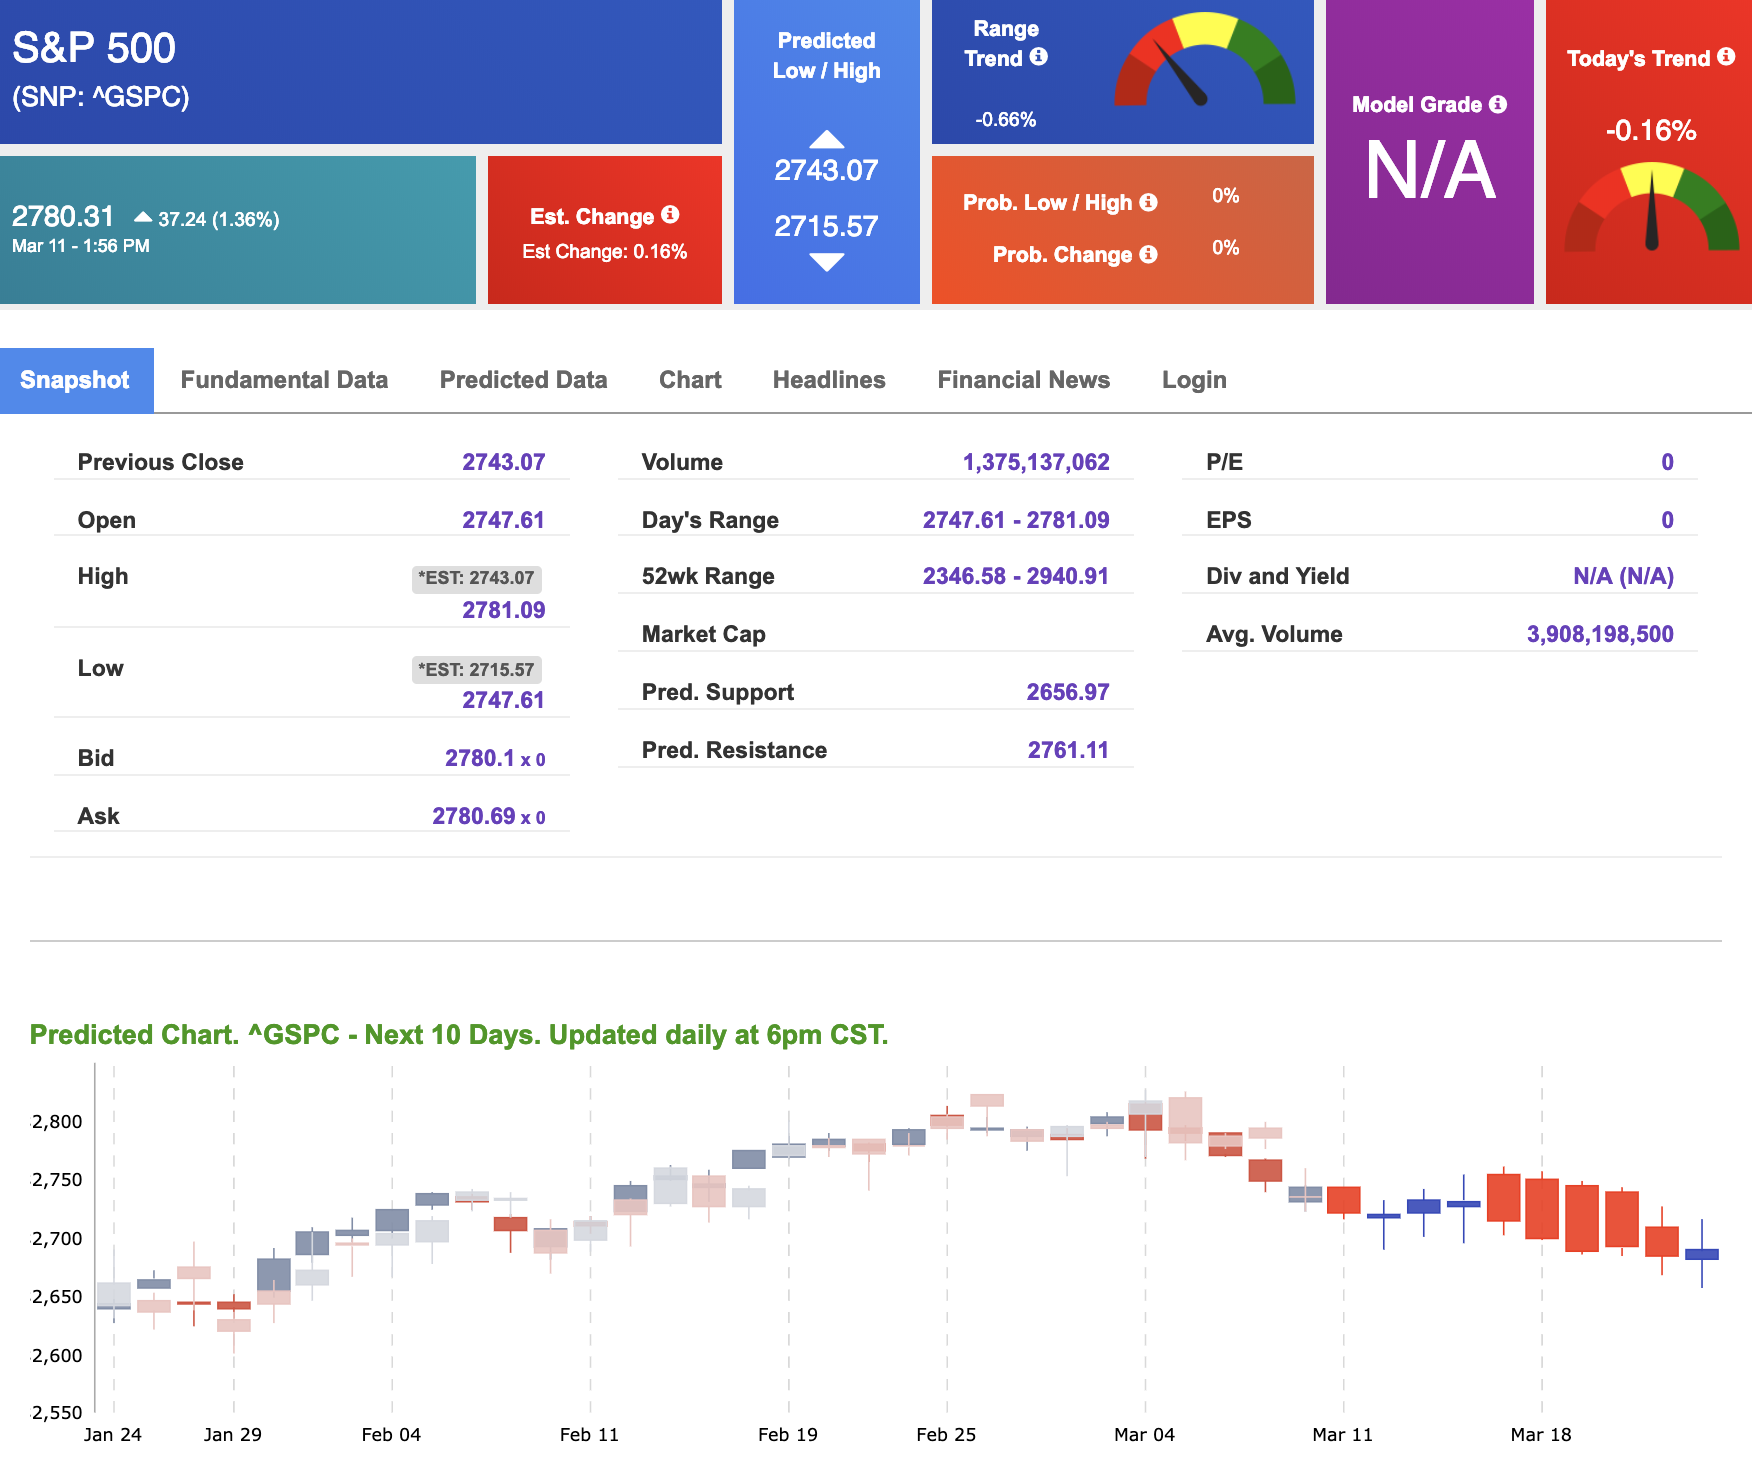
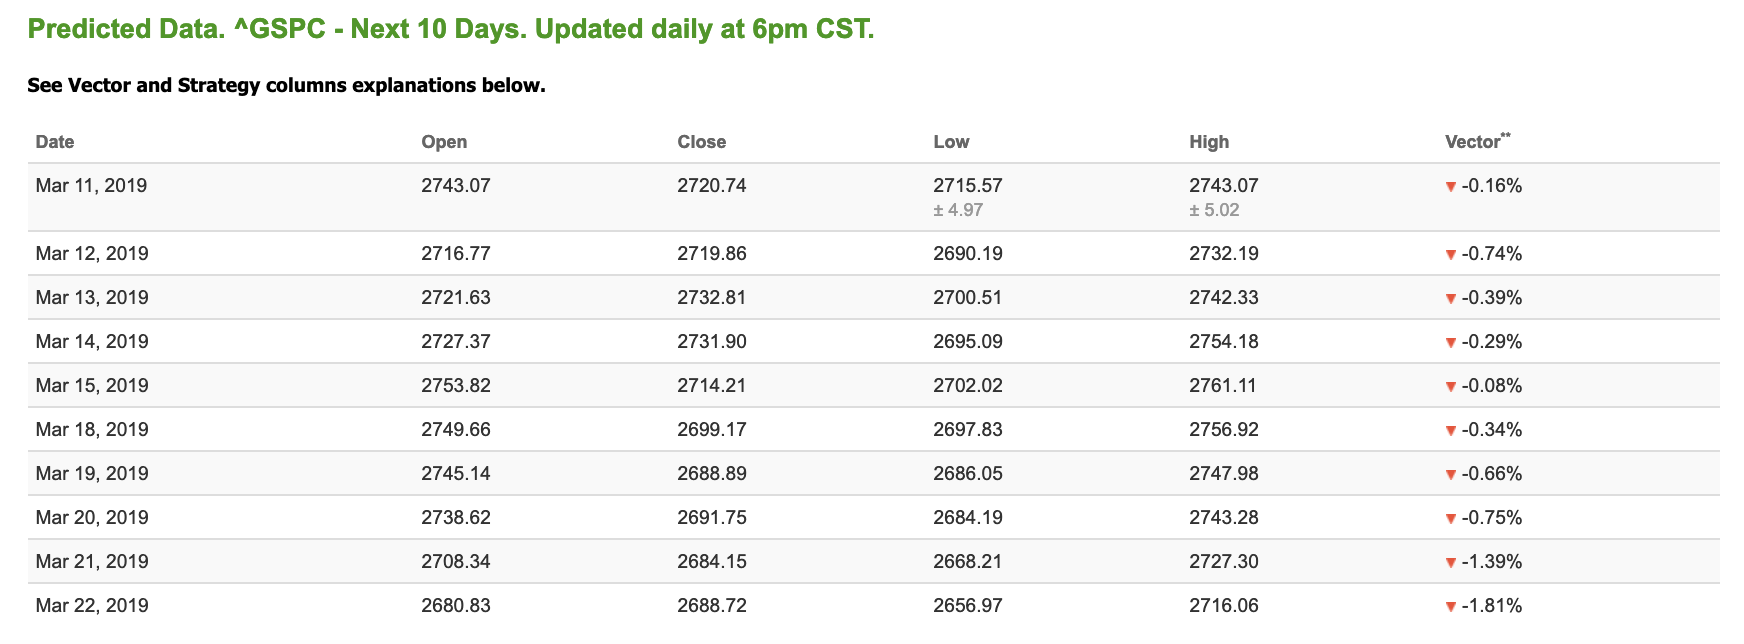
Using the “^GSPC” symbol to analyze the S&P 500, our 10-day prediction window shows negative signals. Today’s vector figure of -0.16% moves to -0.34% in five trading sessions. The predicted close for tomorrow is 2,719.86. Prediction data is uploaded after the market close at 6 p.m., CST. Today’s data is based on market signals from the previous trading session.
March Madness Offer!
LIFETIME ACCESS to our Tools Membership for less than the regular price we normally charge for a 1-year membership.
Bonus: ActiveTrader & MonthlyTrader Lifetime Access
(Daily Stock & Option Trade Recommendations)
You Don’t Want to Miss This!
Offer Ends Midnight Tonight.
Click Here to Sign Up
Highlight of a Recent Winning Trade
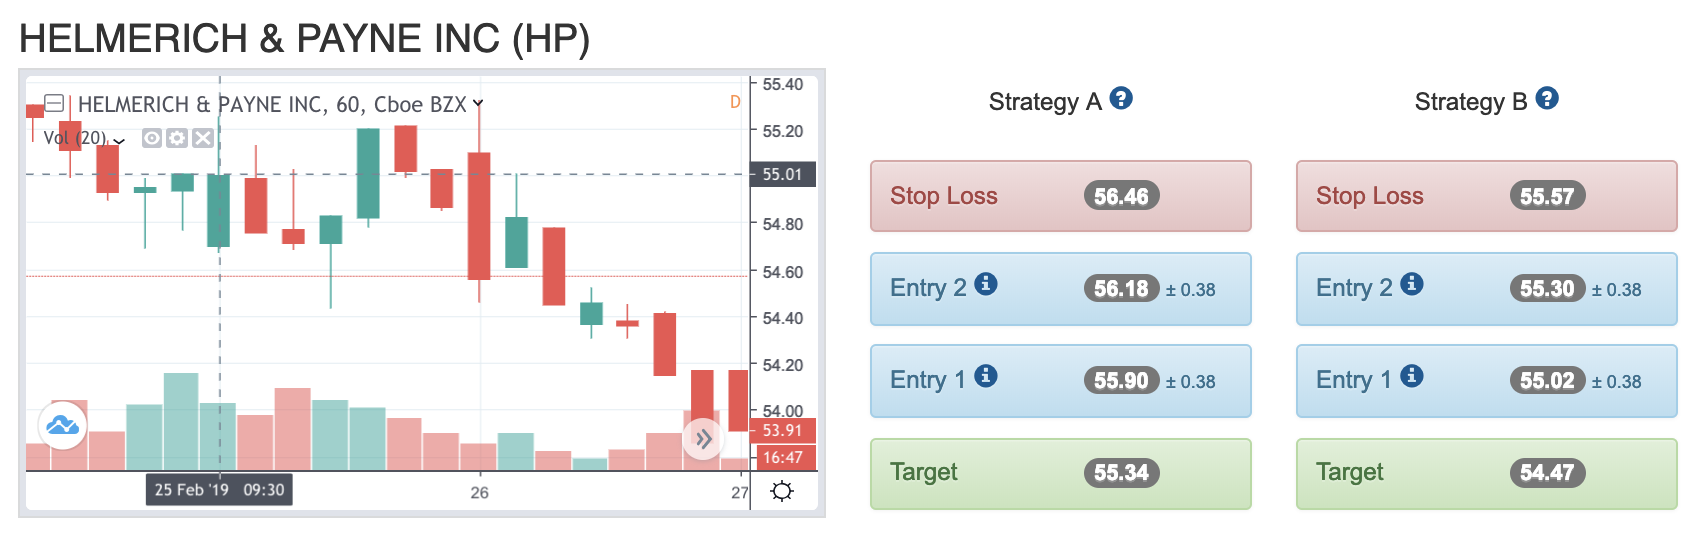
On February 25th, our ActiveTrader service produced a bearish recommendation for Helmerich & Payne Inc (HP). ActiveTrader is included in all paid Tradespoon membership plans and is designed for day trading.
Trade Breakdown
HP entered its forecasted Strategy B Entry 1 price range $55.02 (± 0.38) in its first hour of trading and passed through its Target price $54.47 in the first hour of trading the following day. The Stop Loss price was set at $55.57
Tuesday Morning Featured Stock
*Please note: Our featured stock is part of your free subscription service. It is not included in any paid Tradespoon subscription service. Vlad Karpel only trades his own personal money in paid subscription services. If you are a paid subscriber, please review your Premium Member Picks, ActiveTrader or MonthlyTrader recommendations. If you are interested in receiving Vlad’s personal picks, please click here.
Our featured stock for Tuesday is Facebook (FB). FB is showing a confident vector trend in our Stock Forecast Toolbox’s 10-day forecast. This stock is assigned a Model Grade of (B) indicating it ranks in the top 25th percentile for accuracy for predicted support and resistance, relative to our entire data universe.
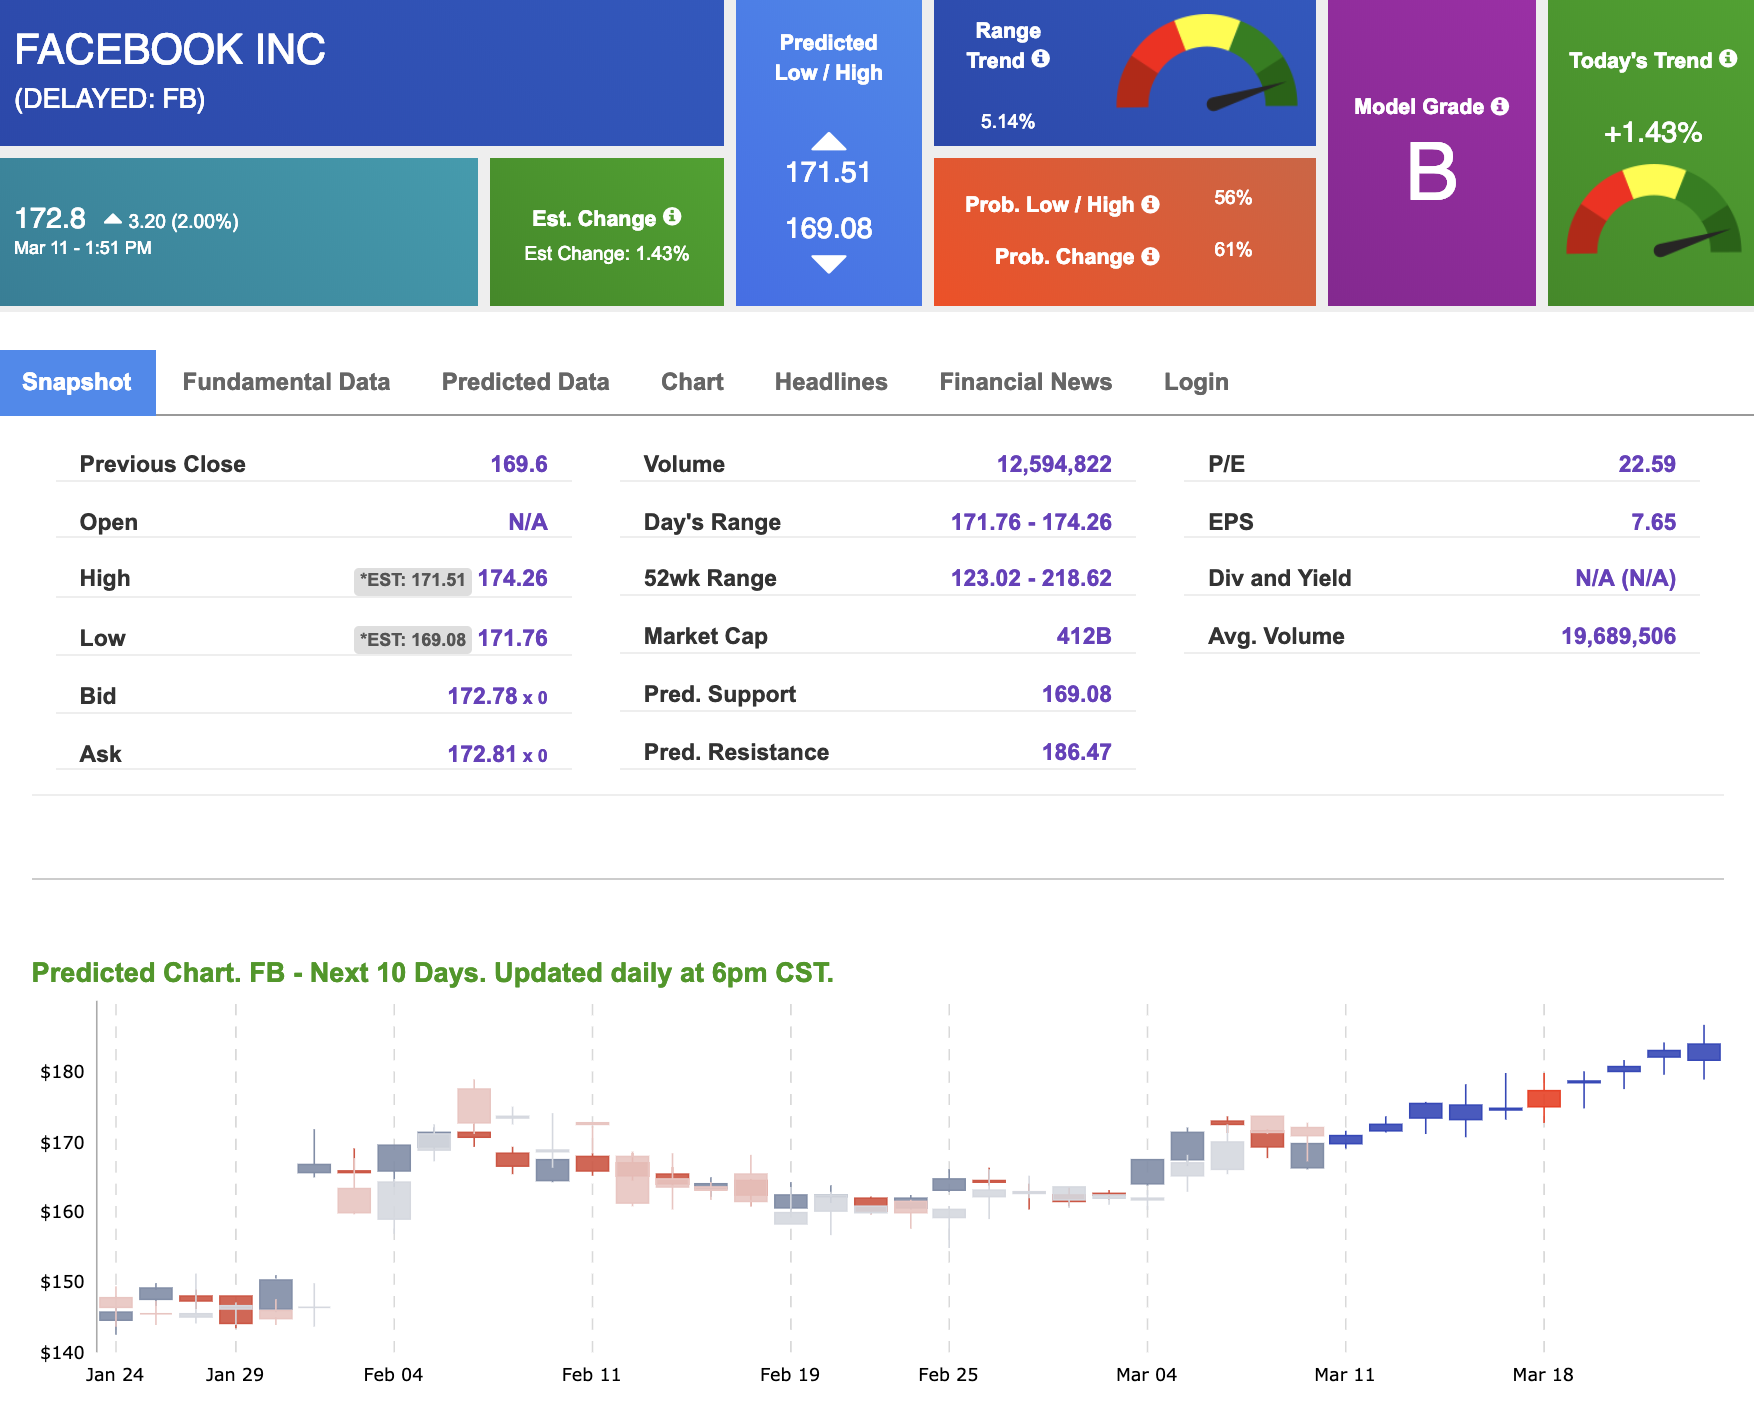
The stock is trading at $172.8 at the time of publication, up 2.00% from the open with a +1.43% vector figure.
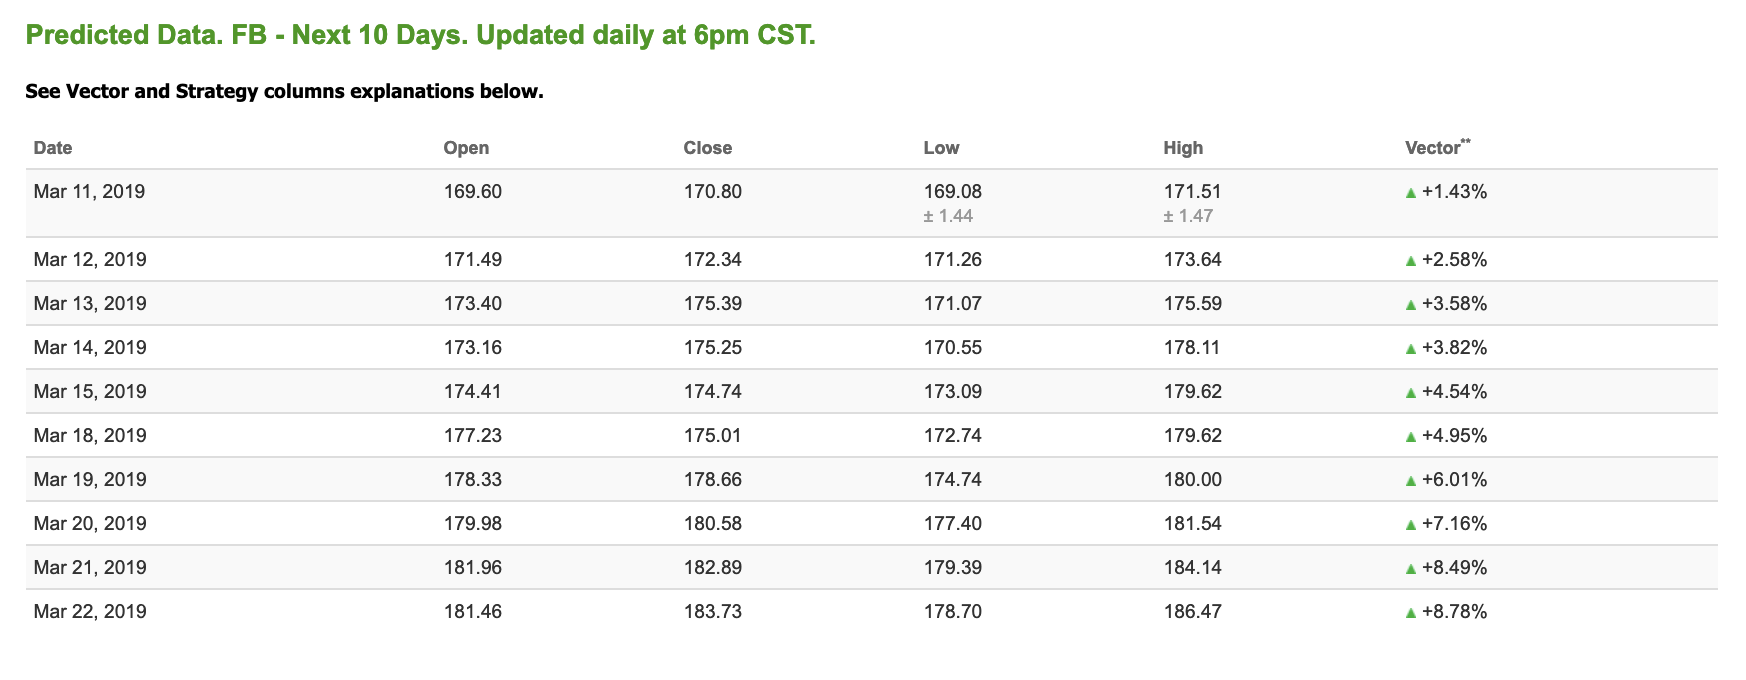
Prediction data is uploaded after market close at 6 p.m., CST. Today’s data is based on market signals from the previous trading session.
Note: The Vector column calculates the change of the Forecasted Average Price for the next trading session relative to the average of actual prices for the last trading session. The column shows expected average price movement “Up or Down”, in percent. Trend traders should trade along the predicted direction of the Vector. The higher the value of the Vector the higher its momentum.
Oil
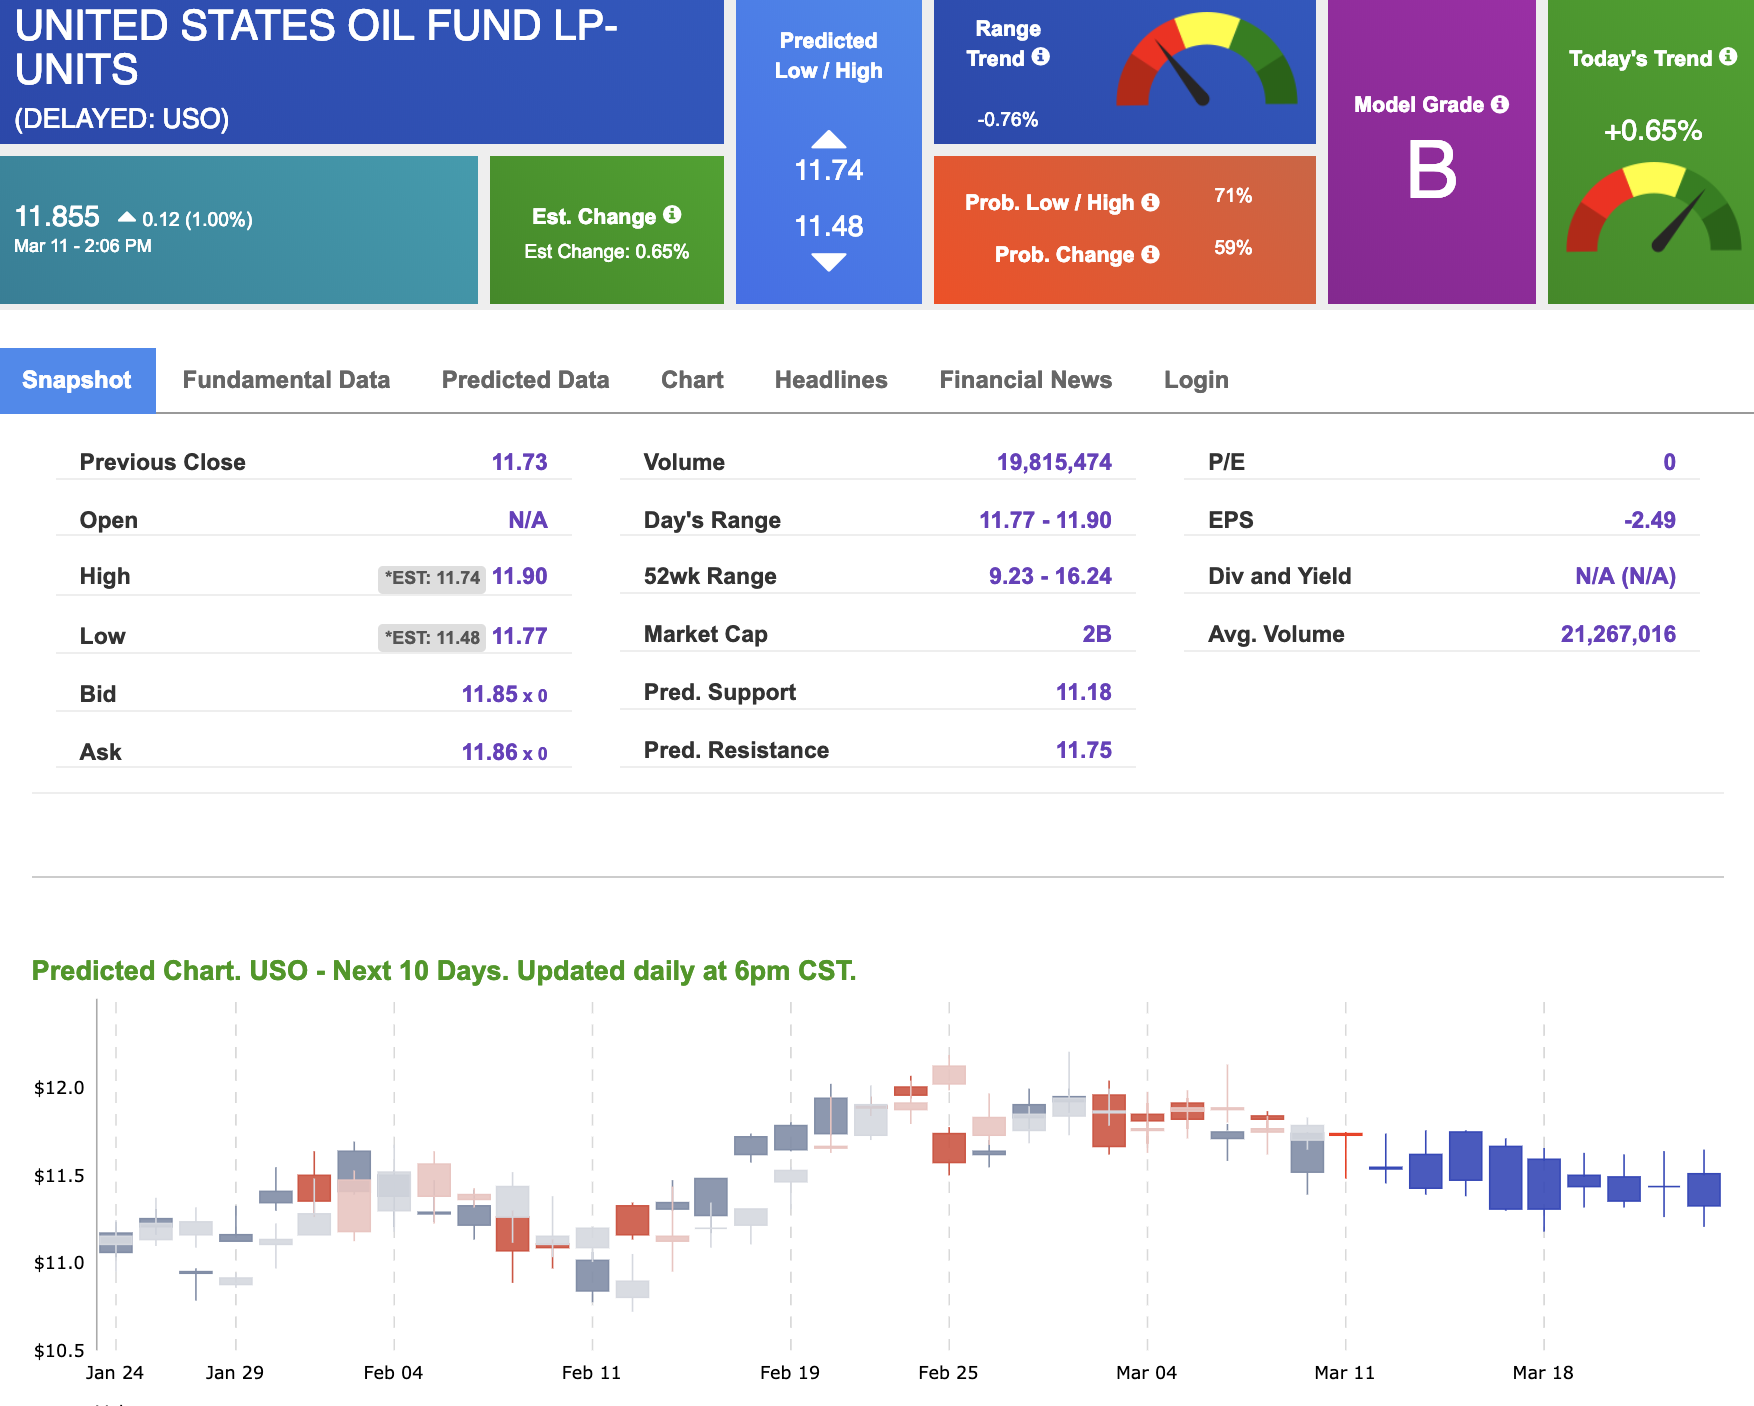
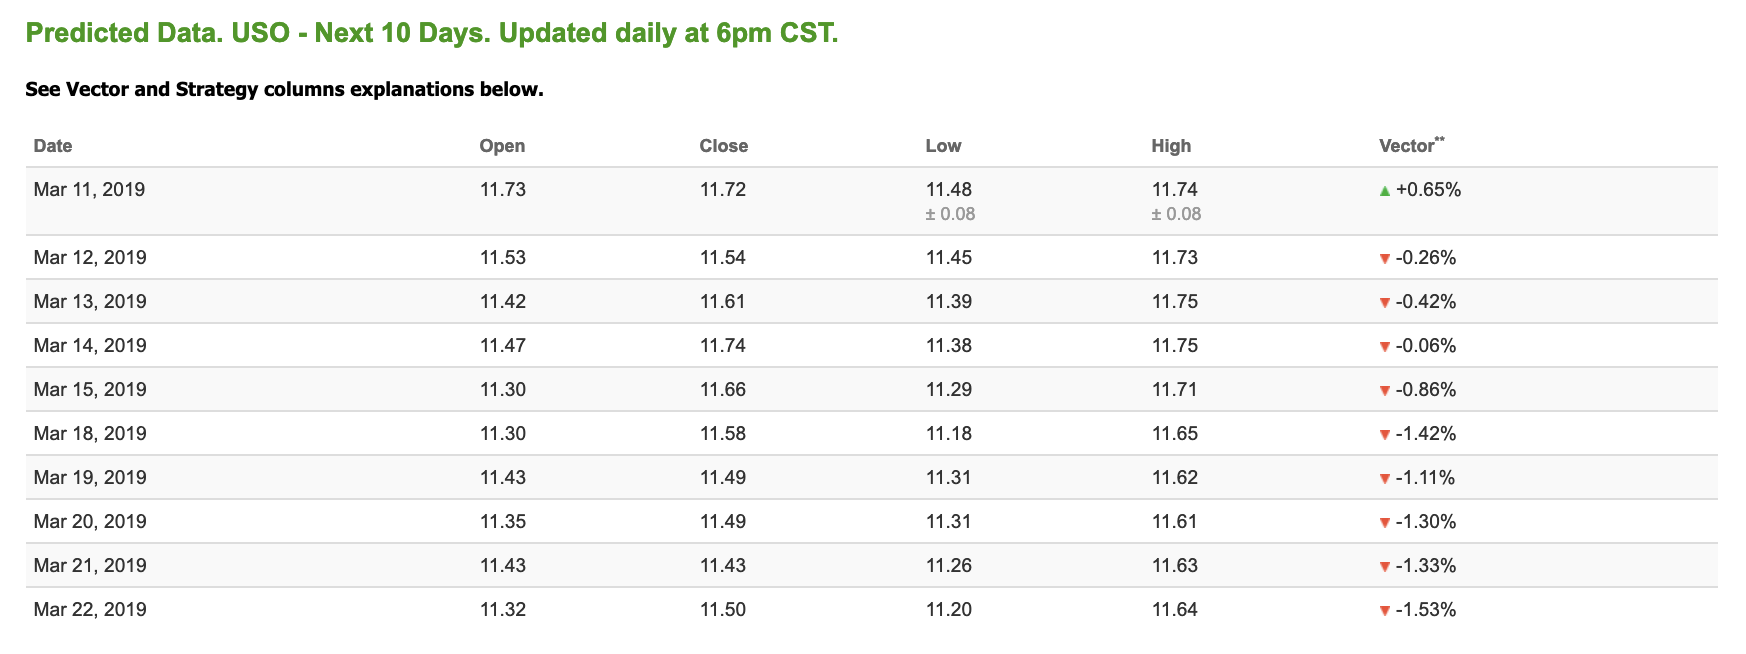
West Texas Intermediate for April delivery (CLJ9) is priced at $56.83 per barrel, up 1.34% from the open, at the time of publication. Looking at USO, a crude oil tracker, our 10-day prediction model shows negative signals. The fund is trading at $11.85 at the time of publication, up 1.00% from the open. Vector figures show +0.65% today, which turns -1.42% in five trading sessions. Prediction data is uploaded after market close at 6 p.m., CST. Today’s data is based on market signals from the previous trading session.
Gold
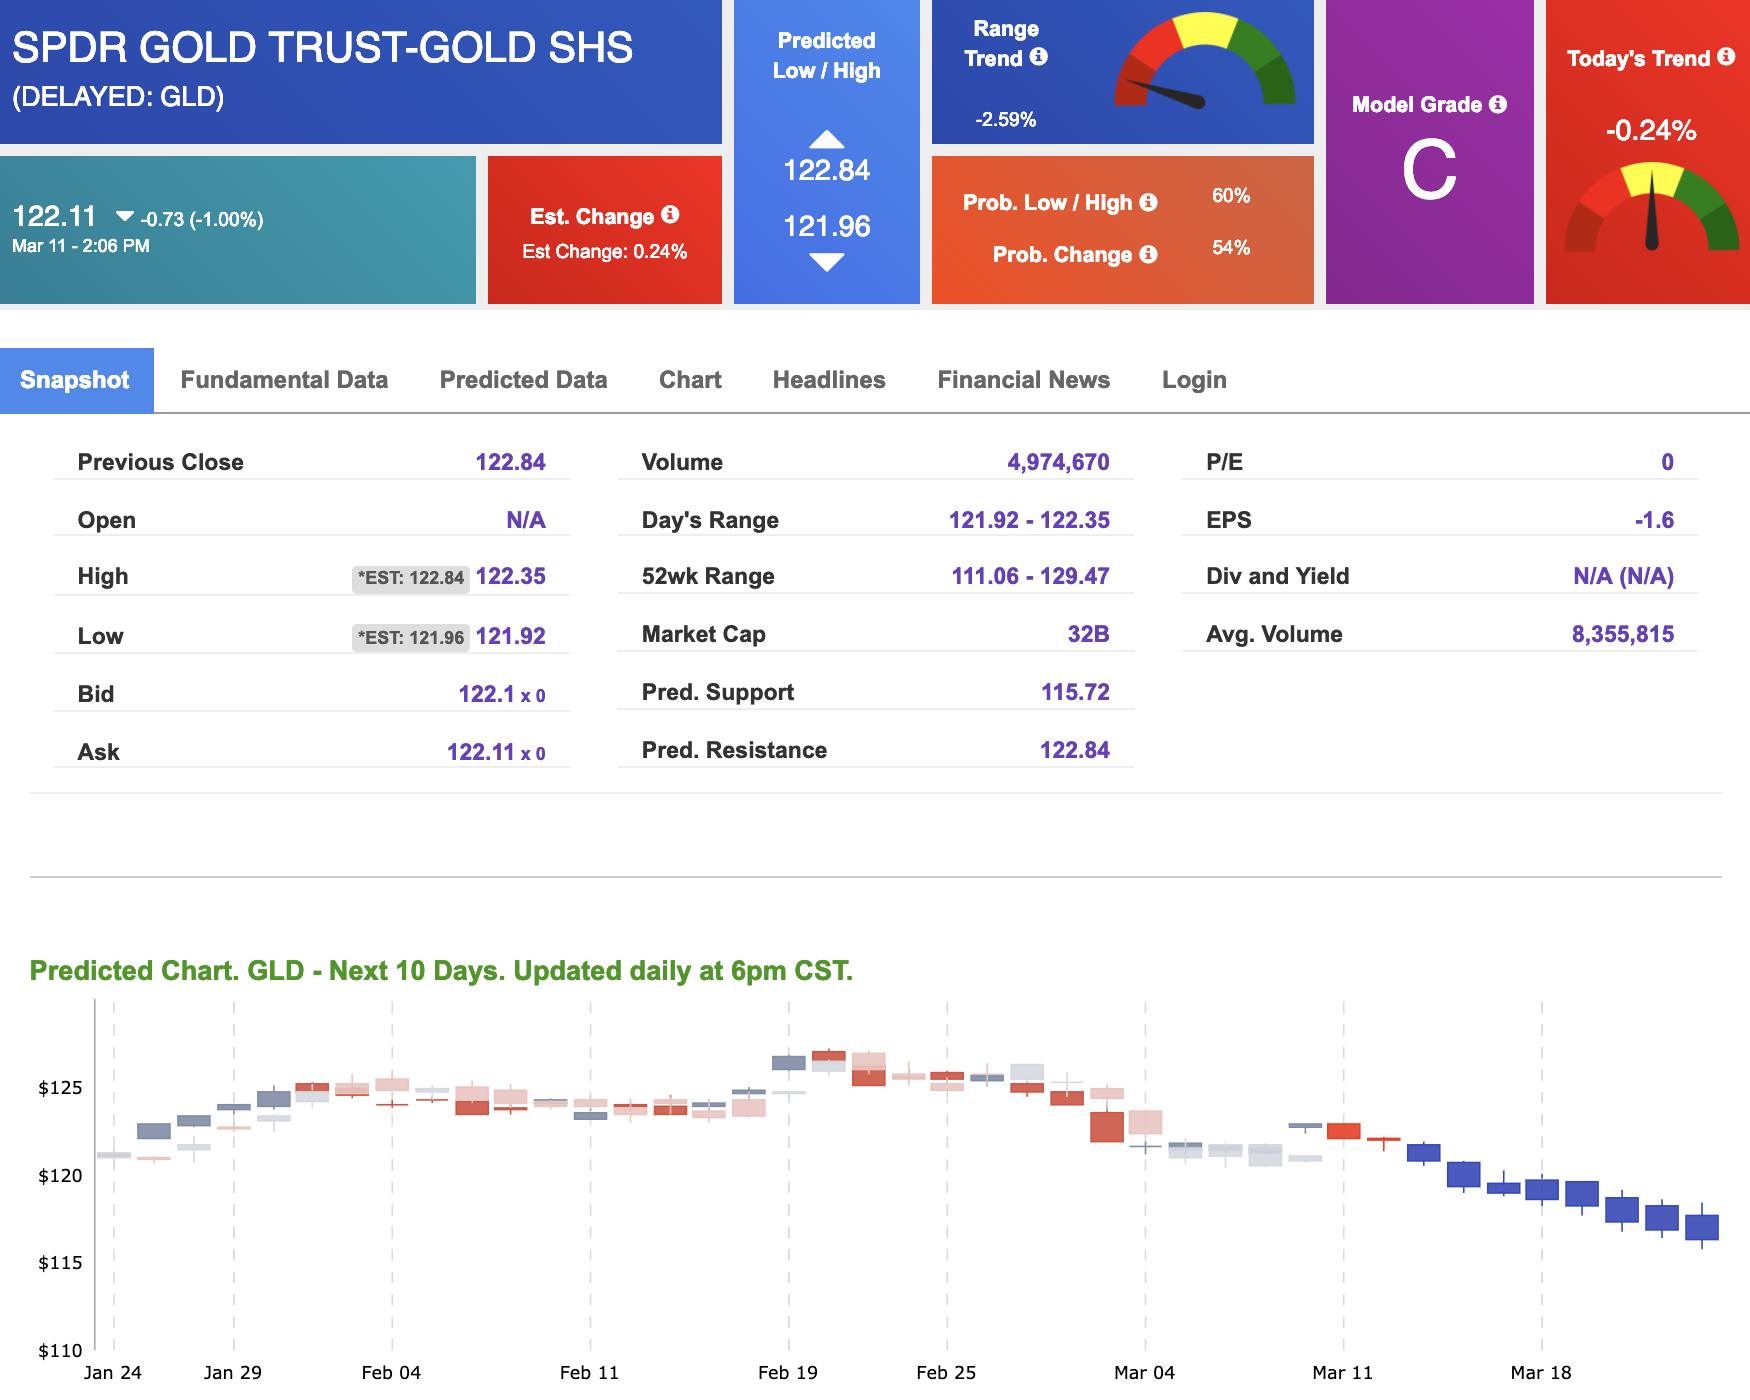
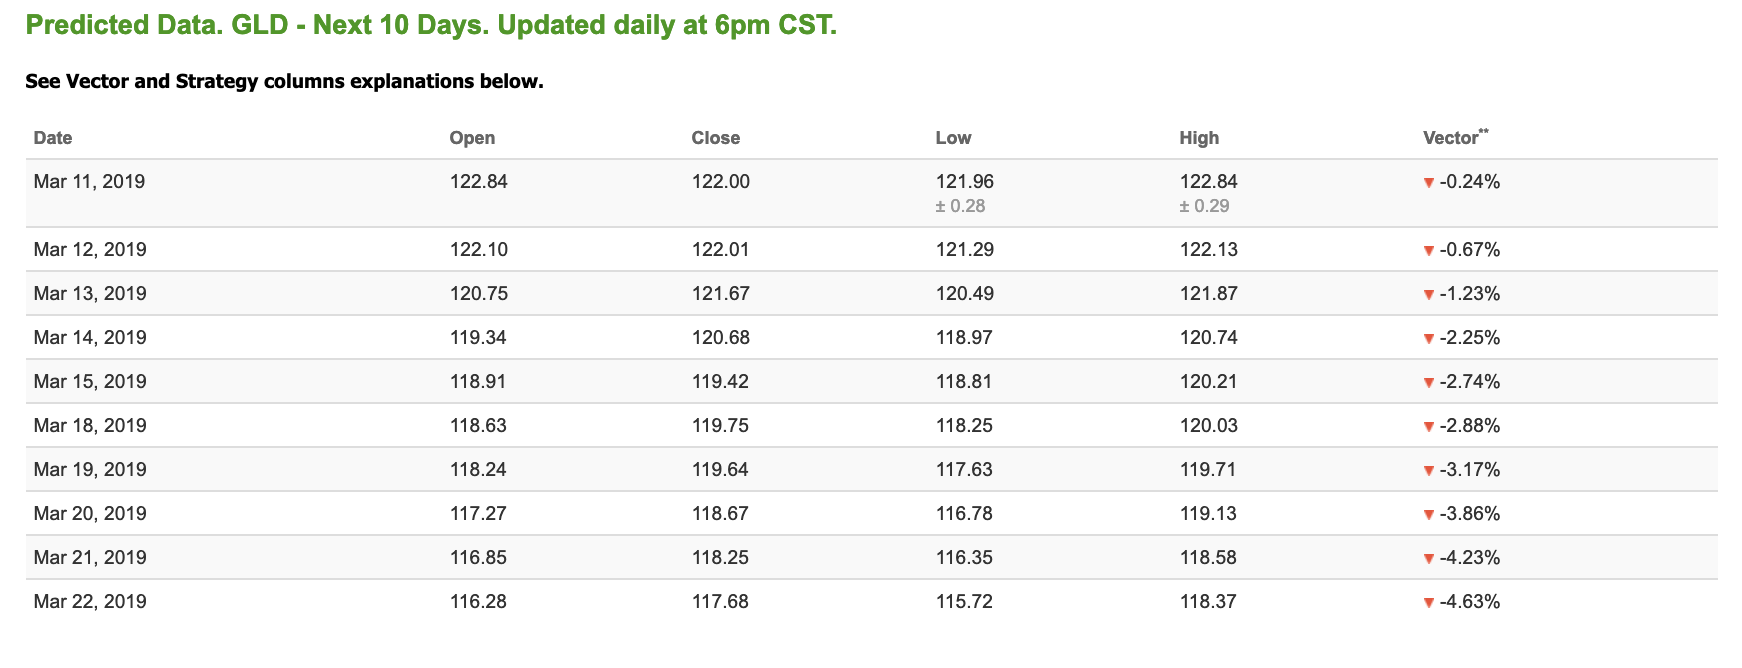
The price for April gold (GCJ9) is down 0.49% at $1,292.90 at the time of publication. Using SPDR GOLD TRUST (GLD) as a tracker in our Stock Forecast Tool, the 10-day prediction window shows all negative signals. The gold proxy is trading at $122.11, down 1.00% at the time of publication. Vector signals show -0.24% for today. Prediction data is uploaded after market close at 6 p.m., CST. Today’s data is based on market signals from the previous trading session.
Treasuries
The yield on the 10-year Treasury note is up 0.24% at 2.64% at the time of publication. The yield on the 30-year Treasury note is up 0.53% at 3.03% at the time of publication.
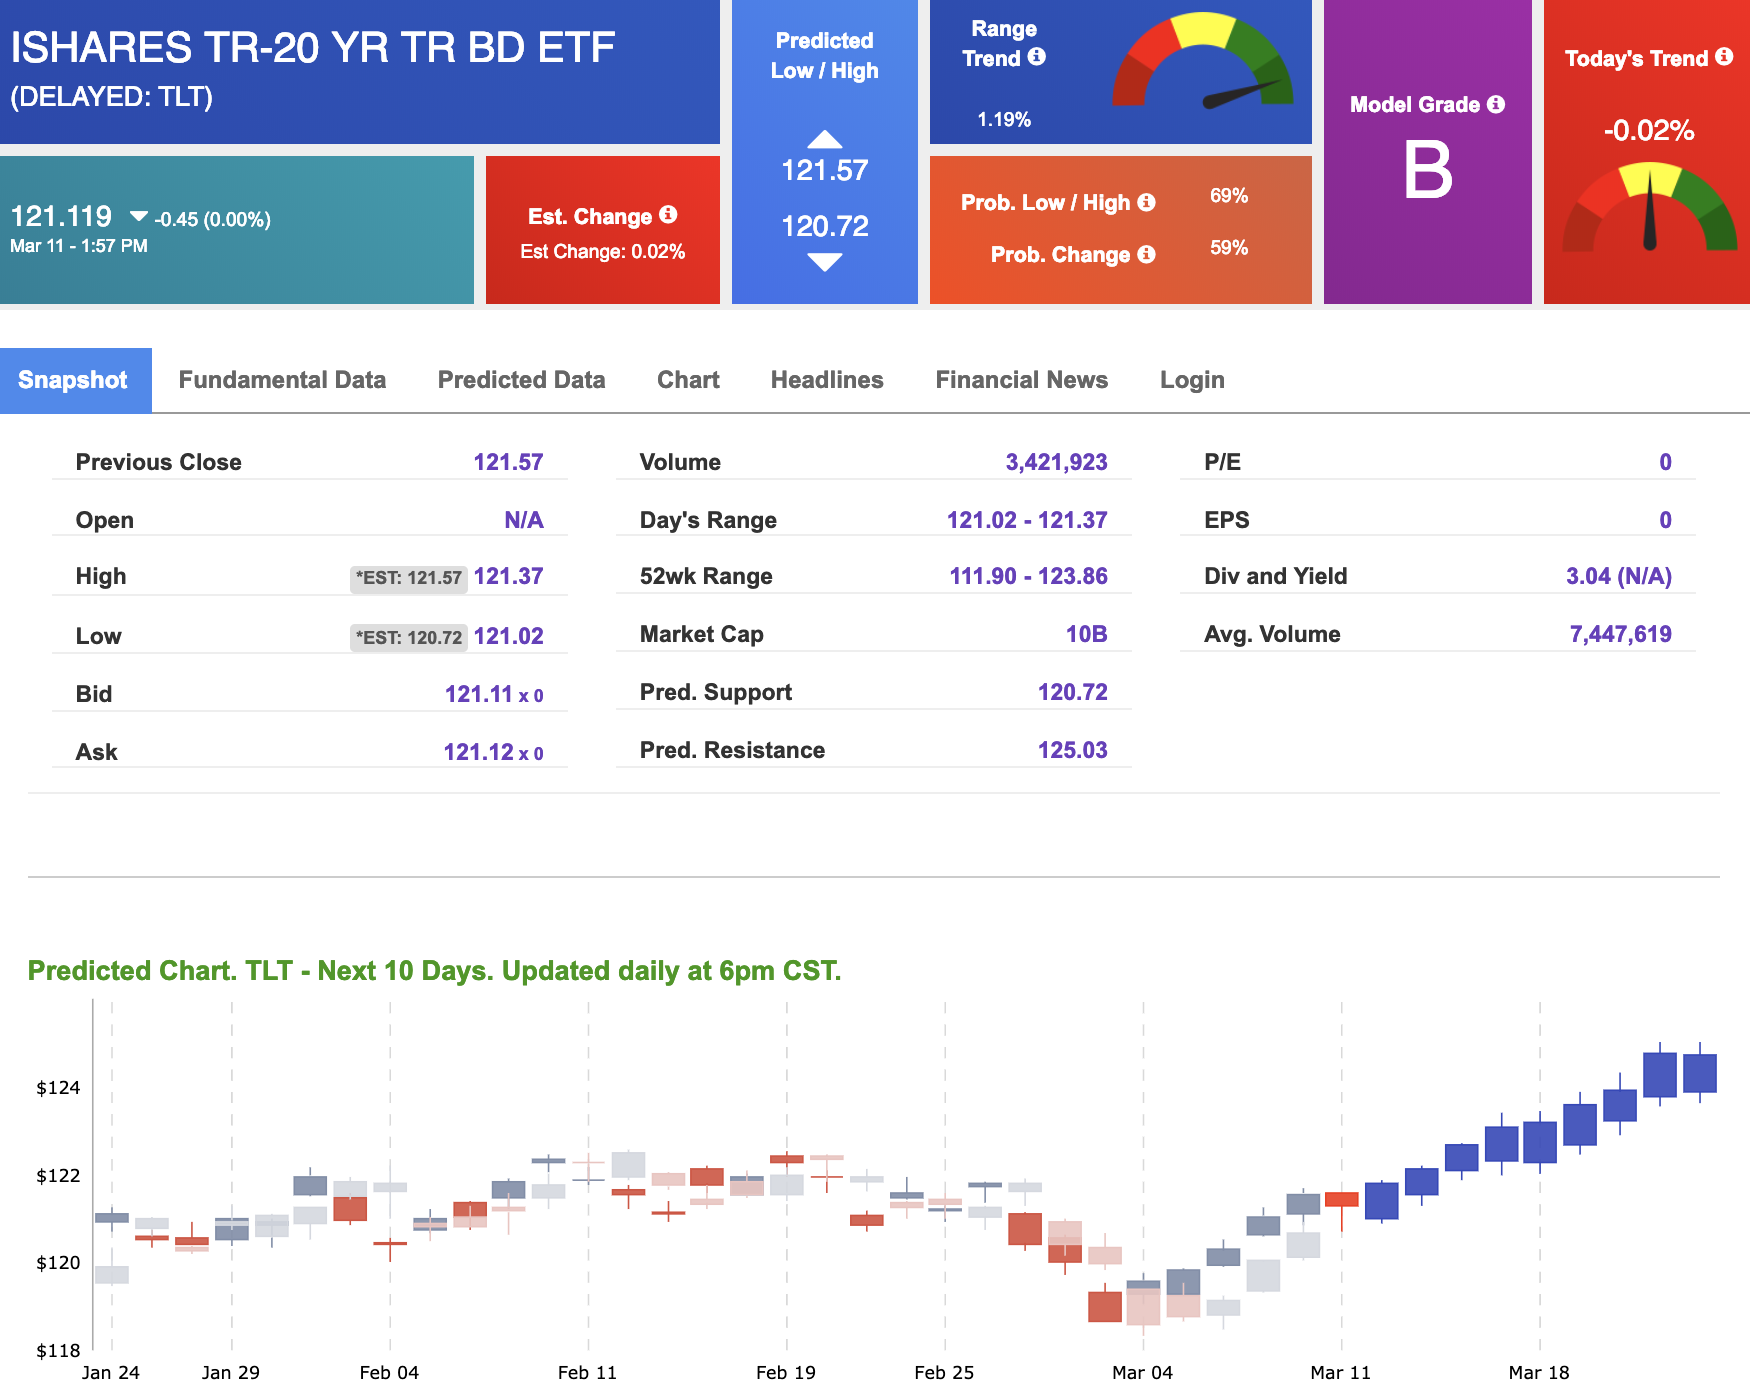
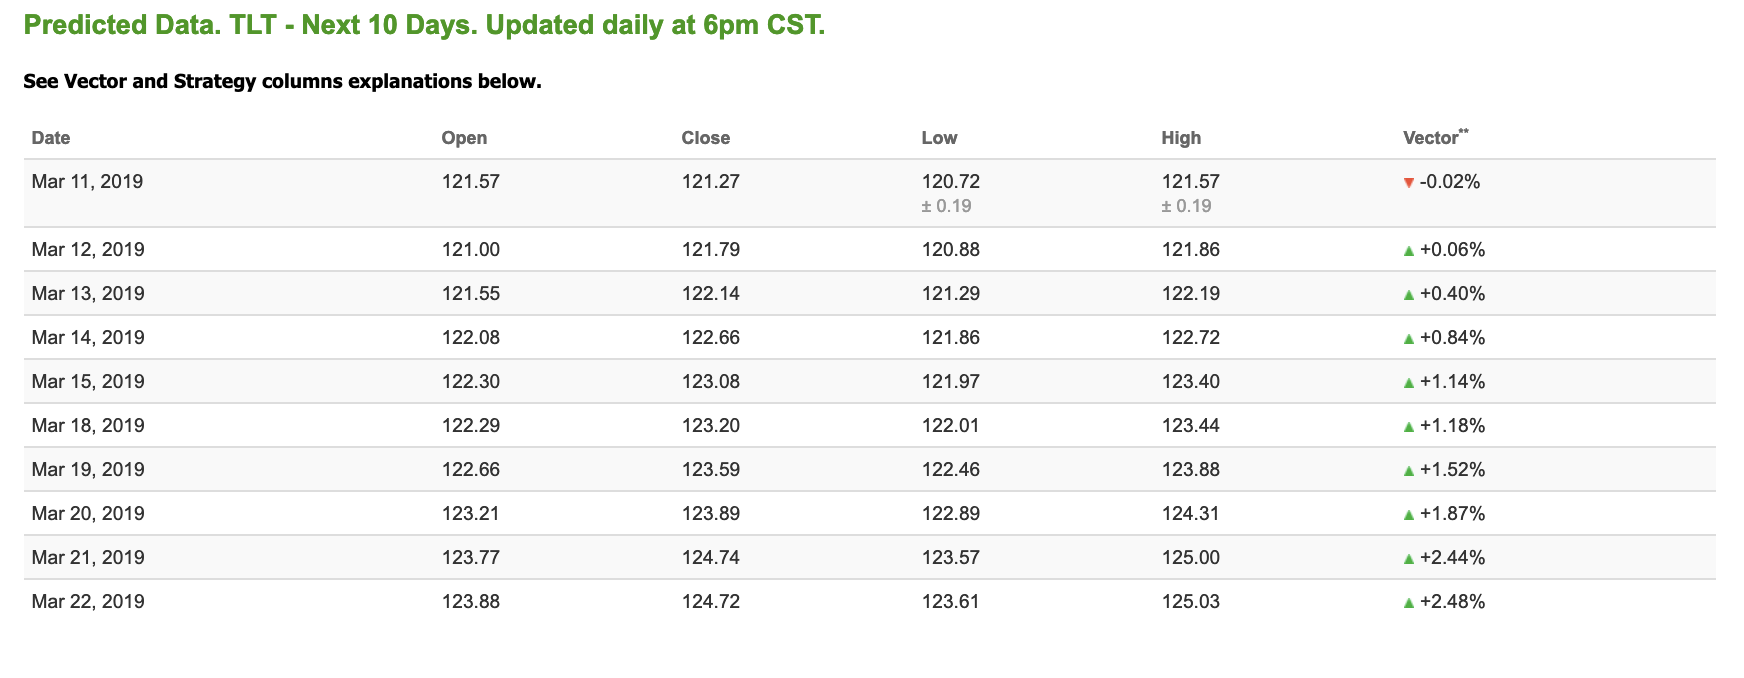
Using the iShares 20+ Year Treasury Bond ETF (TLT) as a proxy for bond prices in our Stock Forecast Tool, we see mostly positive signals in our 10-day prediction window. Today’s vector of -0.02% moves to +0.84% in three sessions. Prediction data is uploaded after market close at 6 p.m., CST. Today’s data is based on market signals from the previous trading session.
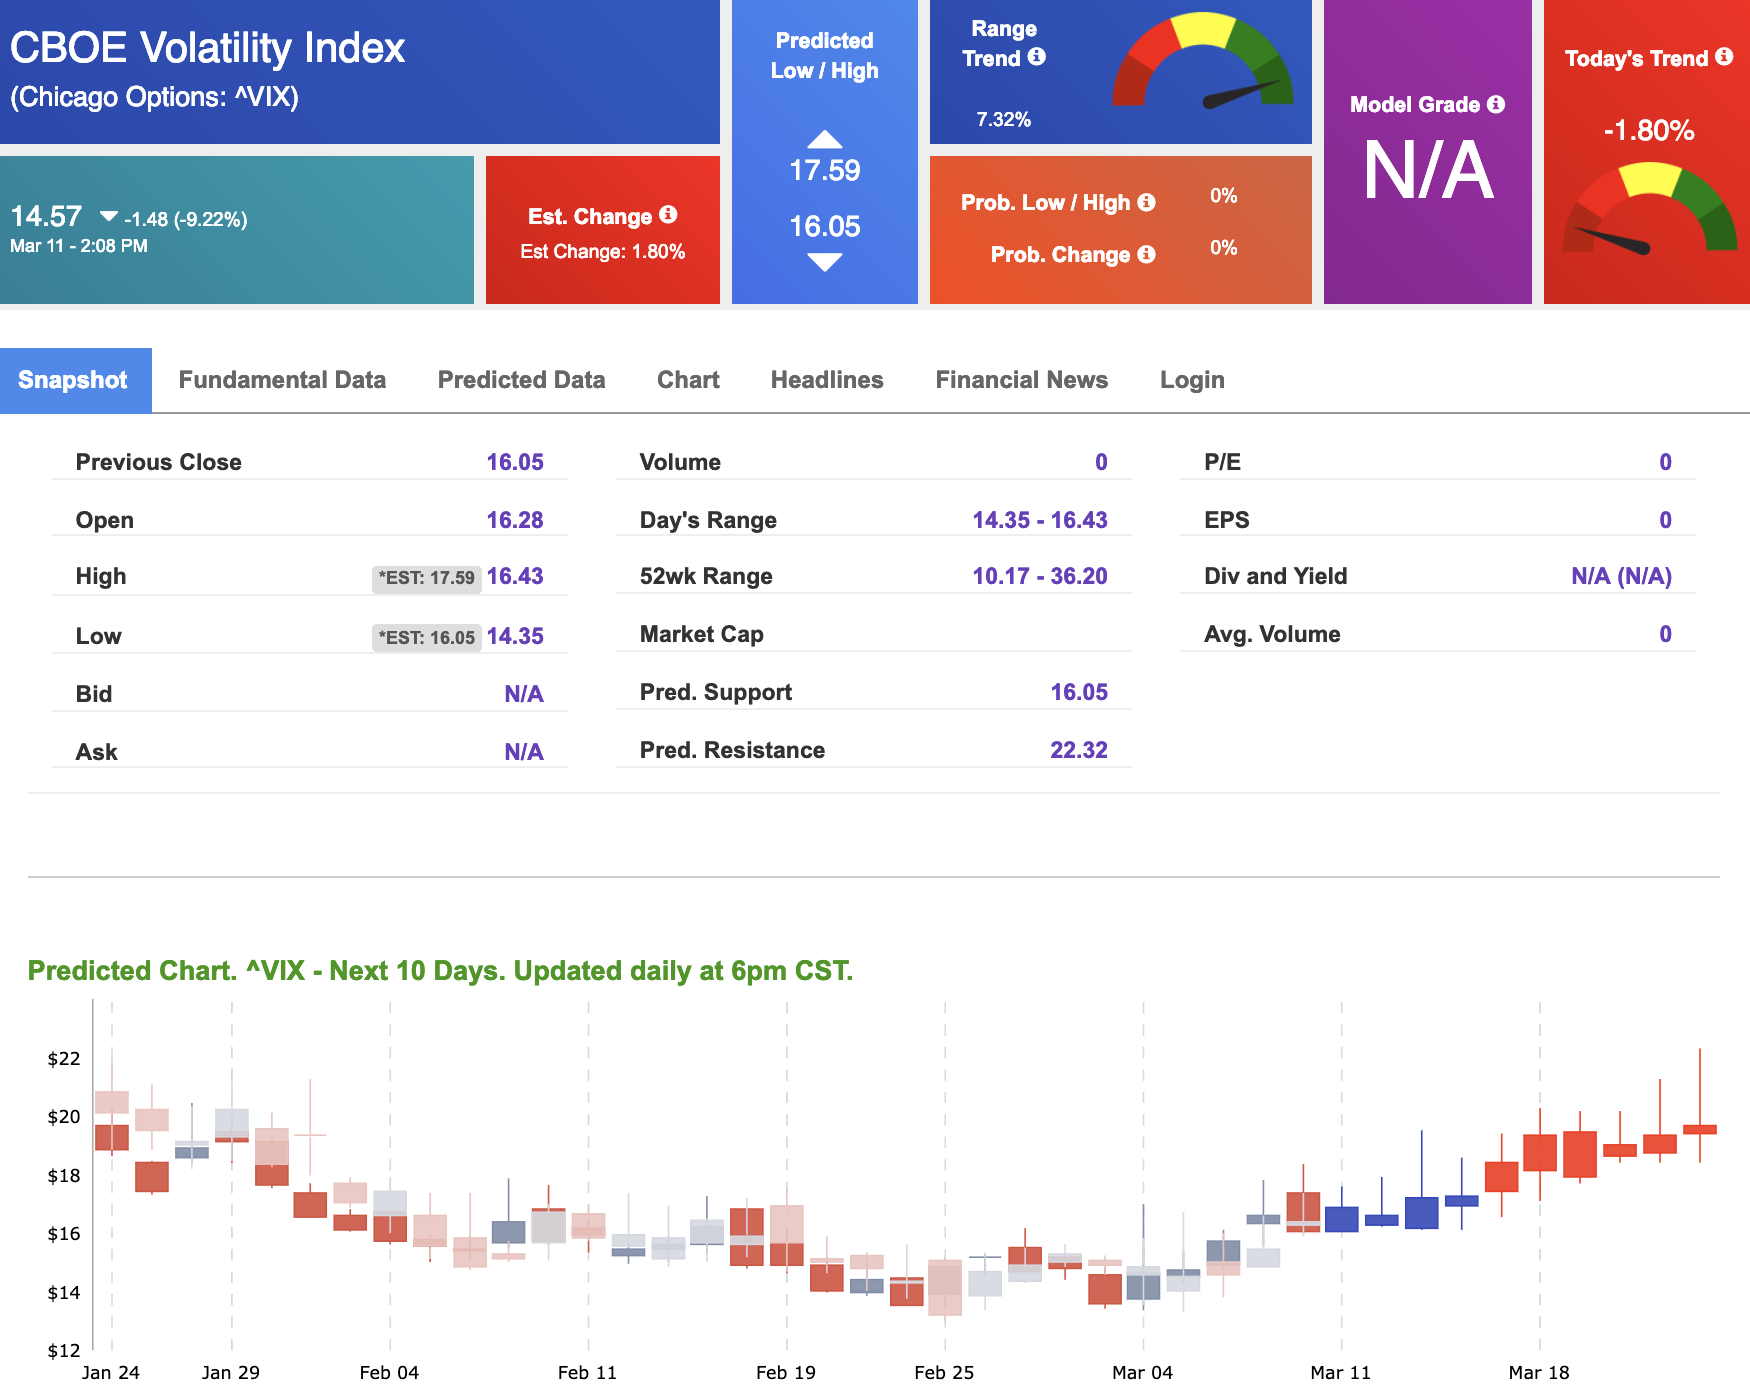
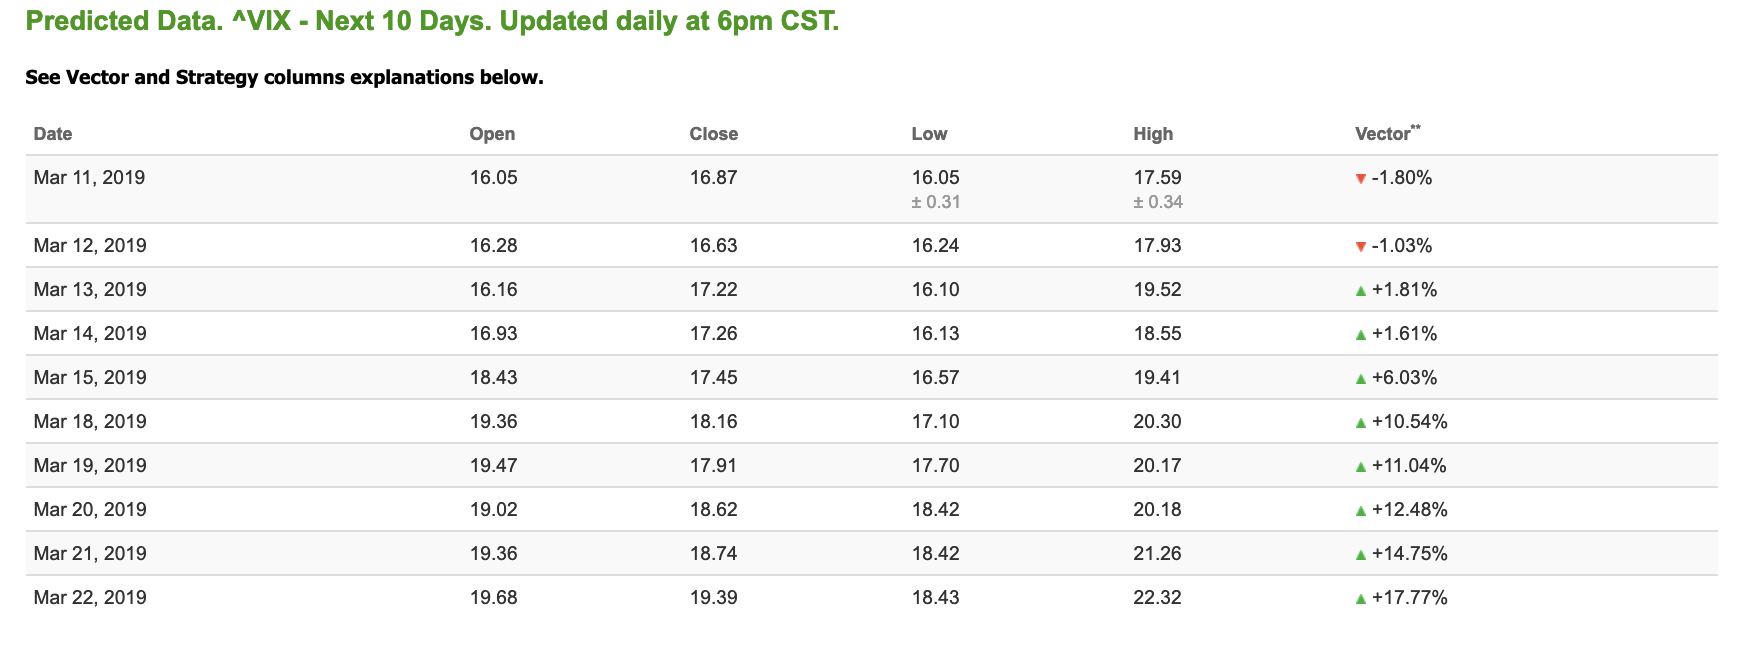
Volatility
The CBOE Volatility Index (^VIX) is down 9.22% at $14.57 at the time of publication, and our 10-day prediction window shows mixed signals. The predicted close for tomorrow is $16.63 with a vector of -1.03%. Prediction data is uploaded after market close at 6 p.m., CST. Today’s data is based on market signals from the previous trading session.