European Central Bank Recent Policy Update Troubles Investors
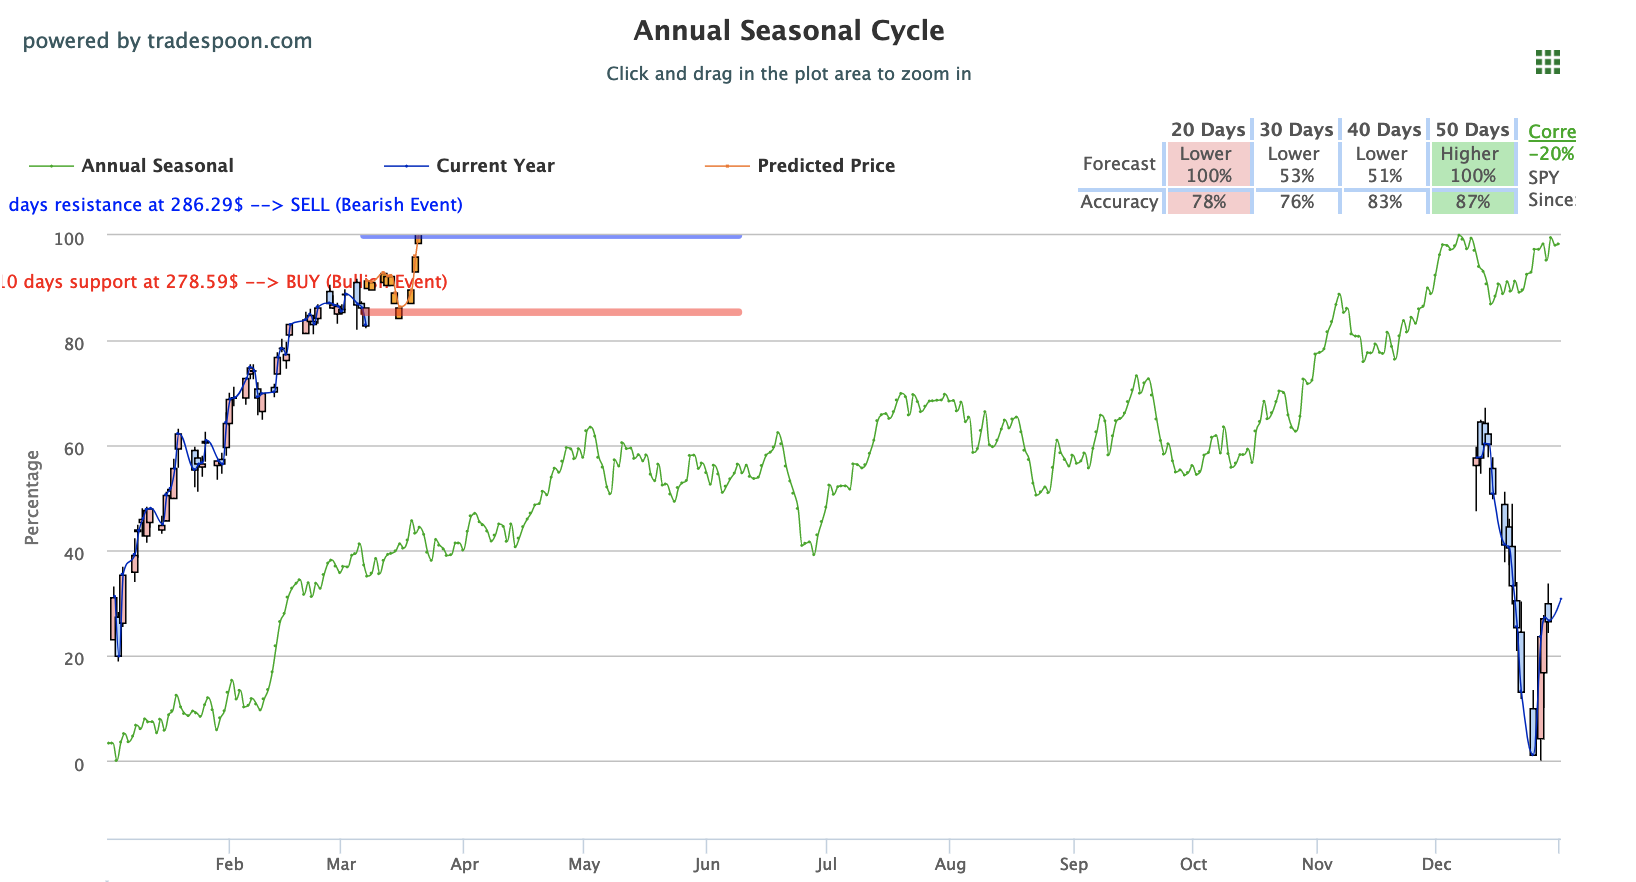
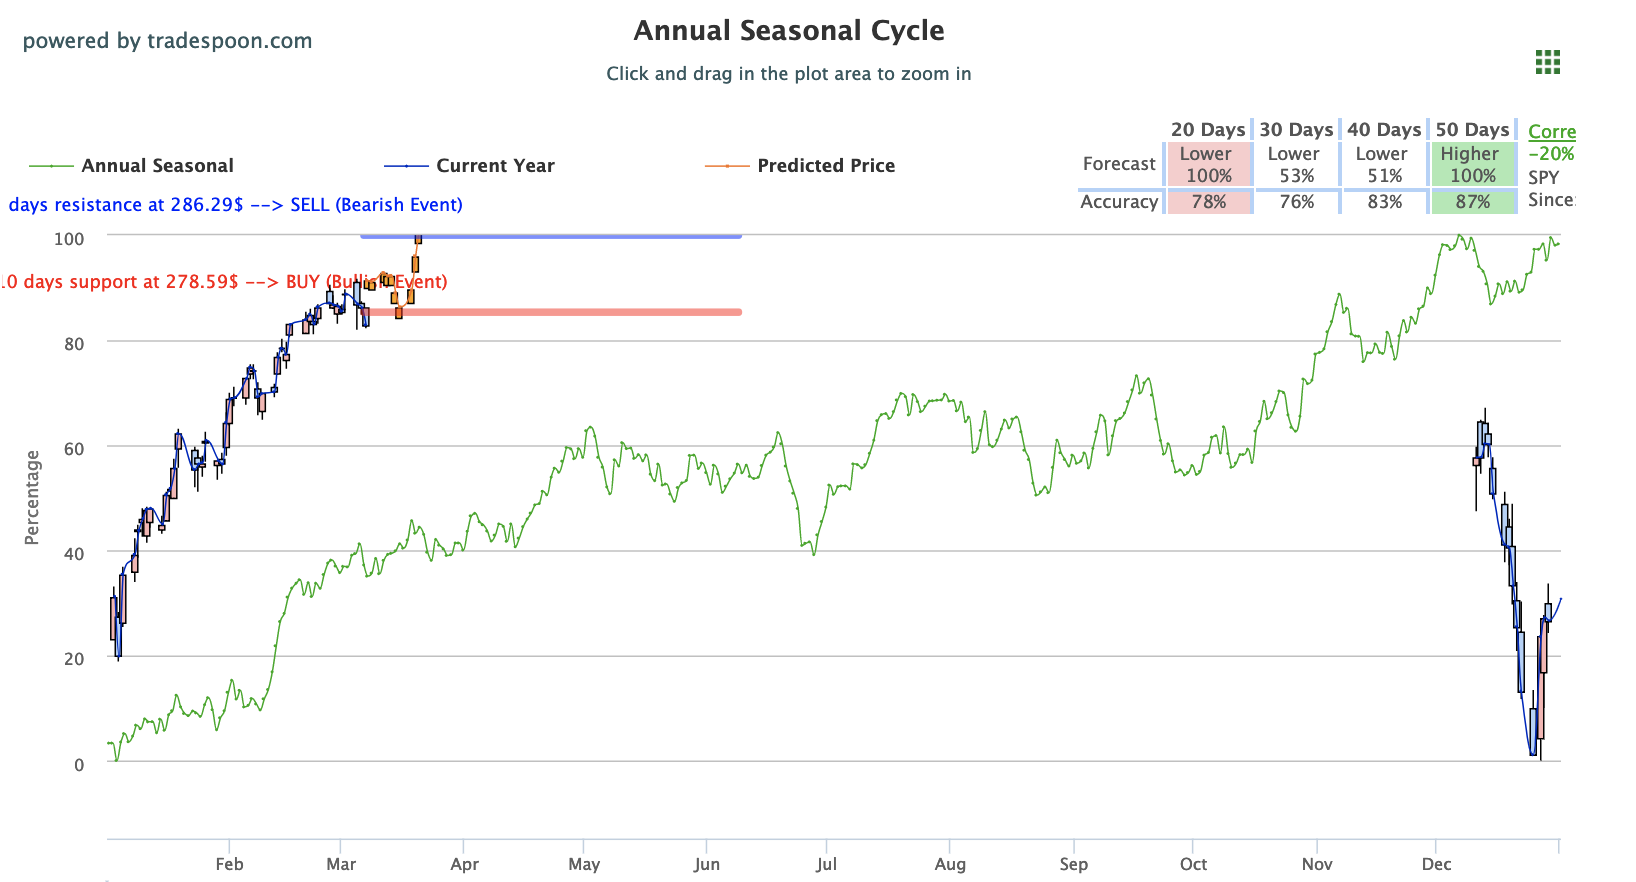
Major U.S. indices lowered in early morning trading and are holding on to moderate losses through the afternoon. Global trade is once more in focus with the Central European Bank showing slowing signs of growth while the China-U.S. trade deal has yet to be resolved. Though the China-U.S. trade deal has gained some momentum and optimism in the last few days, overall indicators of slowing global growth from Asia to Europe continue to stunt market. Huawei Tech is once more in the spotlight while corporate U.S. earnings to monitor today include Kroger and Costco. Currently, we are below the 200-day moving average for the SPY which sits at $275. This opens the door for a retrace to $268 level we previously saw, or, at worst, to $264. Looking ahead, we remain bullish and could see the SPY reaching a 52-week high by the end of May. For reference, the SPY Seasonal Chart is shown below:
Global markets were once more hampered by troubling global trade data. After poor Chinese data disrupted markets last week, The European Central Bank reported today in the “European economy continues to slog along,” providing little optimism and further concern. While the U.S.-China trade dispute seems to wear on both nations involved, European markets are also reeling from the poignant global issue as well as their own concerns and trepidations over Brexit. Pessimism grows in Europe over Brexit as its deadline fast-approaches and over in the U.K. parliament is once more gearing up to vote on Prime Minister May’s leadership. In the U.S., a push for a China deal remains as the Trump administration looks to fuel a market rally.
Chinese telecom giant Huawei Tech sued the U.S. government today, citing laws that limit U.S. business unconstitutional. These laws, signed into effect by Trump last year, limit sales on the basis of security and have some added pressure with recent tariff escalation. A similar suit by a Russian cybersecurity company was rejected last year by U.S. courts, providing the grounds for Huawei case to similarly be dismissed.
Kroger released their fourth-quarter earnings before market open and saw shares drop over 10% after earnings missed expectations. Costco will report earnings after the bell and are currently slightly down for the day. Fed Chair Jerome Powell is scheduled to speak tomorrow while next week we will see a heavy load of economic reports including Federal Budget, Consumer and Producer Price Index, and Core CPI.
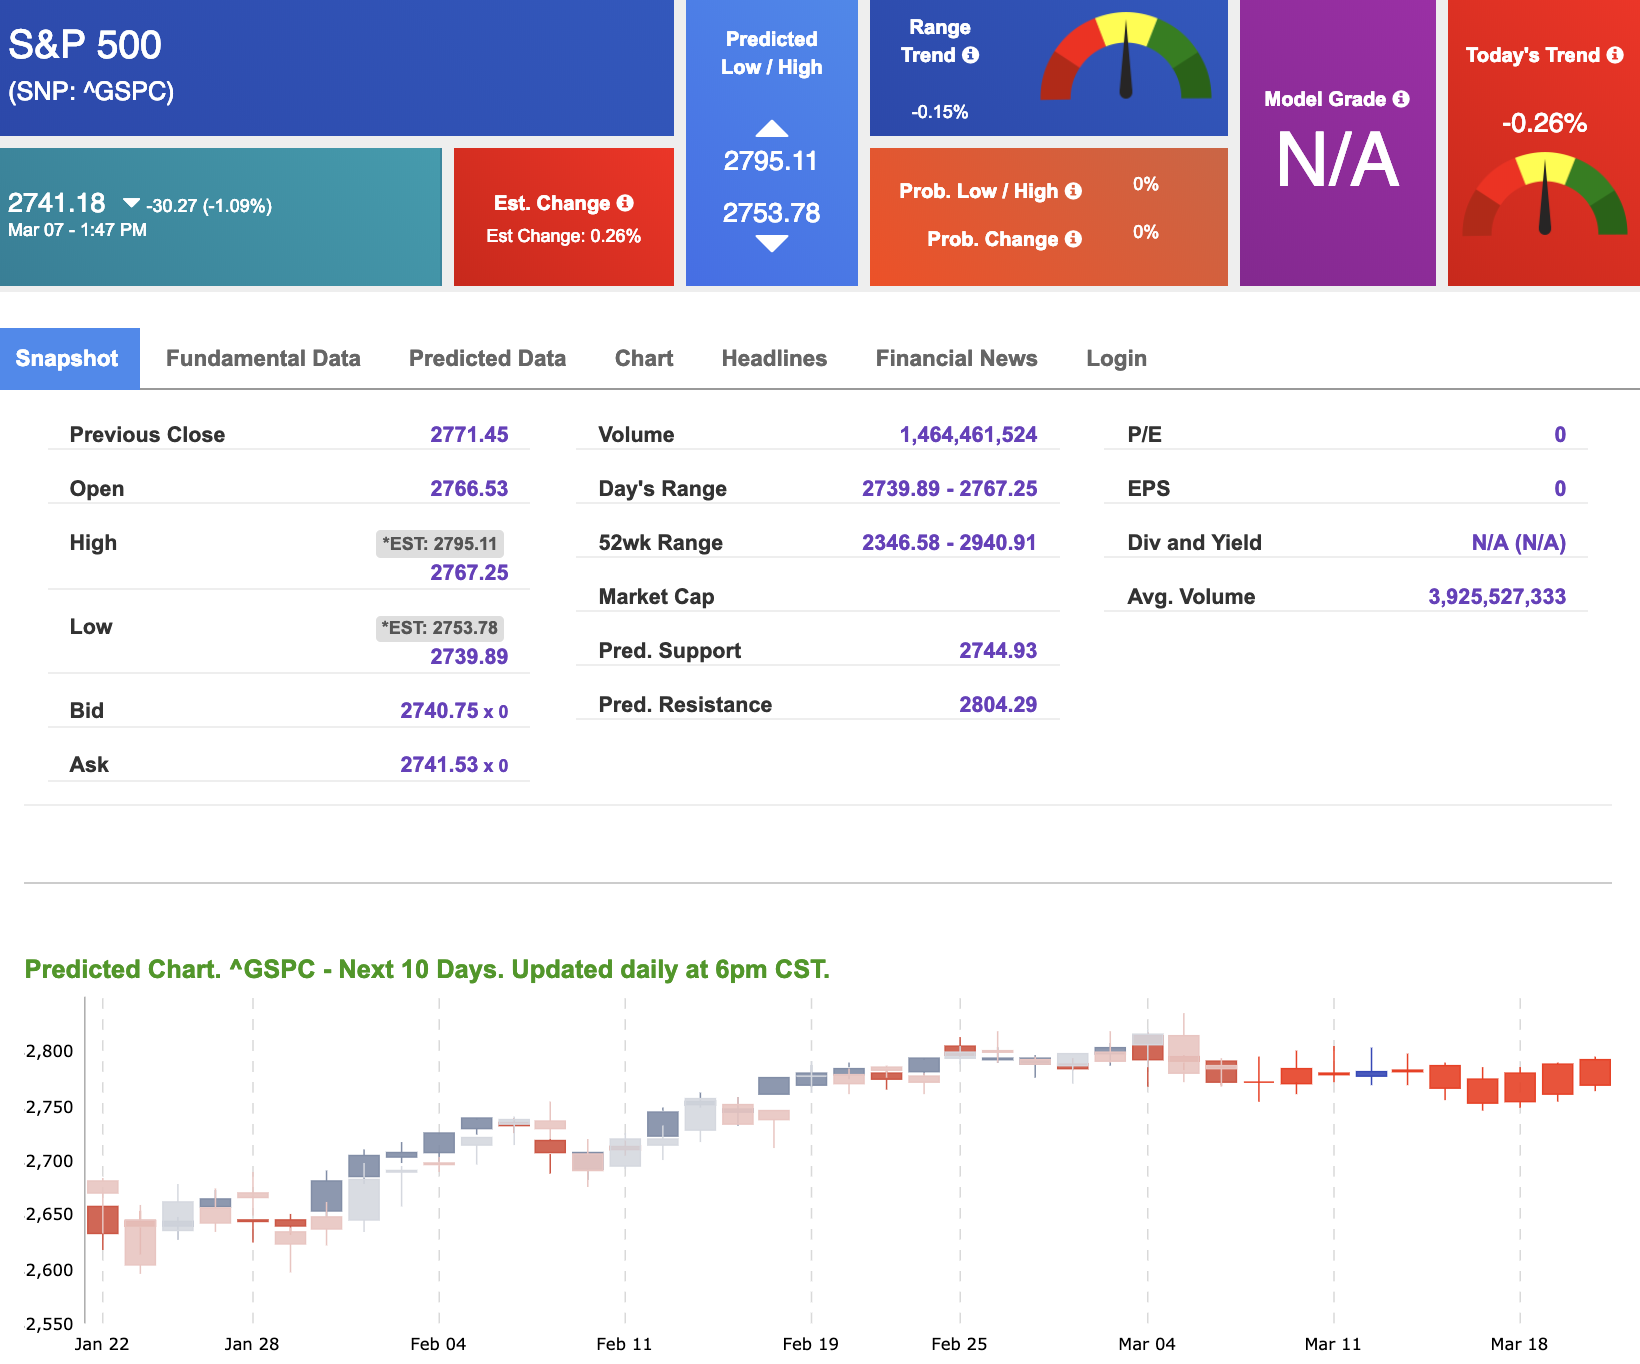

Using the “^GSPC” symbol to analyze the S&P 500, our 10-day prediction window shows mixed signals. Today’s vector figure of -0.26% moves to -0.20% in five trading sessions. The predicted close for tomorrow is 2761.00.. Prediction data is uploaded after the market close at 6 p.m., CST. Today’s data is based on market signals from the previous trading session.
(Last Chance) March Madness Offer!
LIFETIME ACCESS to our Stock Forecast Toolbox Membership for less than the regular price we normally charge for a 1-year membership.
Bonus: ActiveTrader Lifetime Access
(Daily Stock & Option Trade Recommendations)
You Don’t Want to Miss This!
Offer Ends Midnight Tonight.
Click Here to Sign Up
Highlight of a Recent Winning Trade
On February 25th, our ActiveTrader service produced a bearish recommendation for Helmerich & Payne Inc (HP). ActiveTrader is included in all paid Tradespoon membership plans and is designed for day trading.
Trade Breakdown
HP entered its forecasted Strategy B Entry 1 price range $55.02 (± 0.38) in its first hour of trading and passed through its Target price $54.47 in the first hour of trading the following day. The Stop Loss price was set at $55.57

Friday Morning Featured Stock
*Please note: Our featured stock is part of your free subscription service. It is not included in any paid Tradespoon subscription service. Vlad Karpel only trades his own personal money in paid subscription services. If you are a paid subscriber, please review your Premium Member Picks, ActiveTrader or MonthlyTrader recommendations. If you are interested in receiving Vlad’s personal picks, please click here.
Our featured stock for Friday is iPath S&P 500 VIX (VXX). VXX is showing a confident vector trend in our Stock Forecast Toolbox’s 10-day forecast. This stock is assigned a Model Grade of (B) indicating it ranks in the top 25th percentile for accuracy for predicted support and resistance, relative to our entire data universe.
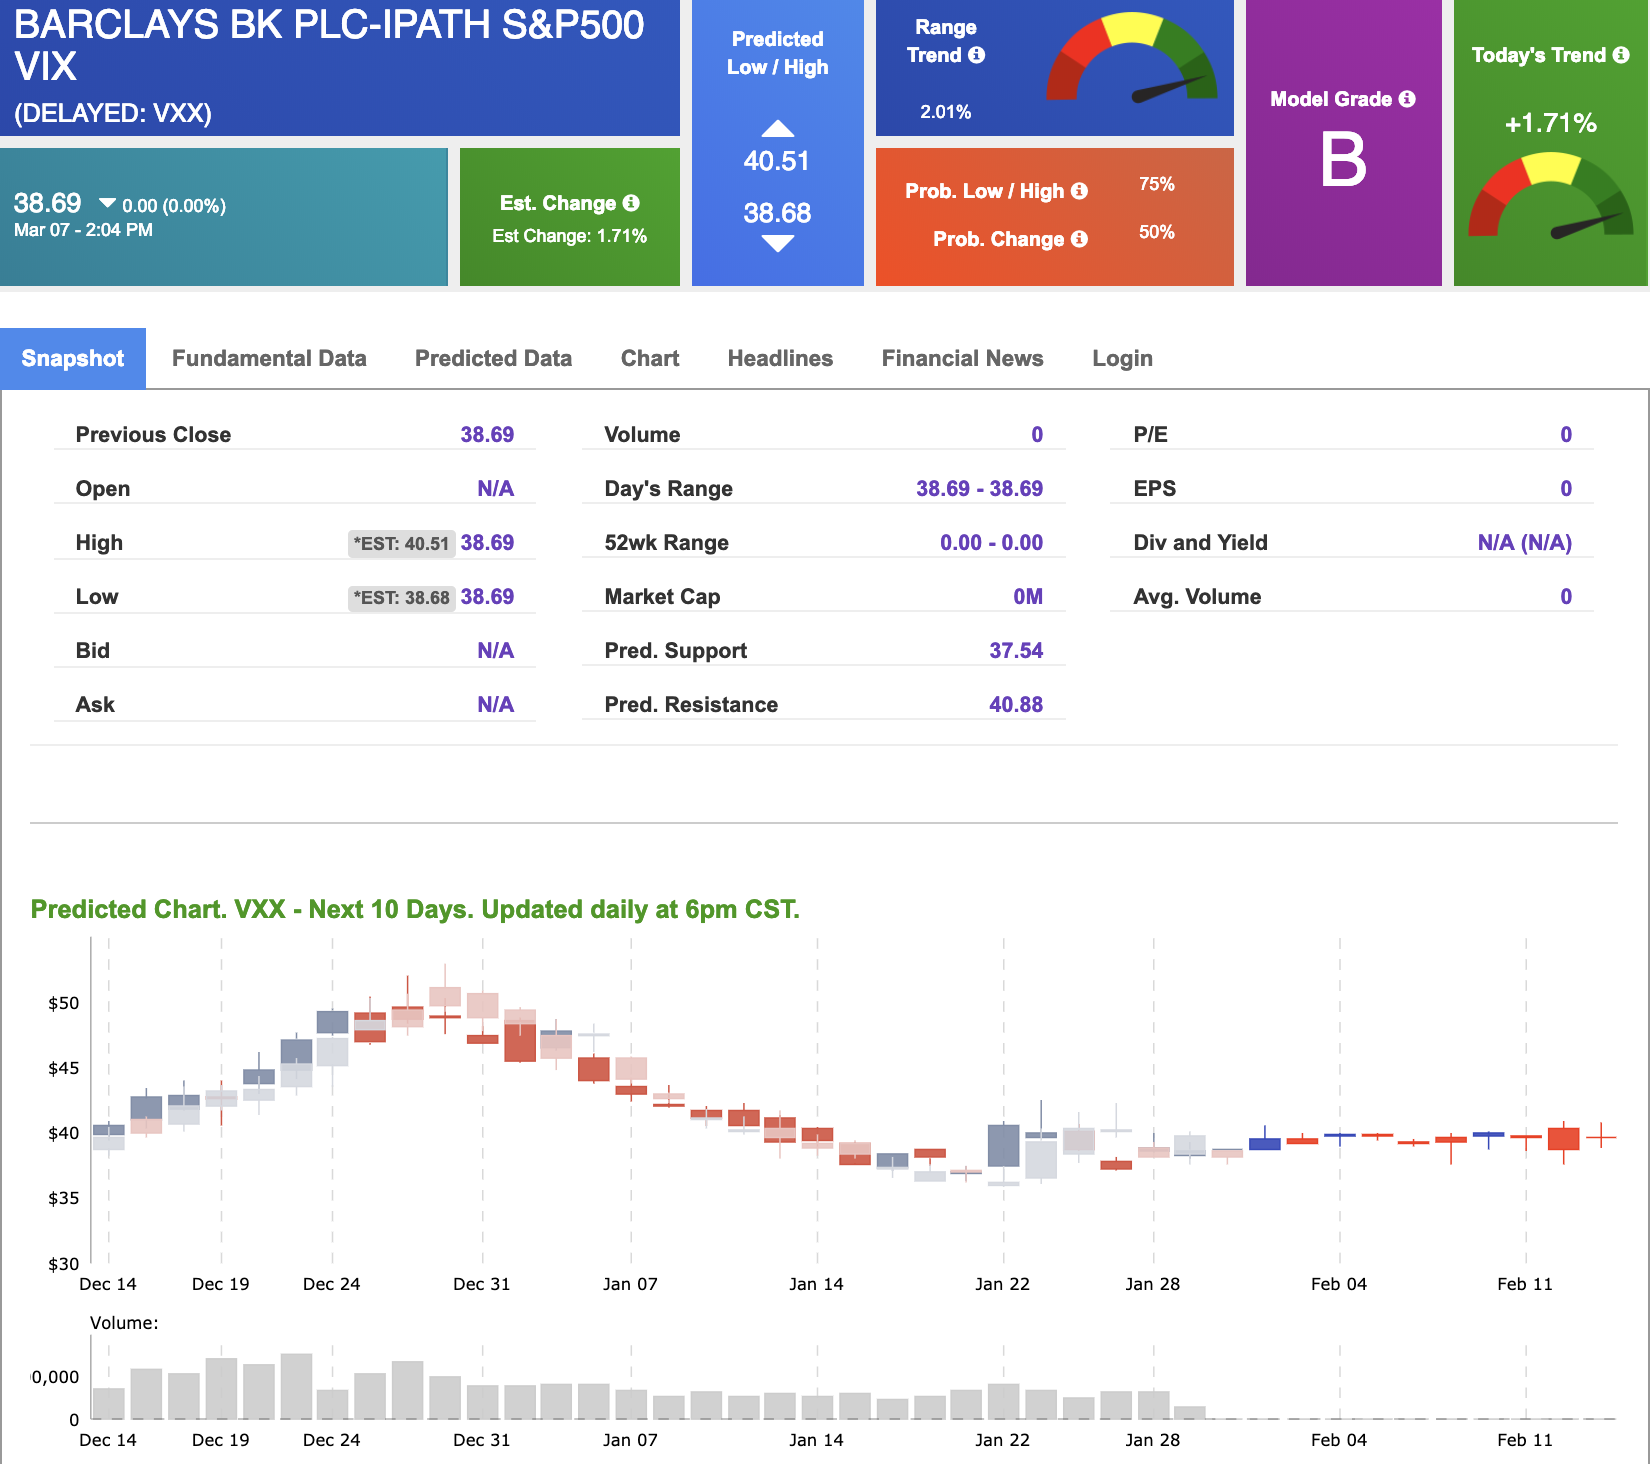
The stock is trading at $38.69 at the time of publication with a +1.71% vector figure.
Prediction data is uploaded after market close at 6 p.m., CST. Today’s data is based on market signals from the previous trading session.
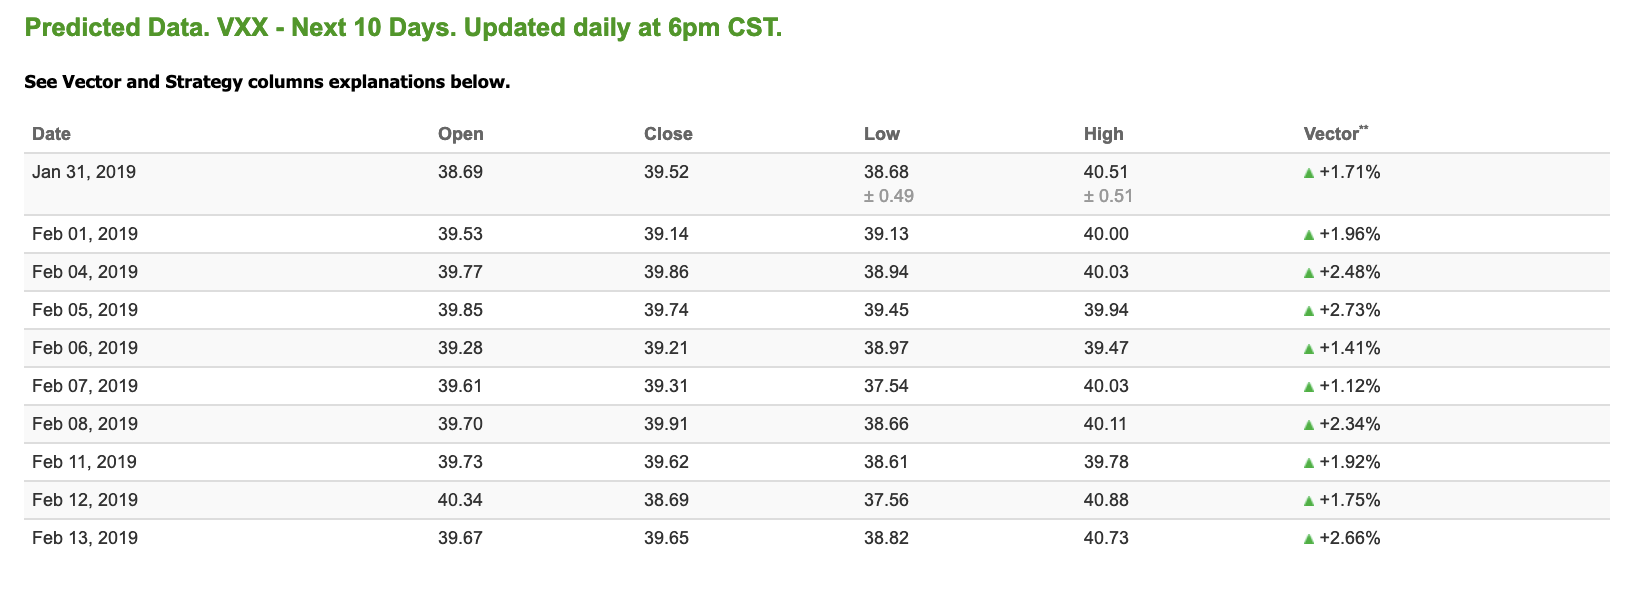
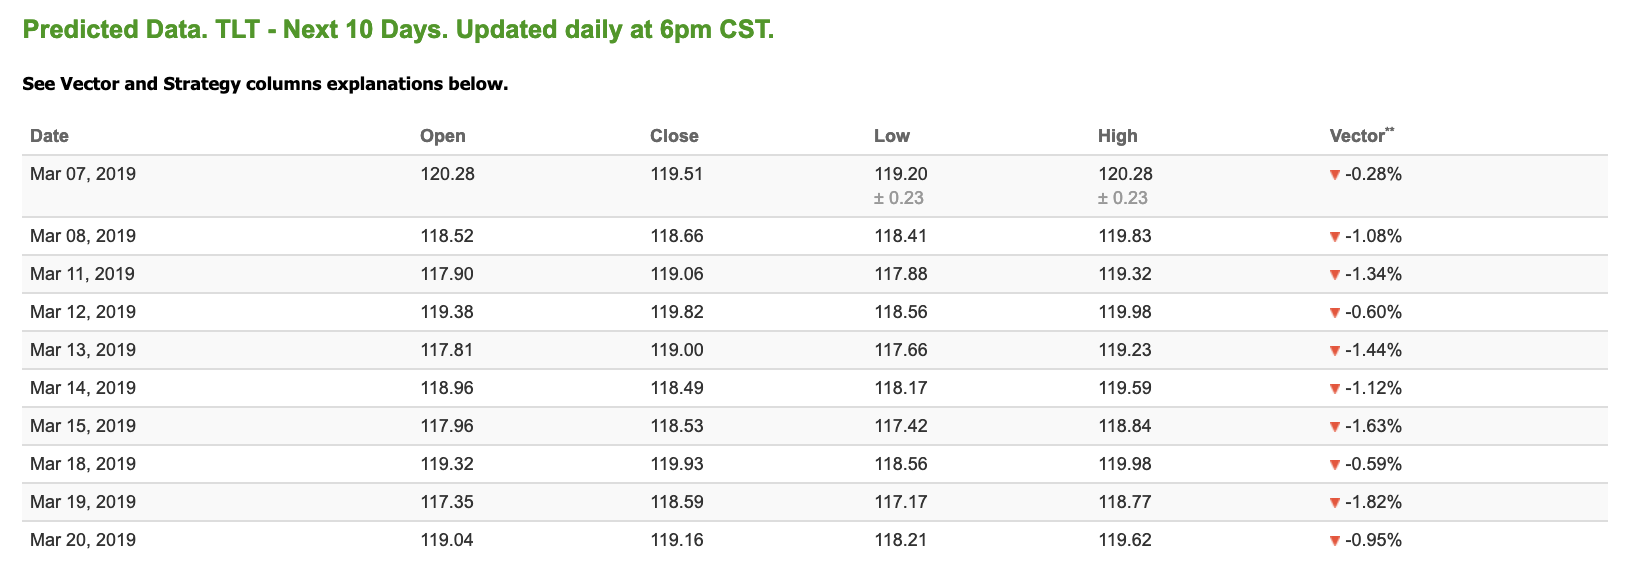
Note: The Vector column calculates the change of the Forecasted Average Price for the next trading session relative to the average of actual prices for the last trading session. The column shows expected average price movement “Up or Down”, in percent. Trend traders should trade along the predicted direction of the Vector. The higher the value of the Vector the higher its momentum.
Oil
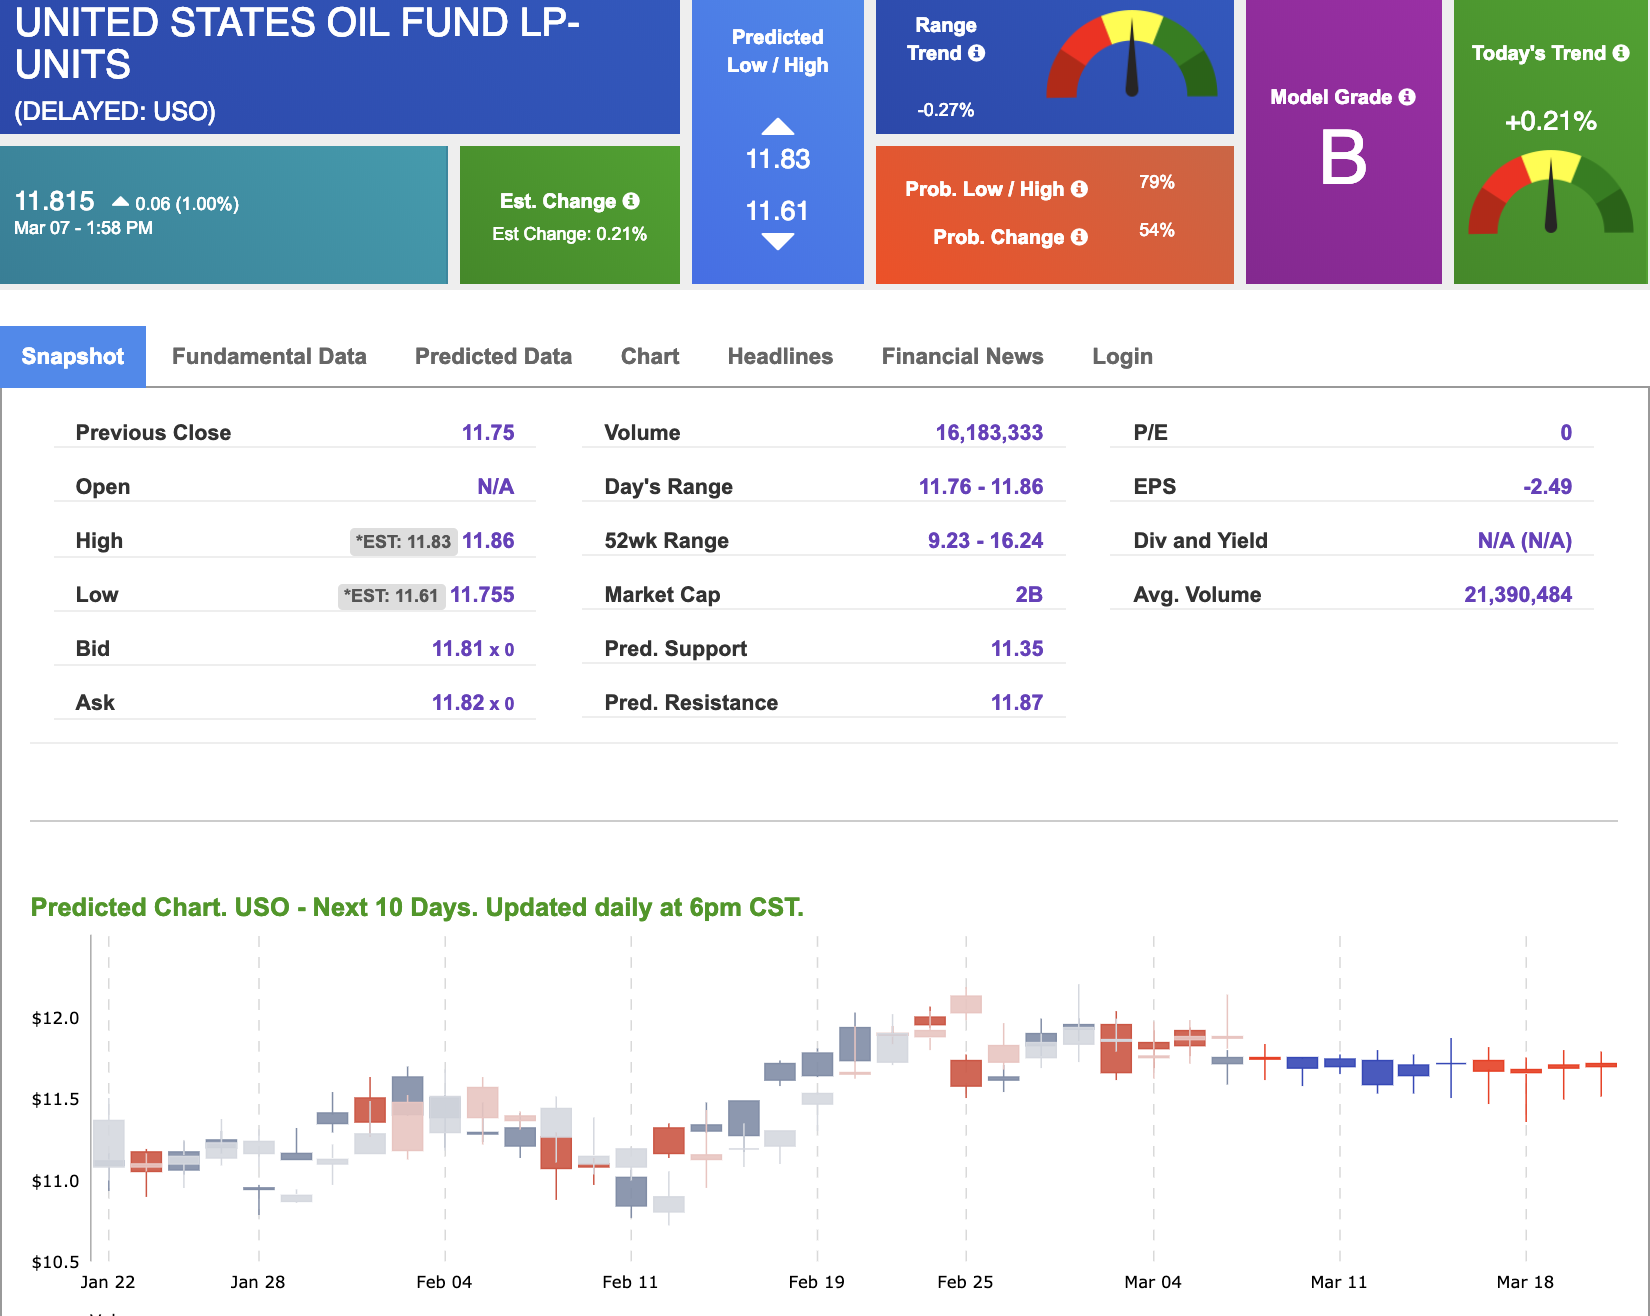
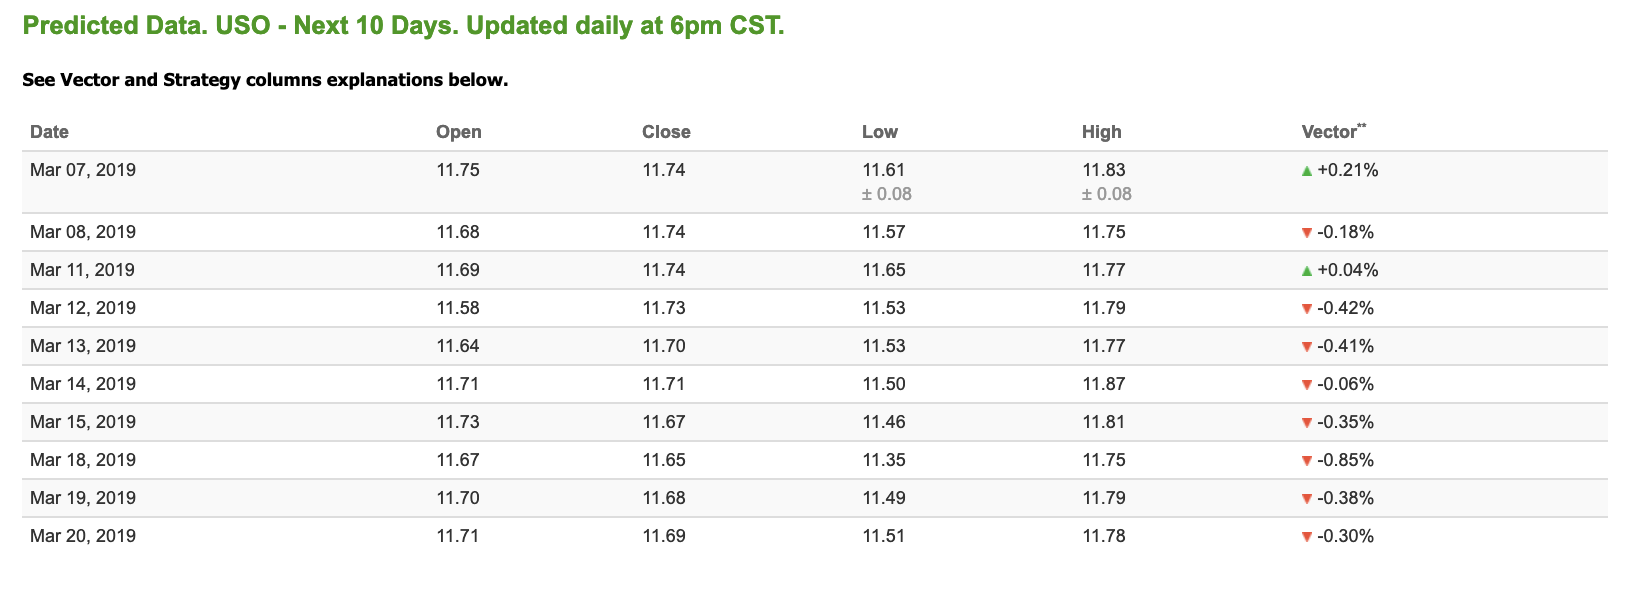
West Texas Intermediate for April delivery (CLJ9) is priced at $56.59 per barrel, up 0.66% from the open, at the time of publication. Looking at USO, a crude oil tracker, our 10-day prediction model shows mixed signals. The fund is trading at $11.81 at the time of publication, up 1.00% from the open. Vector figures show +0.21% today, which turns -0.06% in five trading sessions. Prediction data is uploaded after market close at 6 p.m., CST. Today’s data is based on market signals from the previous trading session.
Gold
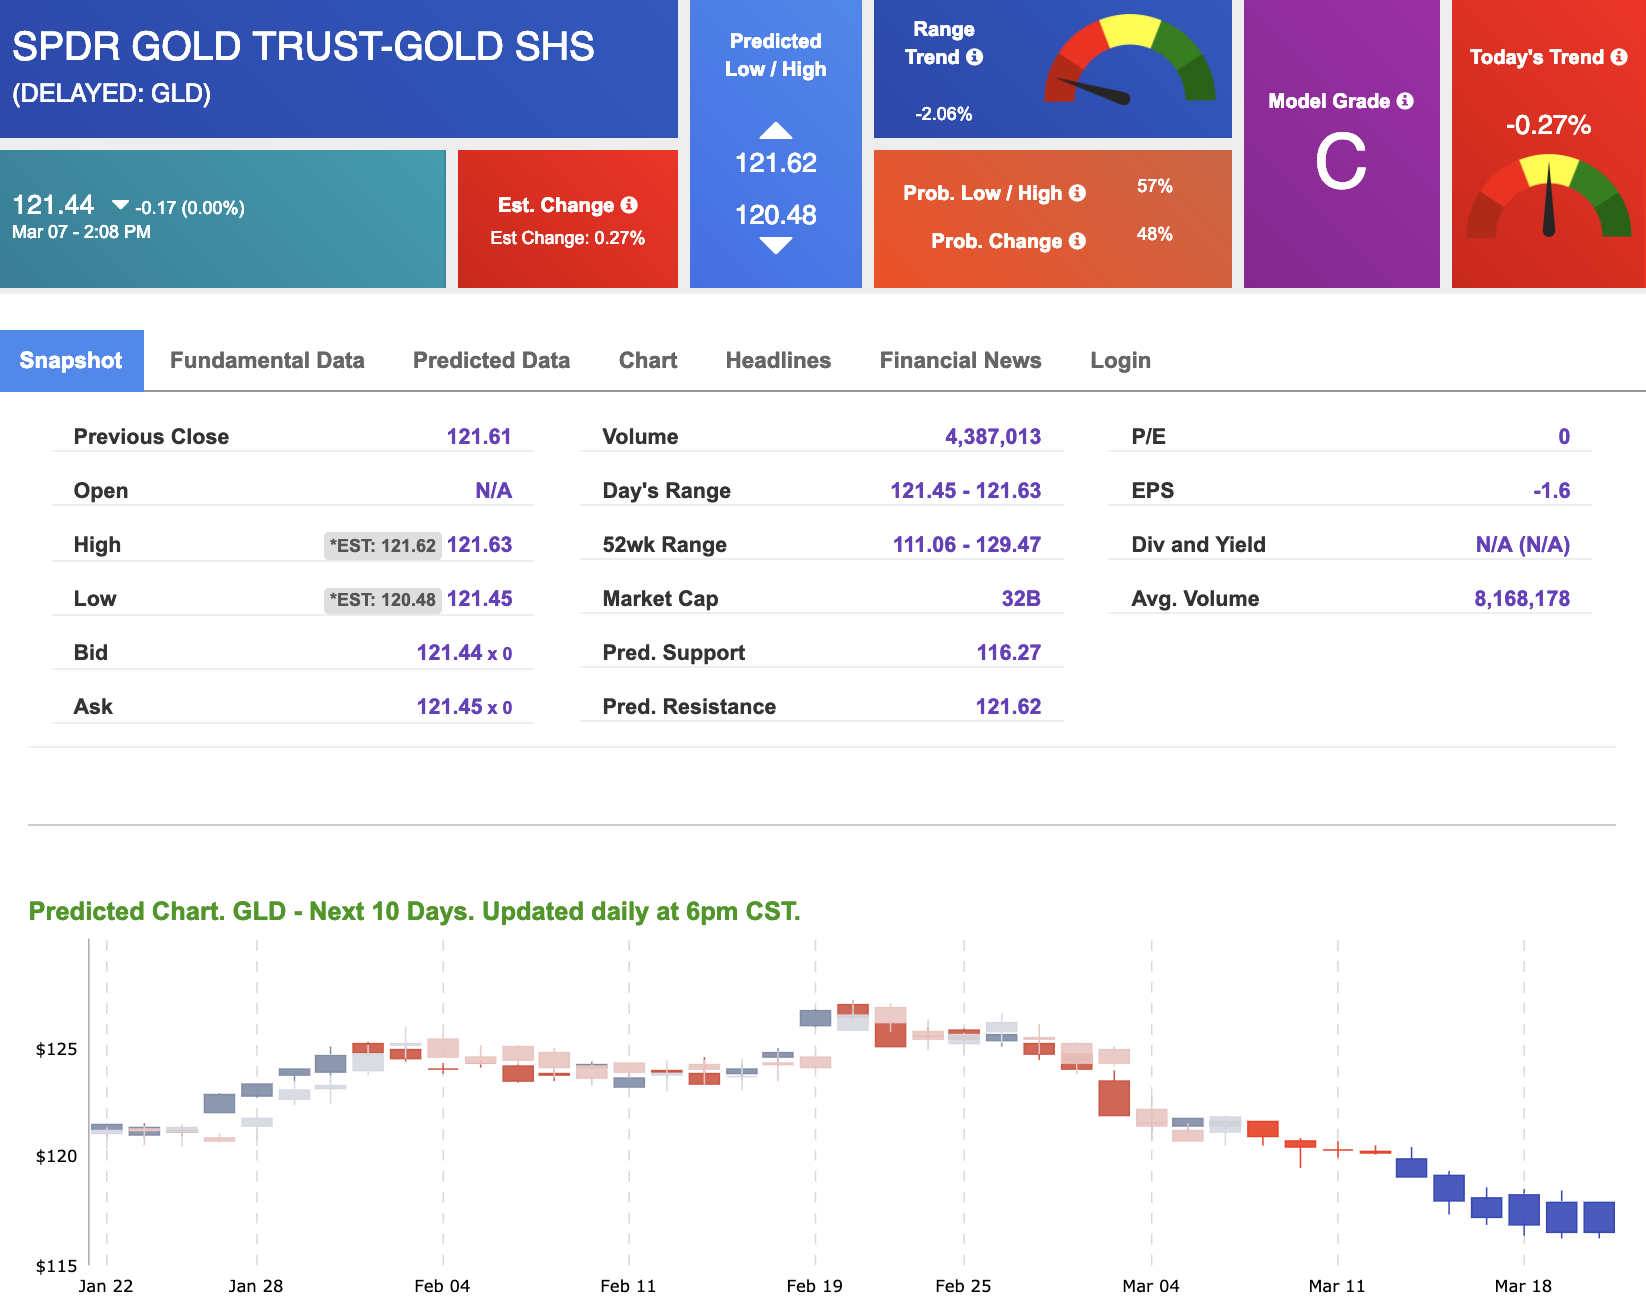
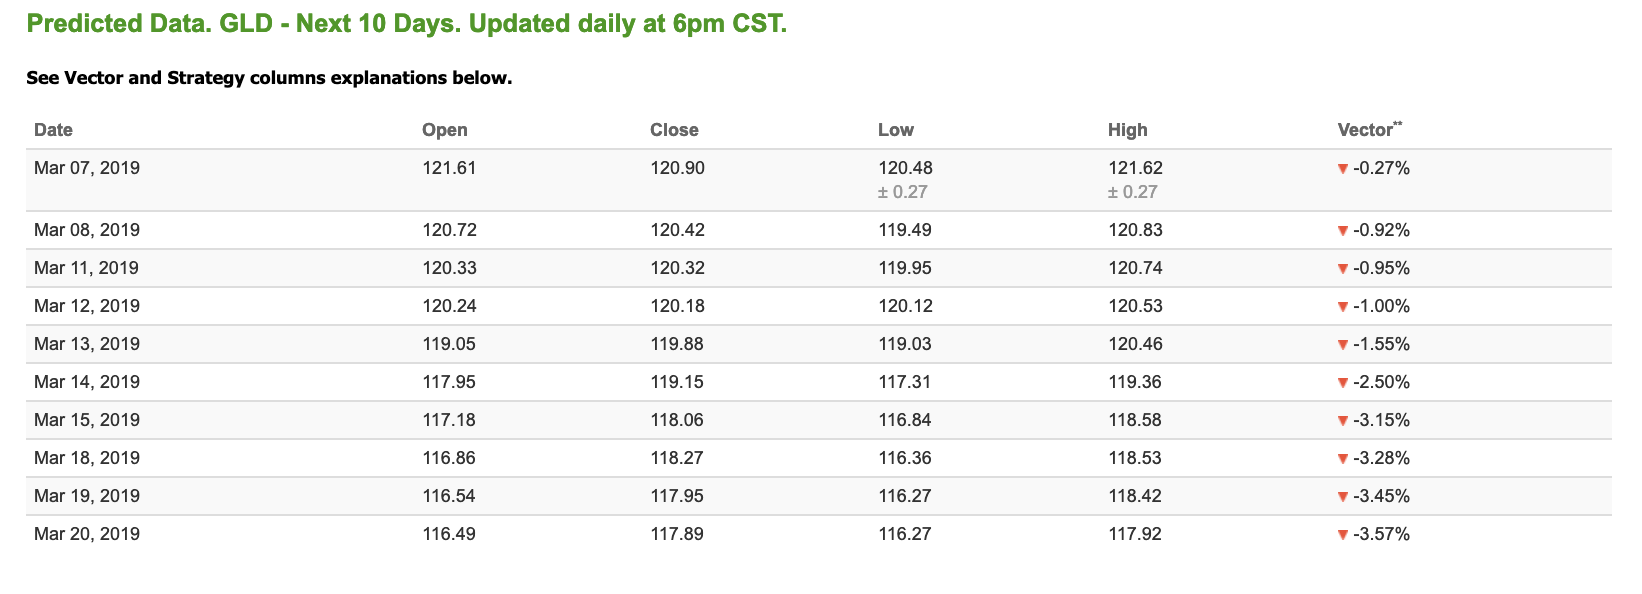
The price for April gold (GCJ9) is down 0.12% at $1,286.00 at the time of publication. Using SPDR GOLD TRUST (GLD) as a tracker in our Stock Forecast Tool, the 10-day prediction window shows mostly negative signals. The gold proxy is trading at $121.44, at the time of publication. Vector signals show -0.27% for today. Prediction data is uploaded after market close at 6 p.m., CST. Today’s data is based on market signals from the previous trading session.
Treasuries
The yield on the 10-year Treasury note is down 1.77% at 2.64% at the time of publication. The yield on the 30-year Treasury note is down 1.24% at 3.03% at the time of publication.
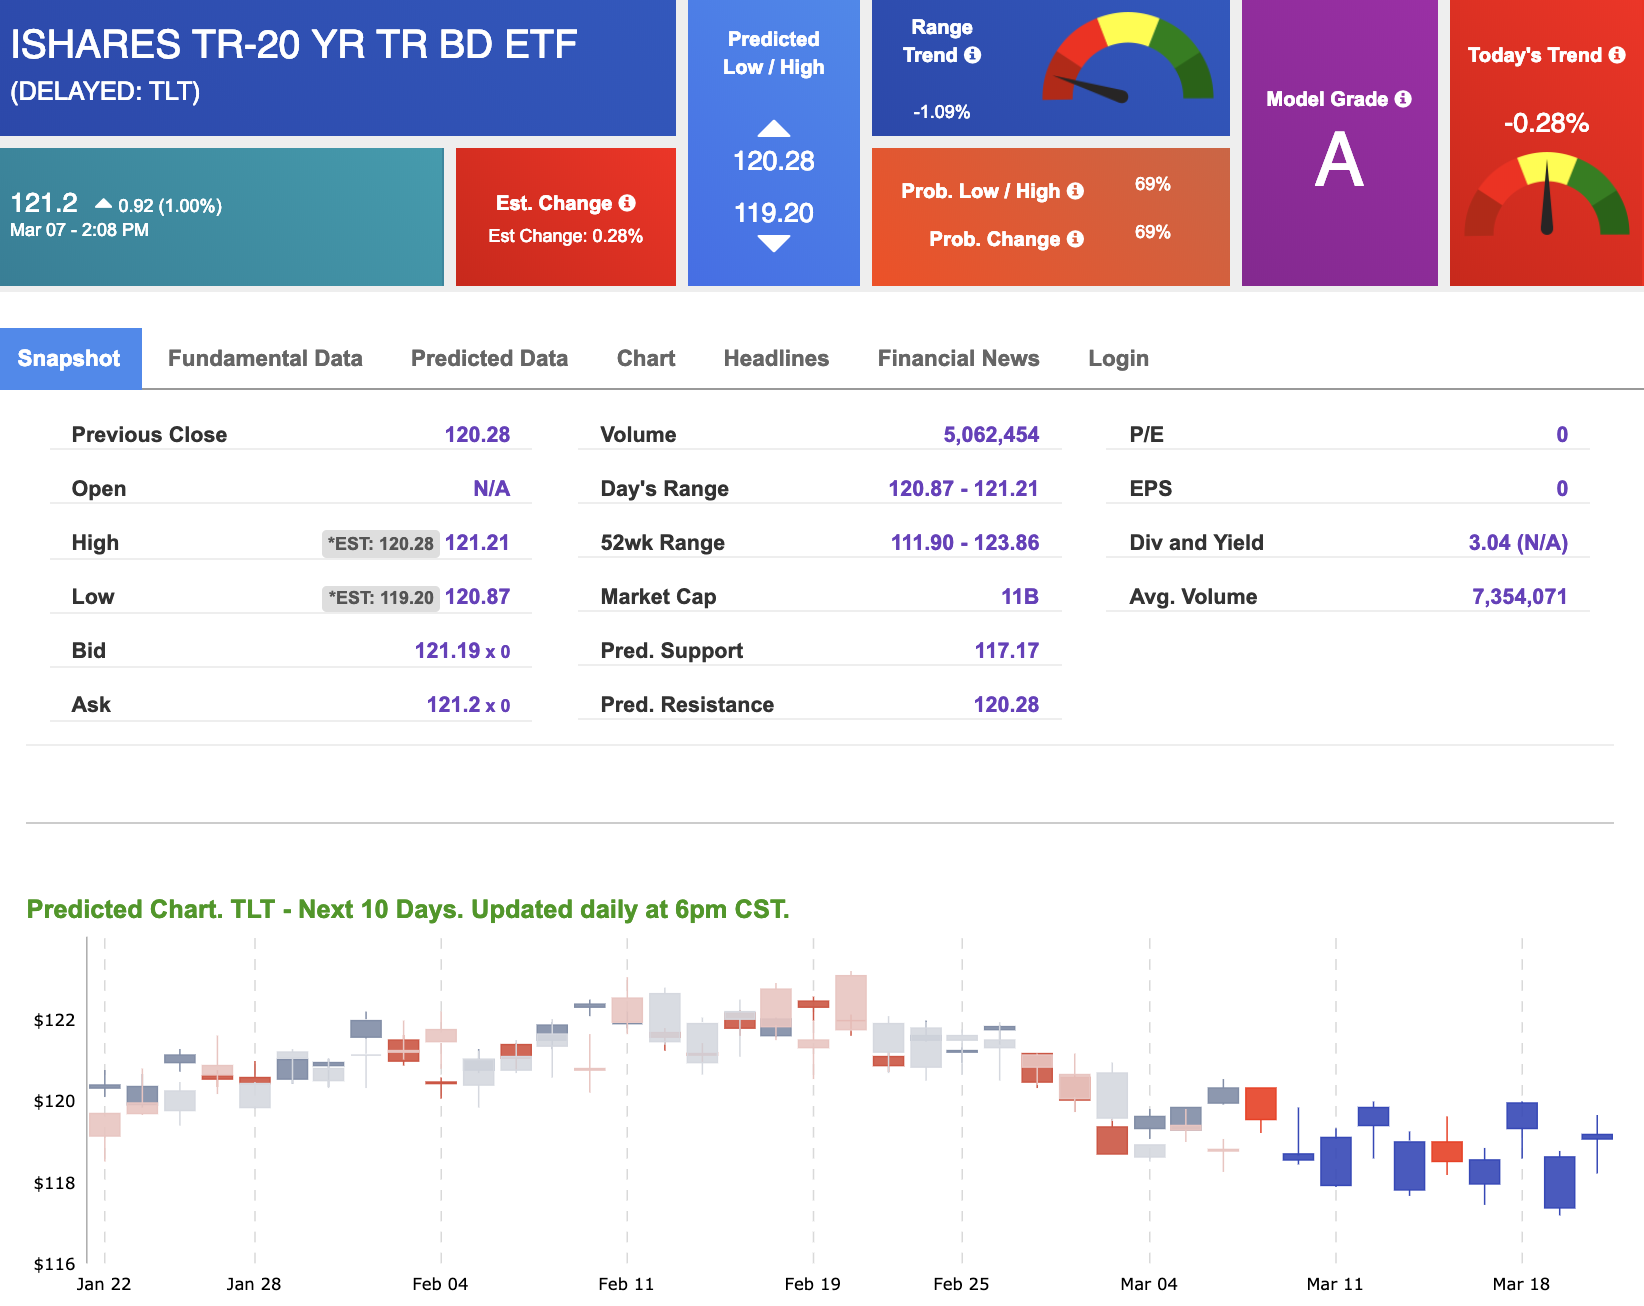
Using the iShares 20+ Year Treasury Bond ETF (TLT) as a proxy for bond prices in our Stock Forecast Tool, we see negative signals in our 10-day prediction window. Today’s vector of -0.28% moves to -0.60% in three sessions. Prediction data is uploaded after market close at 6 p.m., CST. Today’s data is based on market signals from the previous trading session.
Volatility
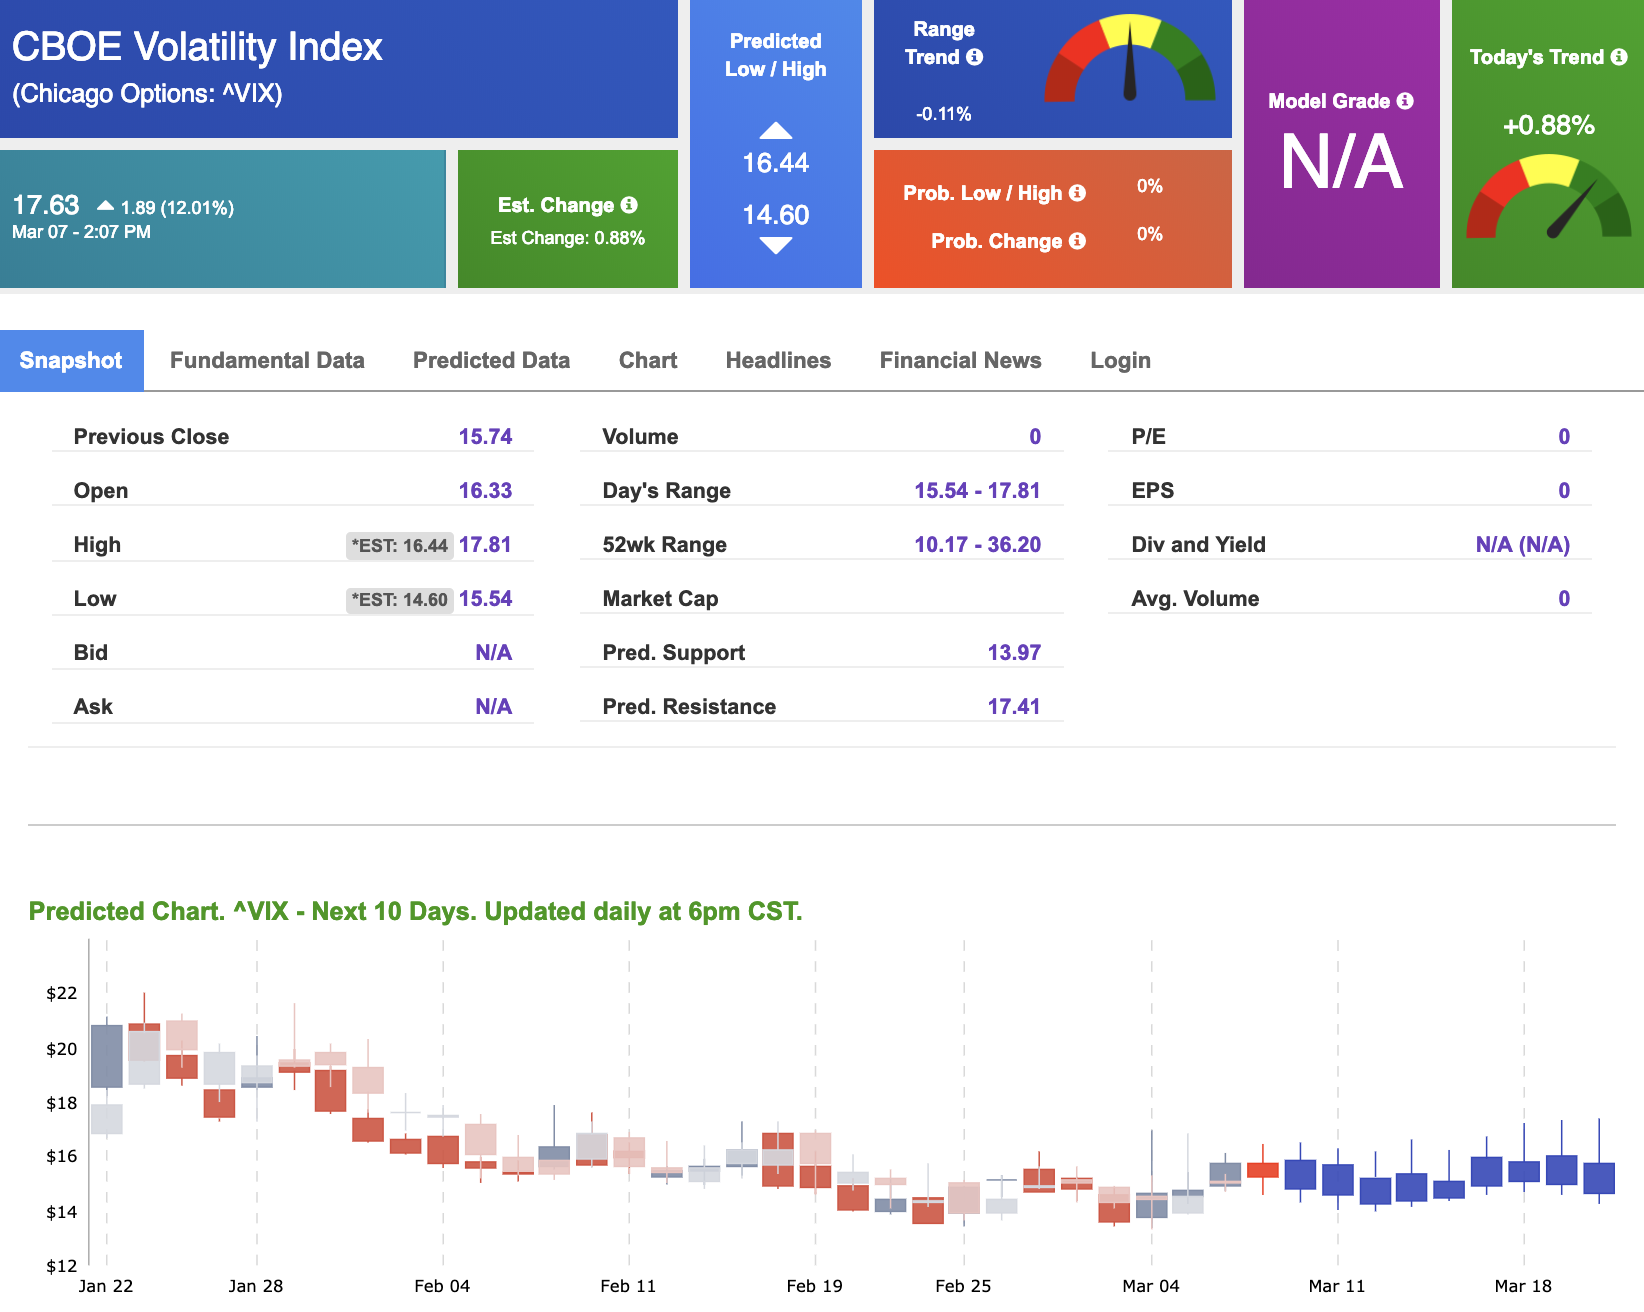
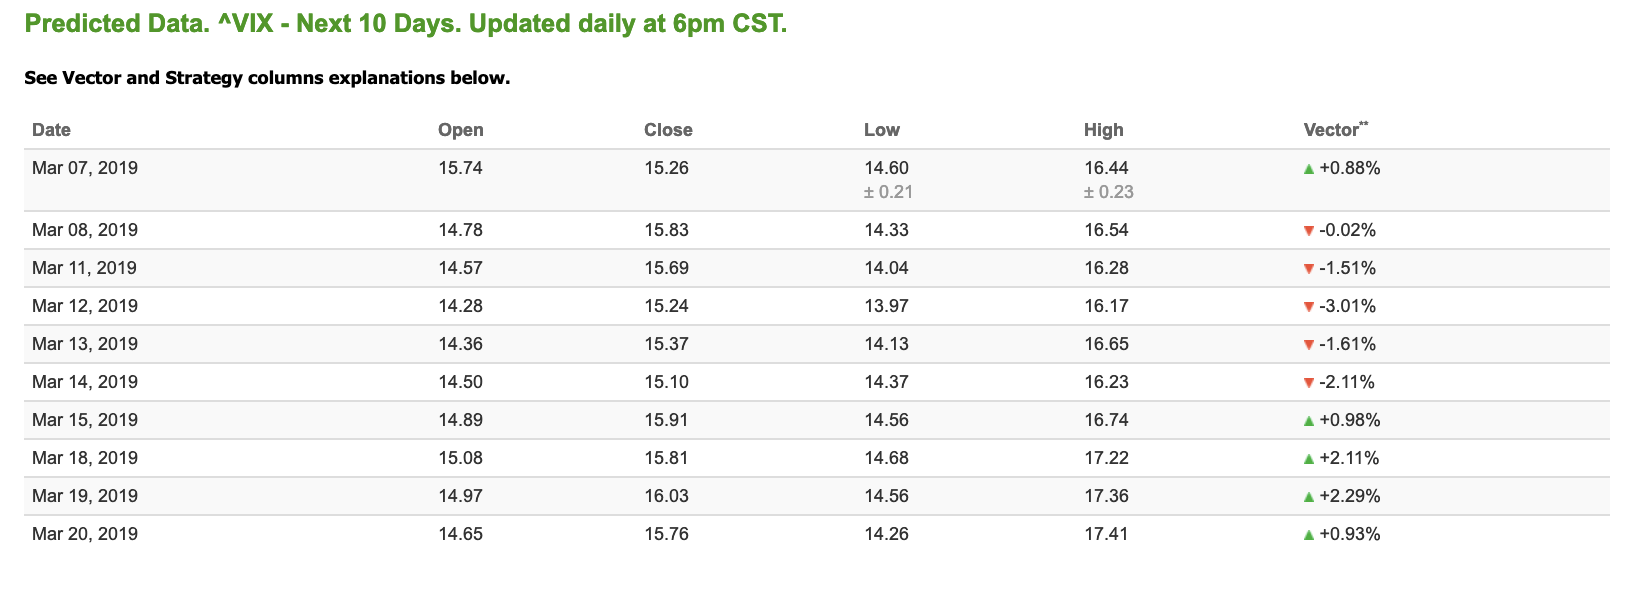
The CBOE Volatility Index (^VIX) is up 12.01% at $17.63 at the time of publication, and our 10-day prediction window shows mixed signals. The predicted close for tomorrow is $15.83 with a vector of -0.02%. Prediction data is uploaded after market close at 6 p.m., CST. Today’s data is based on market signals from the previous trading session.
