
Fresh 2025 Market Lows Fail to Hold
8:00am (EST)
The stock market traded on both sides of the ledger on Friday after the bears pushed fresh lows for the year while cracking key support levels for the fourth-straight session. The afternoon recovery failed to produce a higher high than the previous day with the near-term outlook remaining bearish.
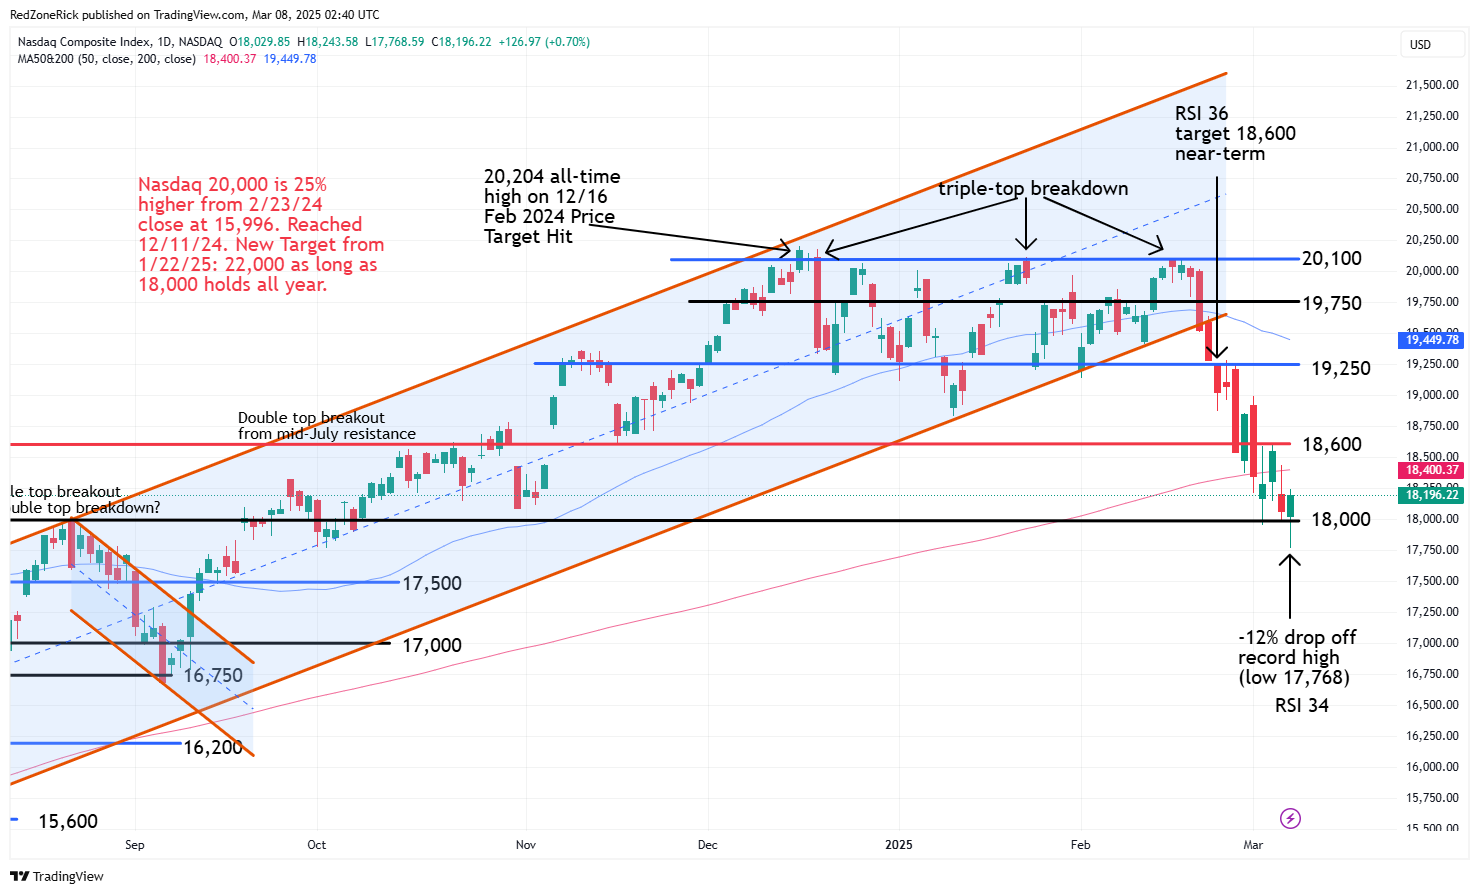
The Nasdaq closed at 18,196 (+0.7%) with the afternoon high at 18,243. Lowered resistance at 18,250 was challenged and held. Key support is at 18,000.
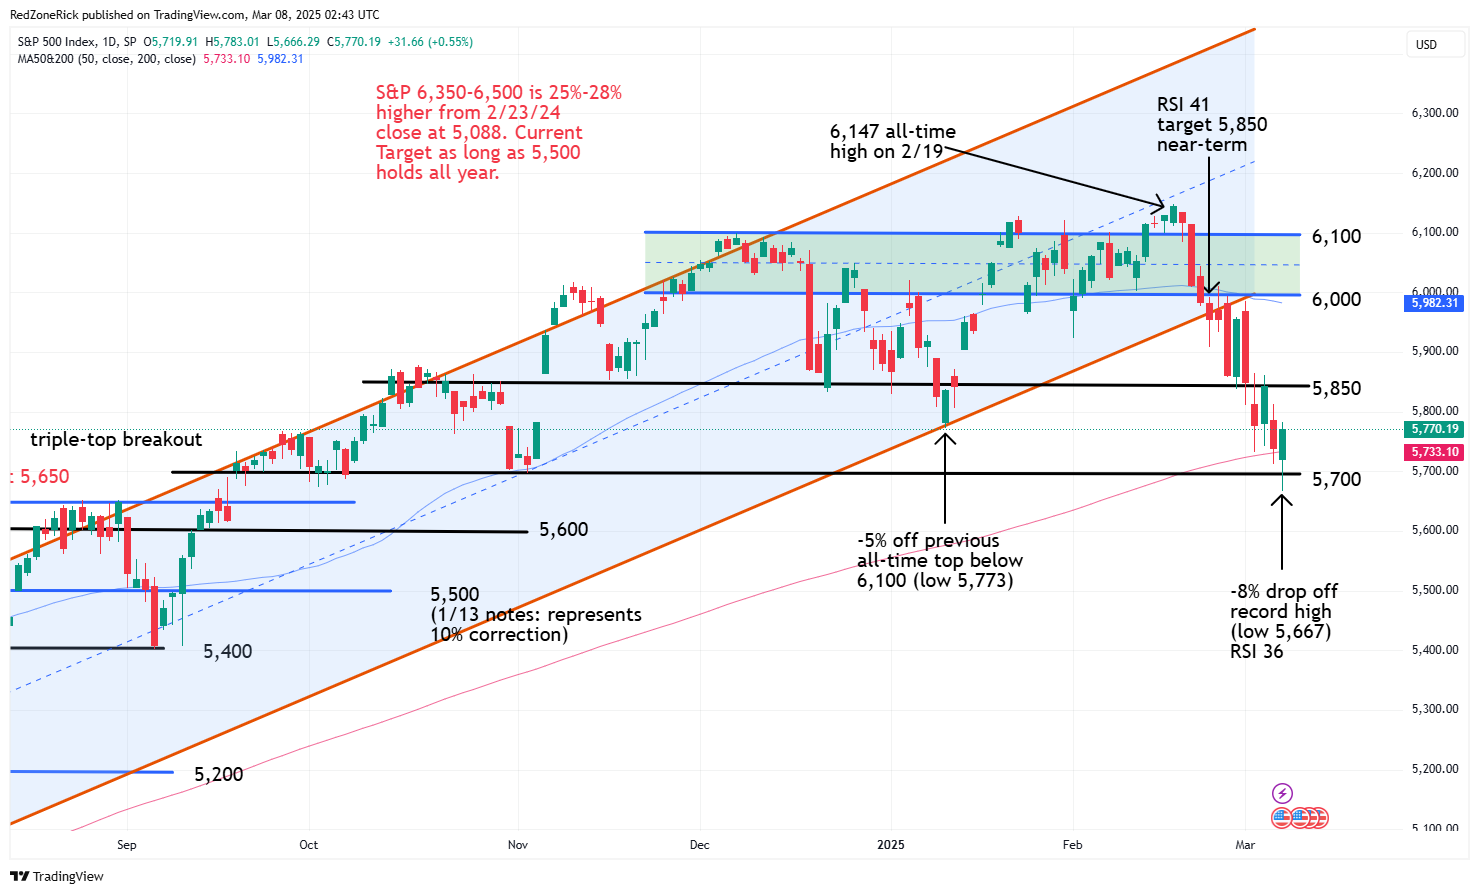
The S&P 500 traded up to 5,783 while settling at 5,842 (+0.6%). New resistance at 5,800 held. Key support is at 5,700.
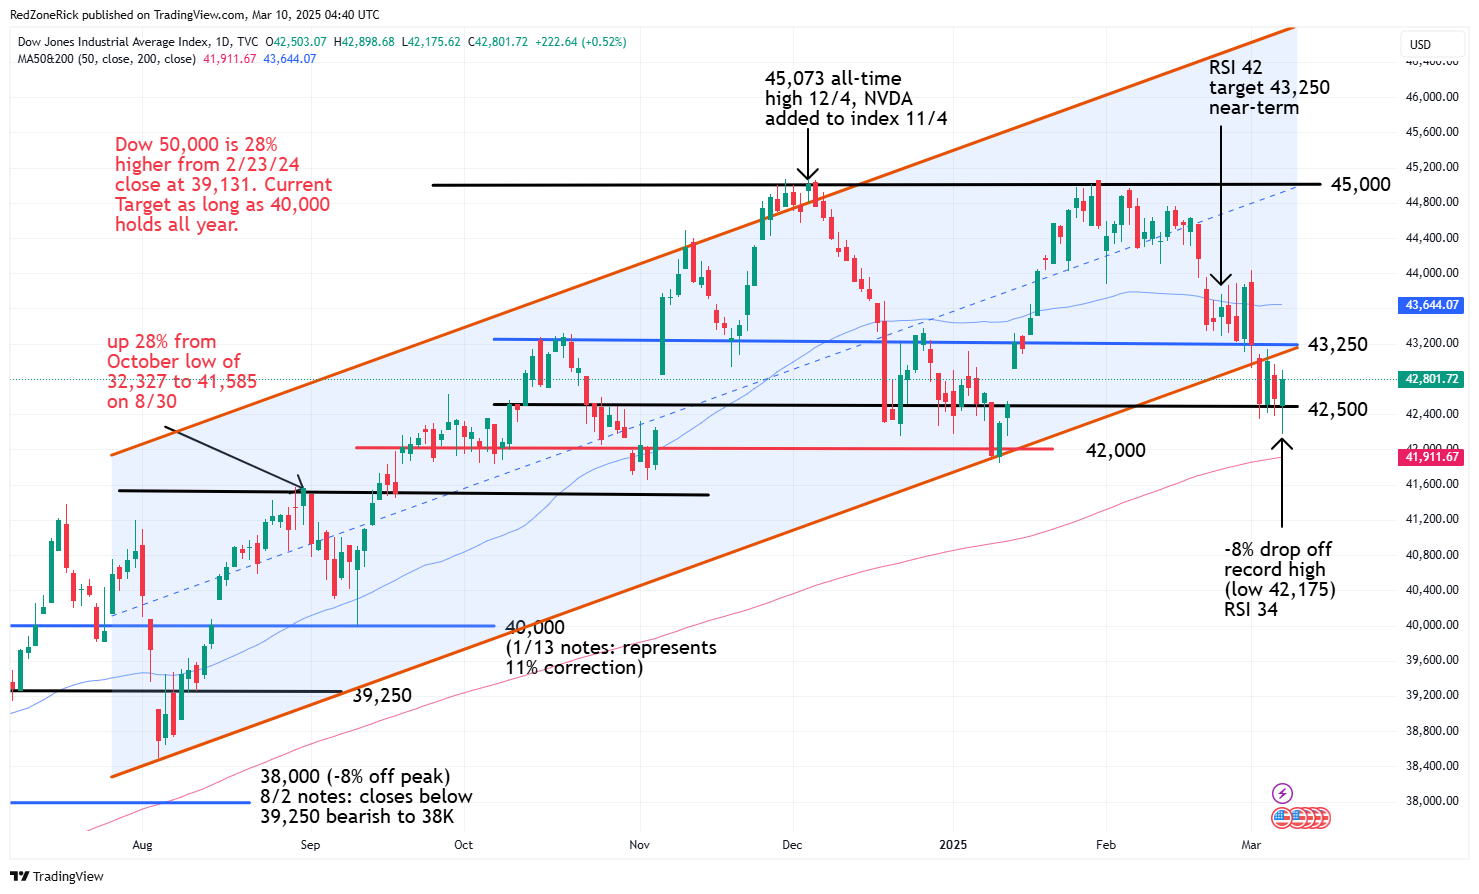
The Dow ended at 42,801 (+0.5%) following the rebound to 42,898. Current resistance at 43,000 was approached and held. Support remains at 42,500.
Earnings and Economic News
Before the open: BioNTech (BNTX), NET Power (NPWR), Telos (TLS)
After the close: Asana (ASAN), Oracle (ORCL), Vail Resorts (MTN)
Economic News
None
Technical Outlook and Market Thoughts
For the week the S&P 500 sank 3.1%; the Dow fell 2.4%; the Nasdaq dropped 3.5%; and the Russell tanked 4%. Additionally, the losses from the all-time highs has entered double-digits for Tech and the small-caps while the Dow and the S&P have kept the losses from the record highs in the single digits.
The Nasdaq was down 12% from its December 16th all-time high at 20,204 on Friday’s trip to 17,768. Key support at 18,000 was breached for the third time in four sessions but held. Multiple closes below this level would indicate additional weakness towards 17,500-17,000 with the latter representing a 16% selloff.
Lowered resistance is at 18,250 followed by 18,400 and the 200-day moving average. Closes back above 18,600-18,800 would indicate a possible near-term bottom.
The S&P kissed an intraday low of 5,667 on Friday which represented a 8% pullback from the February 19th record top at 6,147. Key support from early November at 5,700 and the 200-day moving average were tripped but held. Continued closes below this level would get a further fade to 5,650-5,600 in play and support from mid-September.
Lowered resistance is at 5,800-5,850 followed by 5,900. A close above 6,000 and the 50-day moving average would be a more bullish development of a near-term bottom. This level also represents the bottom of the prior trading range.
The Dow held key support at 42,500 for the fourth-straight session with the bottom hitting 42,175. Backup support levels are at 42,000-41,500 on a close below this level with the latter representing an 8% drop from the lifetime high of 45,073 from November 4th.
Key resistance remains at 43,250. A pop above this level could imply upside to 43,500-43,750 and the 50-day moving average.
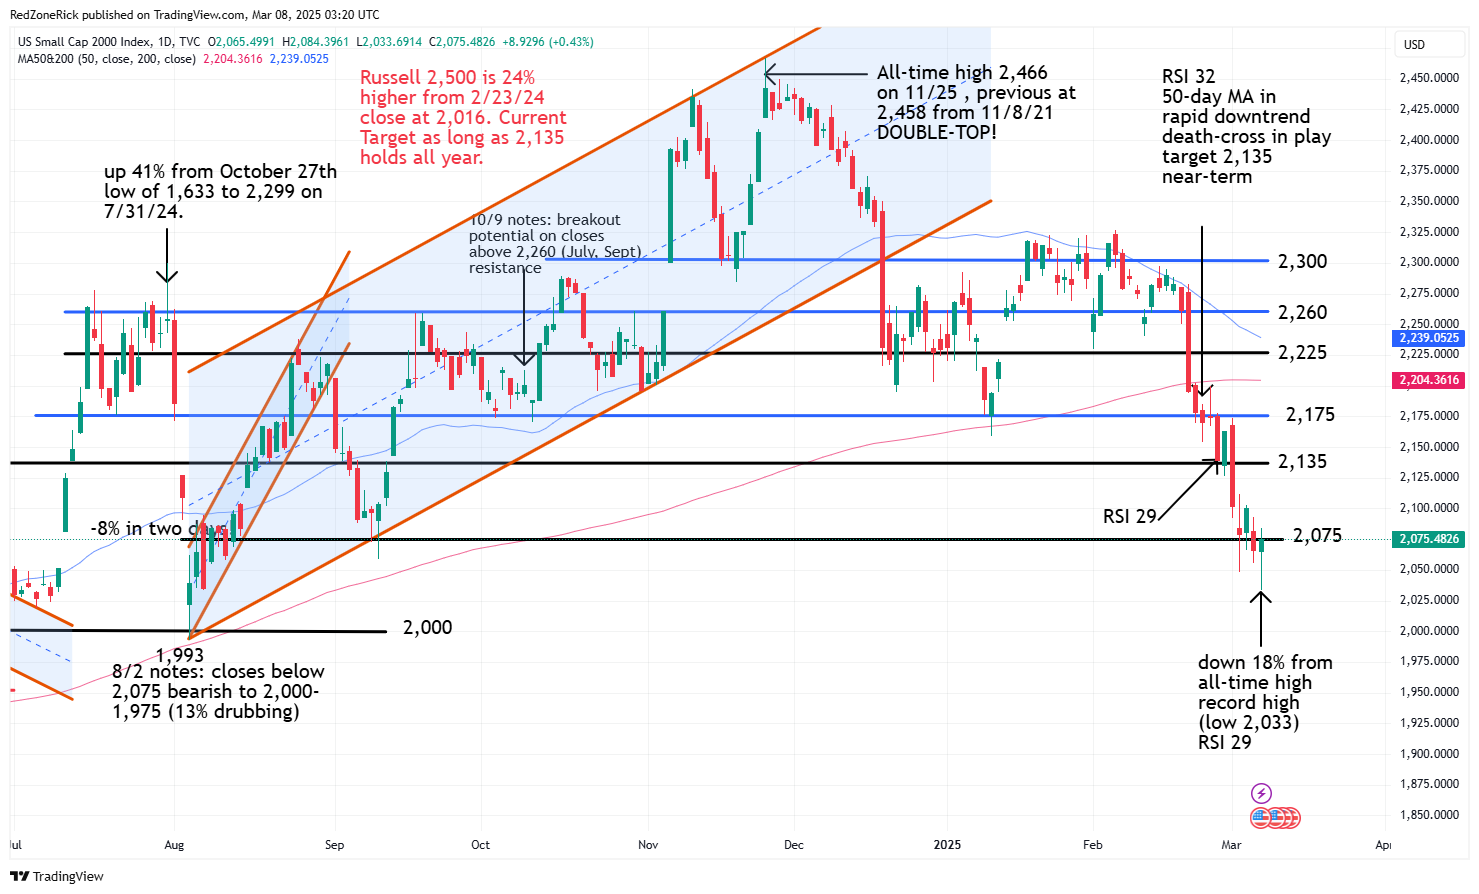
The Russell 2000 was down 18% intraday on Friday from its all-time record high of 2,466 after trading down to 2,033 and the August 7th low. Key support at 2,025 held. A drop below this level would likely indicate weakness to 2,000 with the August 5th low at 1,993.
Lowered resistance is 2,100 followed by 2,135. Additional hurdles are at 2,175-2,200 and the 200-day moving average.
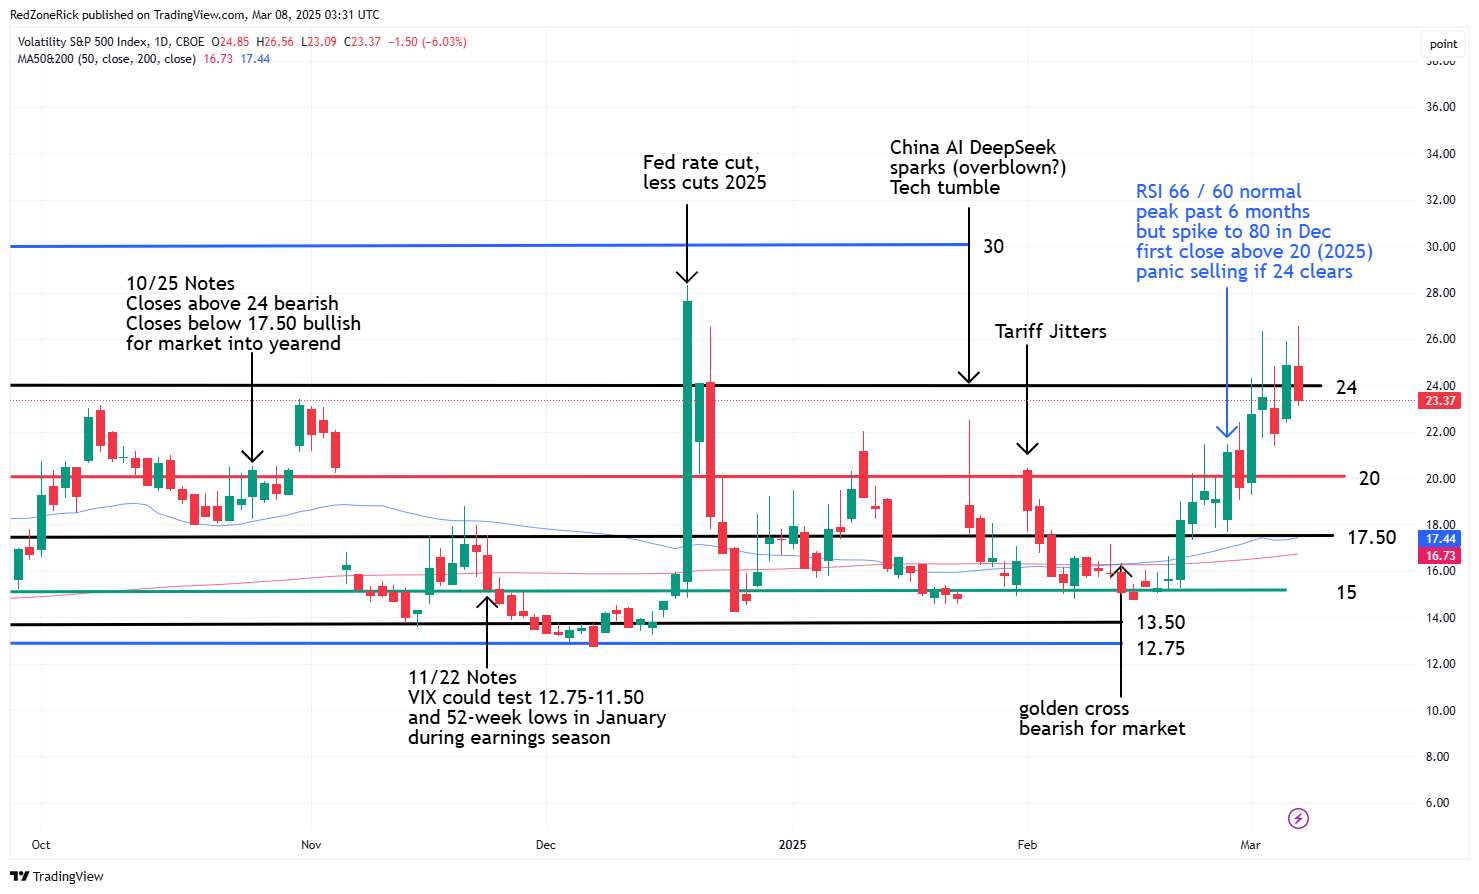
The Volatility Index (VIX) tagged a fresh 2025 high of 26.56 with mid-December resistance at 26-28 getting stretched and holding. There is still upside risk to 30 with a move above this level creating a little “blood-in-the-streets” moment for the market.
New support remains at 22.50-20. A close below the latter would be slightly bullish for the market with the possibility of a retest to 17.50 and the 50-day moving average.
The higher high and a higher low on Friday for the VIX remains an ongoing bearish development. Volatility gave us the perfect clue in mid-February the market was headed for lower lows after the golden cross confirmed higher highs on the index.
The tariff headlines will keep volatility heightened as the updates seem to change every day and sometimes even hourly. This is why it is so important to use technical analysis on a daily basis as it helps in tracking the trend (up or down) and to control your emotions.
The charts for the major indexes remain bearish, as expected, following the worst week of the year. Technically speaking, a drop of 10%-20% for an index or stock is considered a correction. Losses above 20% from the peak for an asset is considered a bear market.
The major indexes bounced off oversold levels throughout last week and still face multiple layers of resistance. As money moves out of certain sectors or stocks and into others, there will be opportunities as investors look for safe heavens.
As far as the RSI (relative strength index) levels for the major indexes, 30 held throughout last week with the Russell’s RSI failing to recover this level on Friday. There is still a chance the mid to low 20’s come into play on lower market lows and typically where bargain hunters start to step in.