

Global Markets Soar with Latest U.S-China Announcement
Markets are rallying behind growing global trade optimism after a tentative date for resuming trade talks between the U.S-China was set for early October.
Positive Beige Book reading good news for the markets
Other news supporting stocks today includes solid economic reports, such as the latest labor data and a positive Beige Book reading from all twelve Federal Districts, as well as easing global tensions.
Market is range-bound and not a true breakout
The market has broken out of August range of $280-$295 but the question on everyone’s mind remains whether this is a true break out, initiating a bull market, or a fault breakout. We remain in our belief that market is range-bound and not a true breakout until we see other asset classes, such as XLU, TLT, EEM, and DXY for example, breakout out of their existing trends.
(Want free training resources? Check our our training section for videos and tips!)
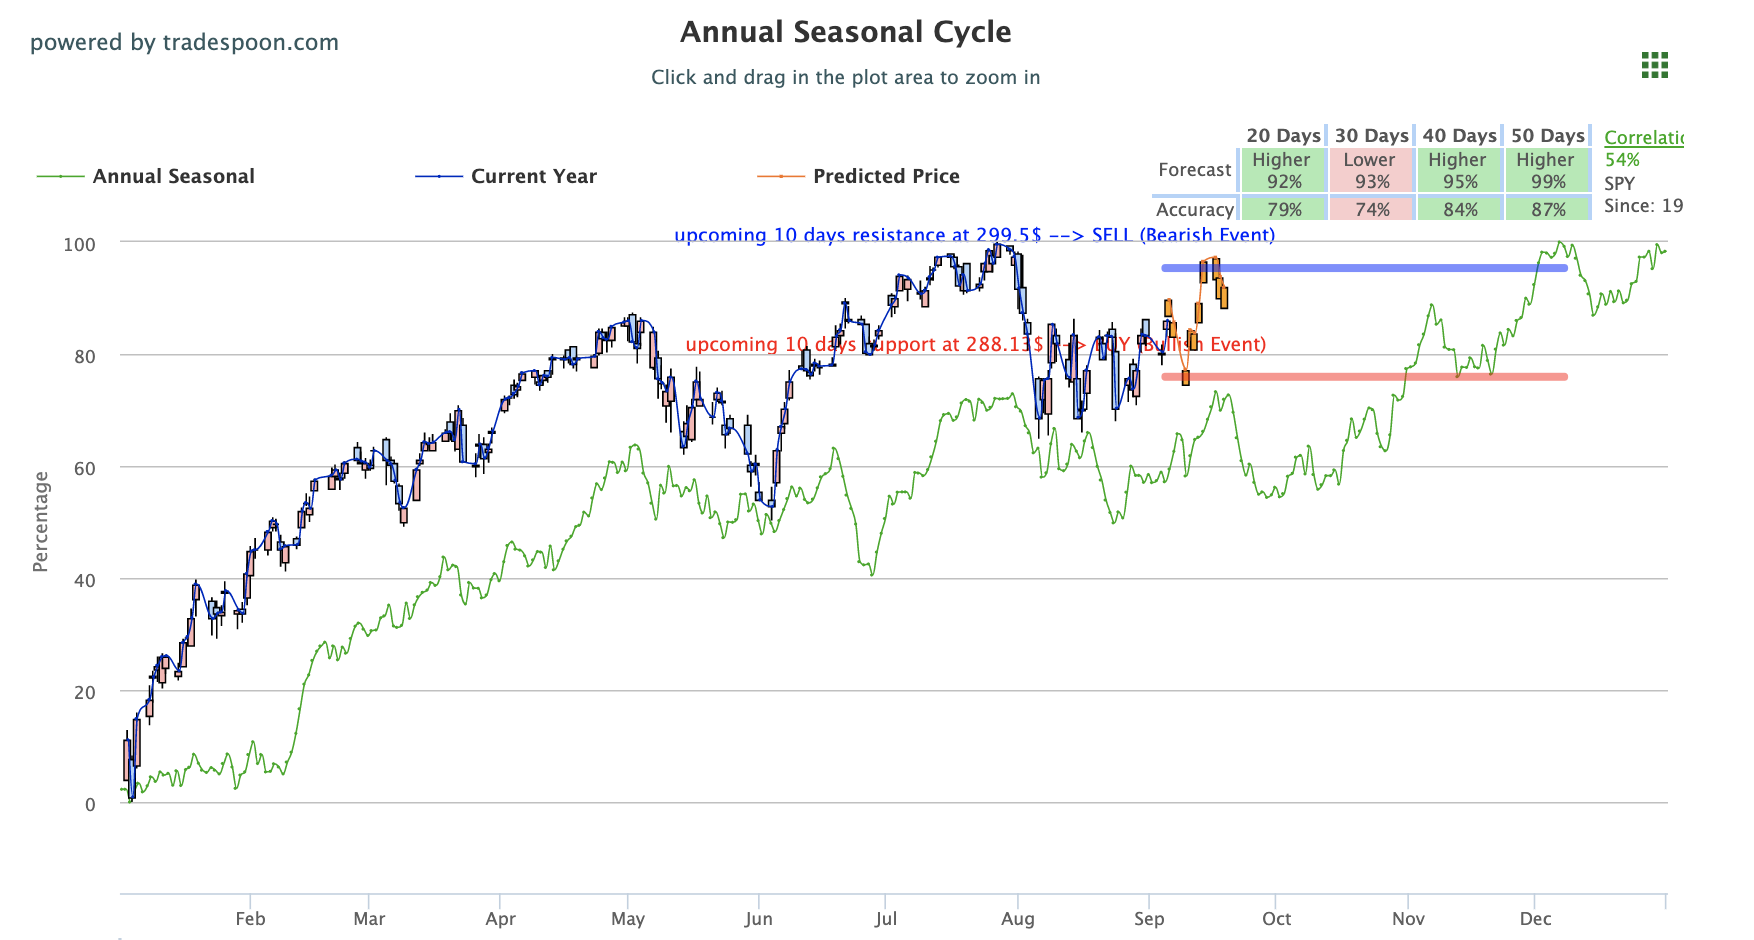
SPY Seasonal Chart
The SPY is currently trading between $294-$302 and we do not see the potential for the market to overshoot its all-time high at $302. With further volatility expected, we will look to buy when SPY is near $282 and sell near $300. Readers of Market Commentary are encouraged to maintain clearly defined stop levels for all positions. For reference, the SPY Seasonal Chart is shown below:
U.S. indices to close for the second straight day in the green
After a slow start to the week, major U.S. indices have rebounded impressively, currently on track to close for the second straight day in the green. With a new date set for negotiations following last week’s tariffs increases, markets responded positively both in the U.S. and overseas.
Asian markets closed in the green today after Easing tensions in Hong Kong
Easing tensions in Hong Kong have also assisted as Asian markets closed in the green today while European markets, excluding the U.K., also saw gains today.
U.K.’s parliament look to exten the Brexit deadline by a couple of months
U.K.’s parliament is looking to block Boris Johnson’s latest effort to force an exit from the EU by the end of October. They look to regain scheduling power and extending the Brexit deadline by a couple of months. The latest U.S. economic reports continue to project the economy growing at a modest pace with all 12 Federal Districts reporting steady growth.
Yesterday’s Beige Book is still being reviewed by experts and analysts alike and looks to be affecting markets today. Productivity and labor costs were up in the second-quarter while factory orders grew at a steady rate. The latest positive economic data and signs of global trade progress have helped stocks rise sharply.
Important economic data in the further days
August employment data will be released tomorrow and includes unemployment rate, nonfarm payrolls, and average hourly earnings. Next week look for consumer credit, job openings, producer price index, core CPI, Federal budget, and retail sales reports. September remains light in economic data and events with earnings, the next FOMC, and China-U.S. negotiations taking place in October.
(Want free training resources? Check our our training section for videos and tips!)
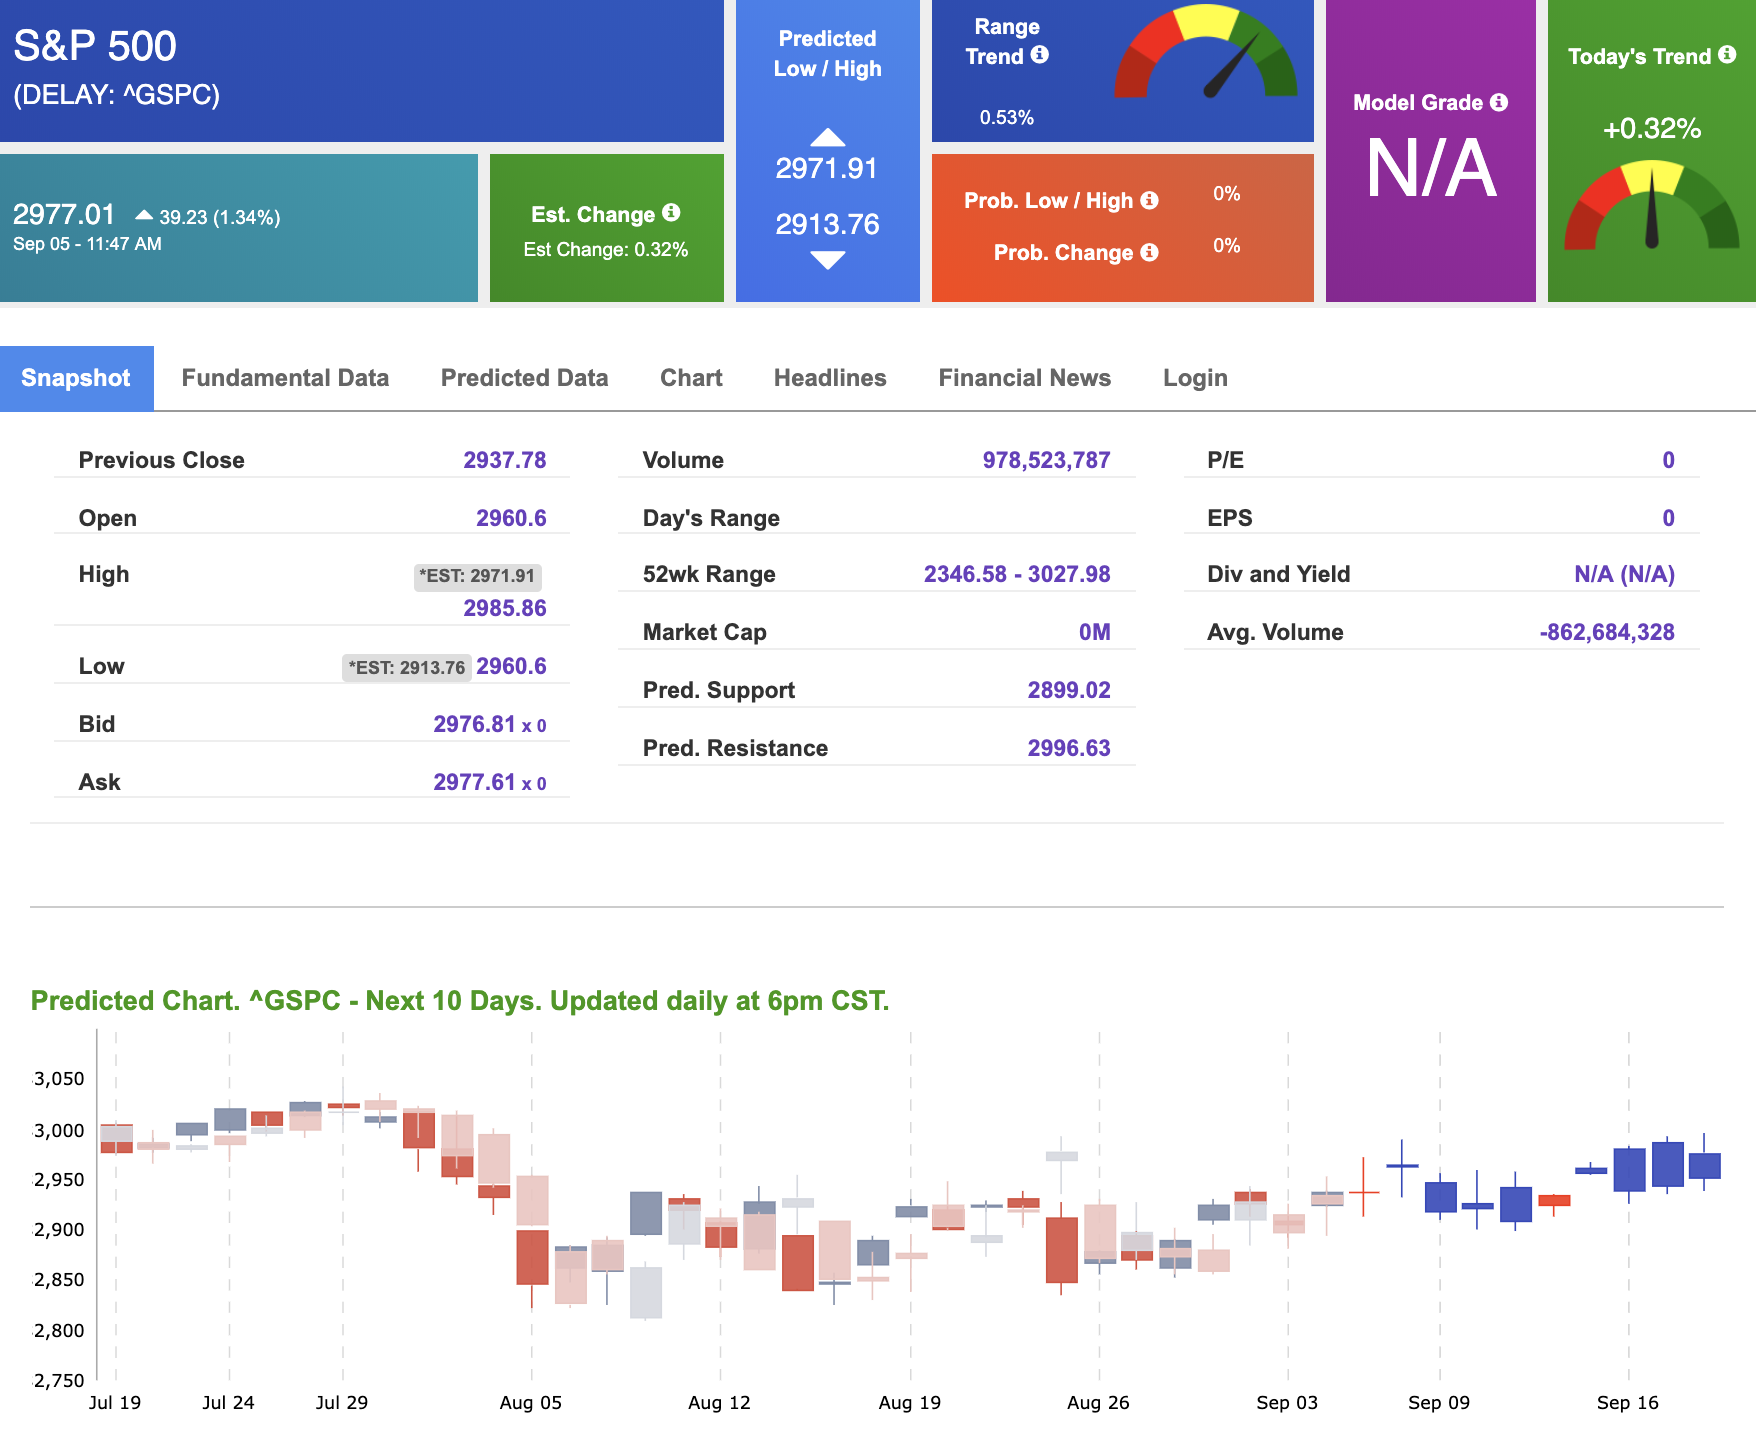
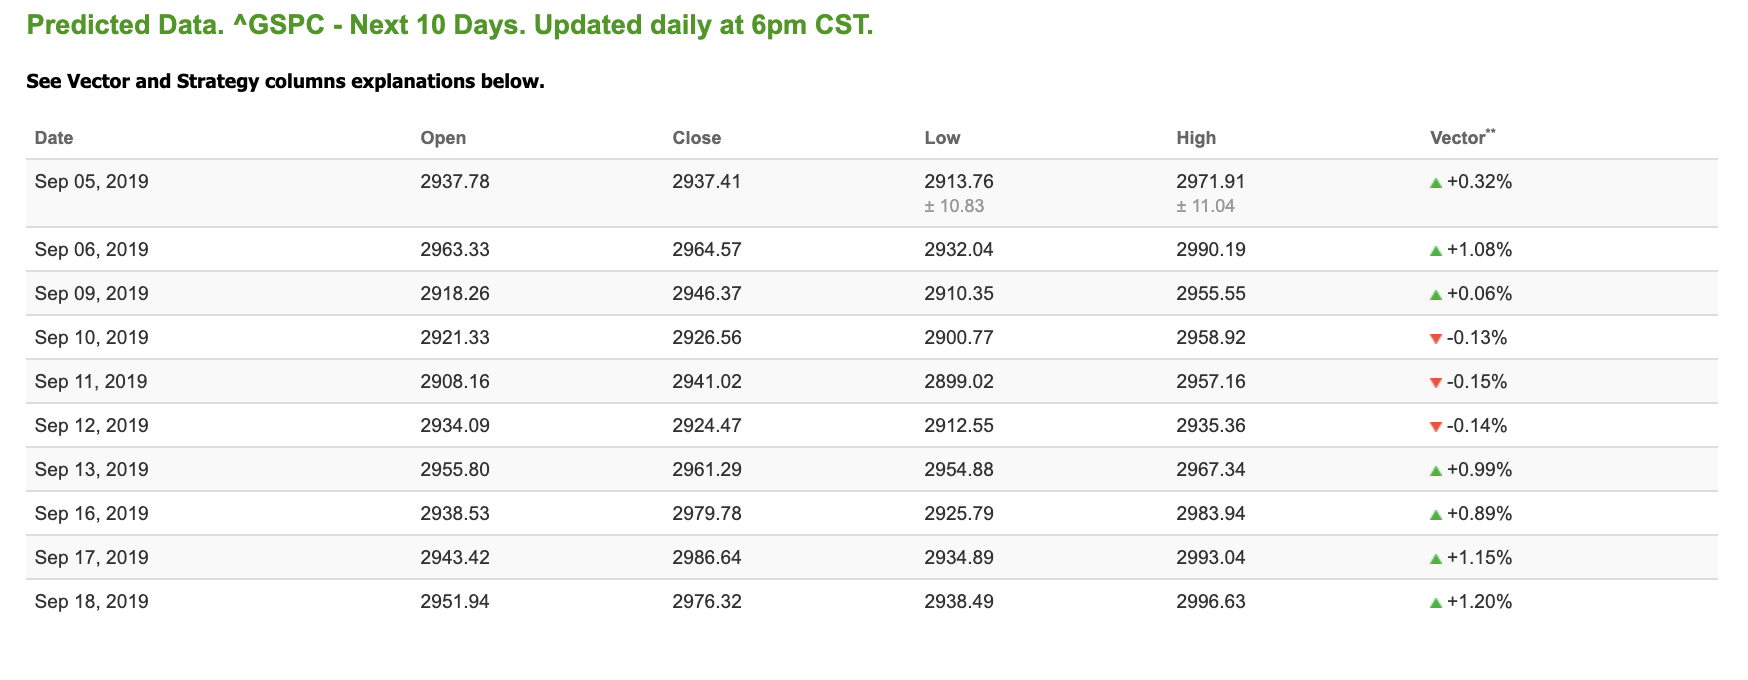
Using the “^GSPC” symbol to analyze the S&P 500 our 10-day prediction window shows mixed signals. Today’s vector figure of +0.32% moves to -0.14% in five trading sessions. The predicted close for tomorrow is 2,963.33. Prediction data is uploaded after the market close at 6 pm, CST. Today’s data is based on market signals from the previous trading session.
Here’s the short version of what our Premium Service can do for you:
Trailing 36-month return. . . 1,342%!
What people are saying about Tradespoon:
Mauricio F. Member since August 2017
I really like your site and am learning from the videos and I made several good profitable trades following your site recommendations and advice.?
I used your site advice to buy 3 Netflix (NFLX) call options and I Paid $8.20 for two $270 call options 16 Feb… A half-hour later they were selling for $10.50! Your site predicted that NFLX would increase in price and I decide to buy one more of the same option and paid $10.30. Friday the Bid = $11.65 and Ask = $11.95…
I calculated that the gain is so far is about 17% against the money that I used to purchase the options.
CLICK HERE TO LEARN MORE
Highlight of a Recent Winning Trade
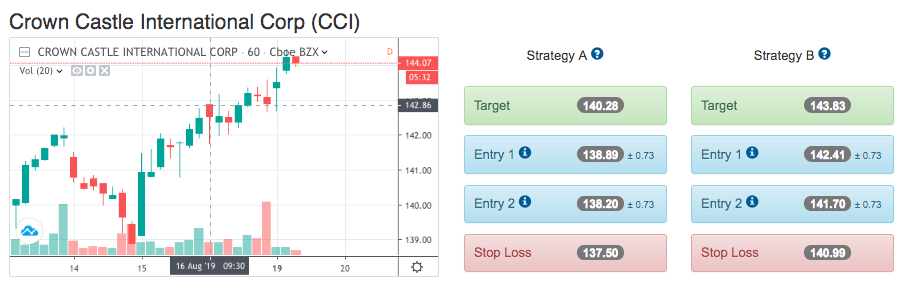
On August 16th, our ActiveTrader service produced a bullish recommendation for Crown Castle International (CCI). ActiveTrader is included in all paid Tradespoon membership plans and is designed for day trading.
Trade Breakdown
CCI entered its forecasted Strategy B Entry 1 price range $142.41 (± 0.73) in its first hour of trading and passed through its Target price $143.83 in the first hour of trading the following trading day. The Stop Loss price was set at $137.15
Friday Morning Featured Symbol
*Please note: At the time of publication we do not own the featured symbol, STX. Our featured symbol is part of your free subscription service. It is not included in any paid Tradespoon subscription service. Vlad Karpel only trades his own personal money in paid subscription services. If you are a paid subscriber, please review your Premium Member Picks, ActiveTrader or MonthlyTrader recommendations. If you are interested in receiving Vlad’s personal picks, please click here.
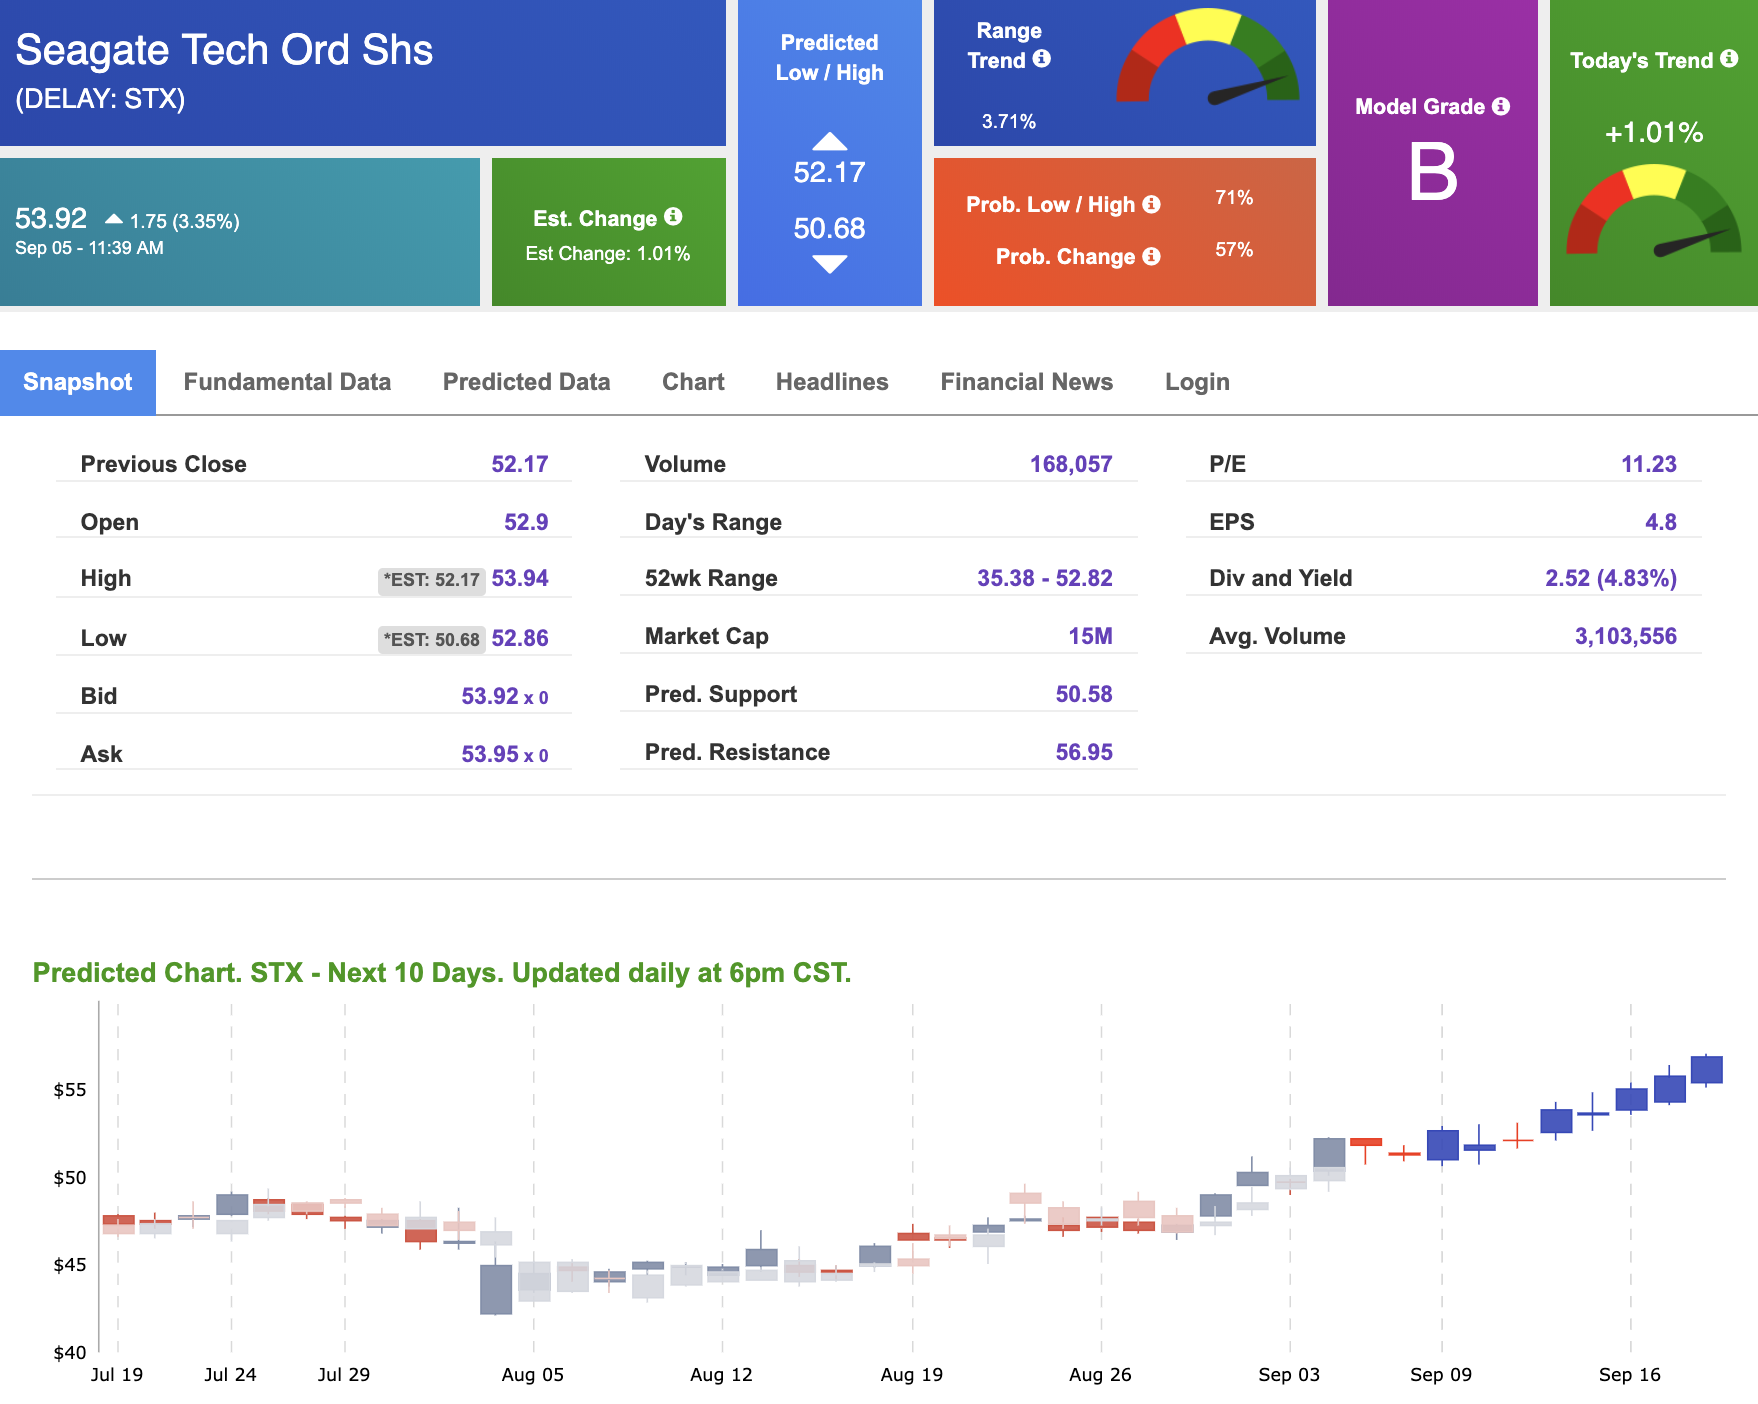
Our featured symbol for Friday is Seagate Technology (STX). STX is showing a confident vector trend in our Stock Forecast Toolbox’s 10-day forecast. This stock is assigned a Model Grade of (B) indicating it ranks in the top 25th percentile for accuracy for predicted support and resistance, relative to our entire data universe.
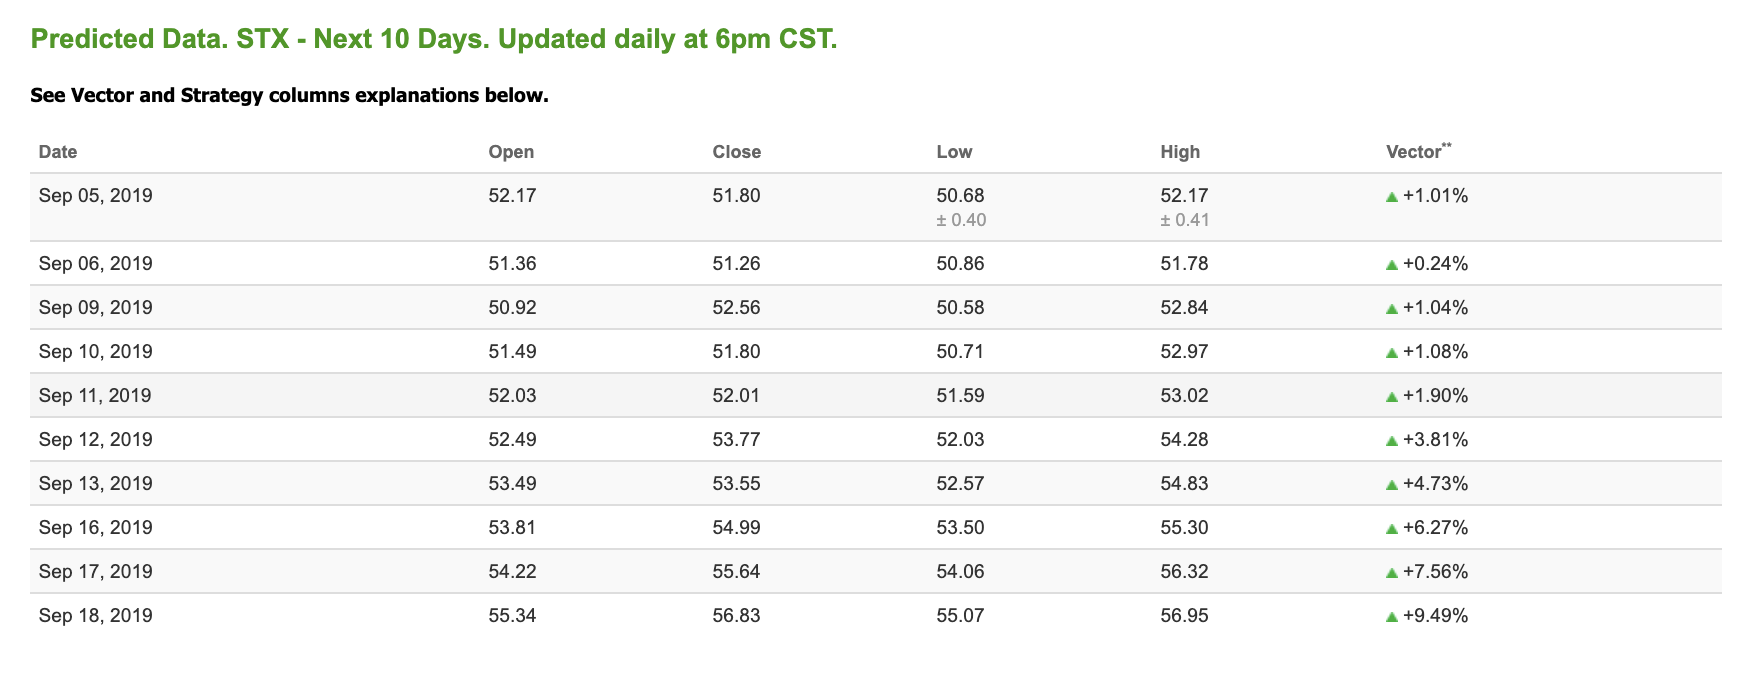
The stock is trading at $53.92 at the time of publication, up 3.35% from the open with a +1.01% vector figure.
Prediction data is uploaded after market close at 6 p.m., CST. Today’s data is based on market signals from the previous trading session.
Note: The Vector column calculates the change of the Forecasted Average Price for the next trading session relative to the average of actual prices for the last trading session. The column shows expected average price movement “Up or Down”, in percent. Trend traders should trade along the predicted direction of the Vector. The higher the value of the Vector the higher its momentum.
Oil
West Texas Intermediate for Crude Oil delivery (CL.1) is priced at $56.75 per barrel, up 0.87% from the open, at the time of publication.
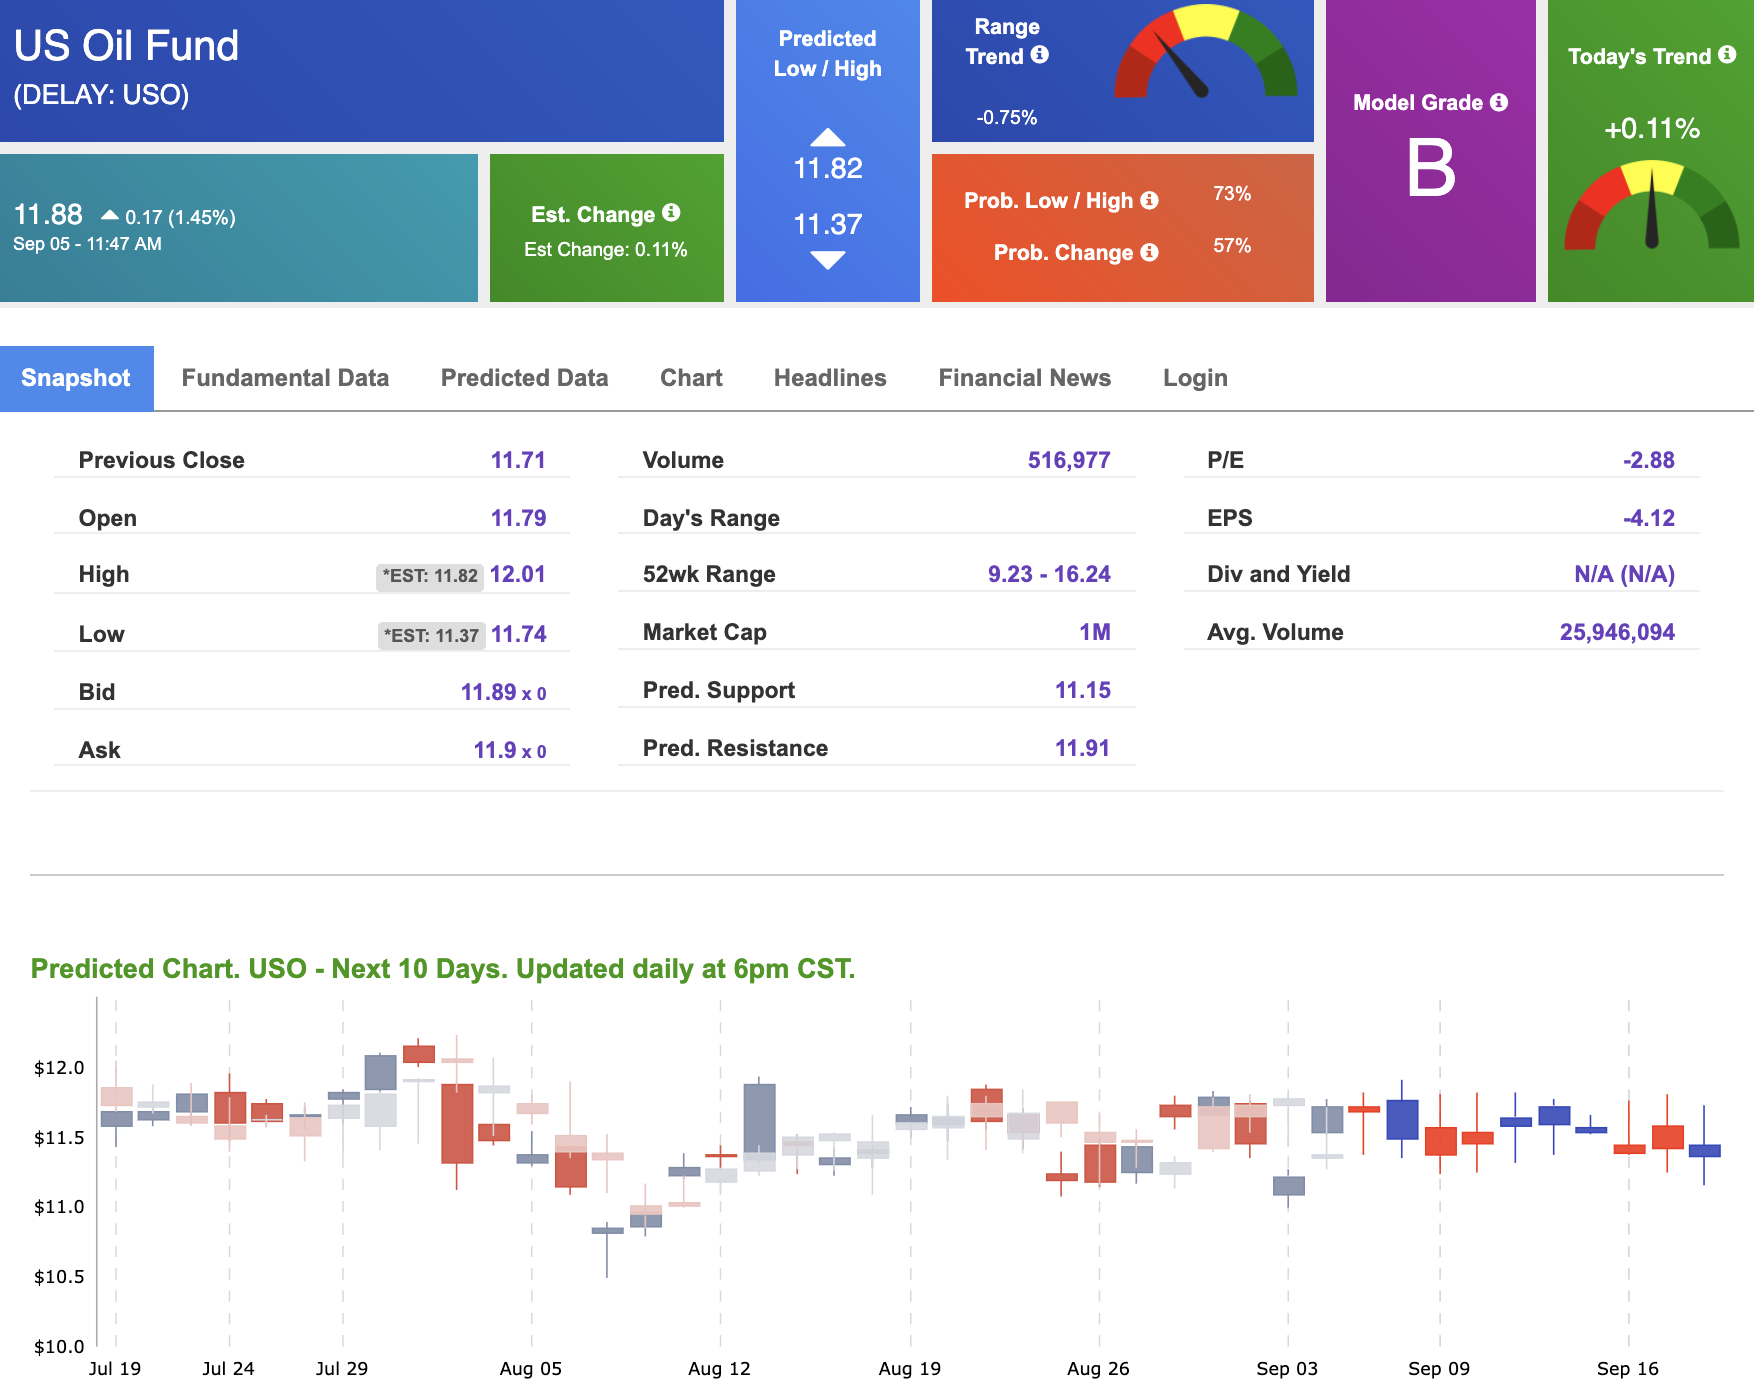
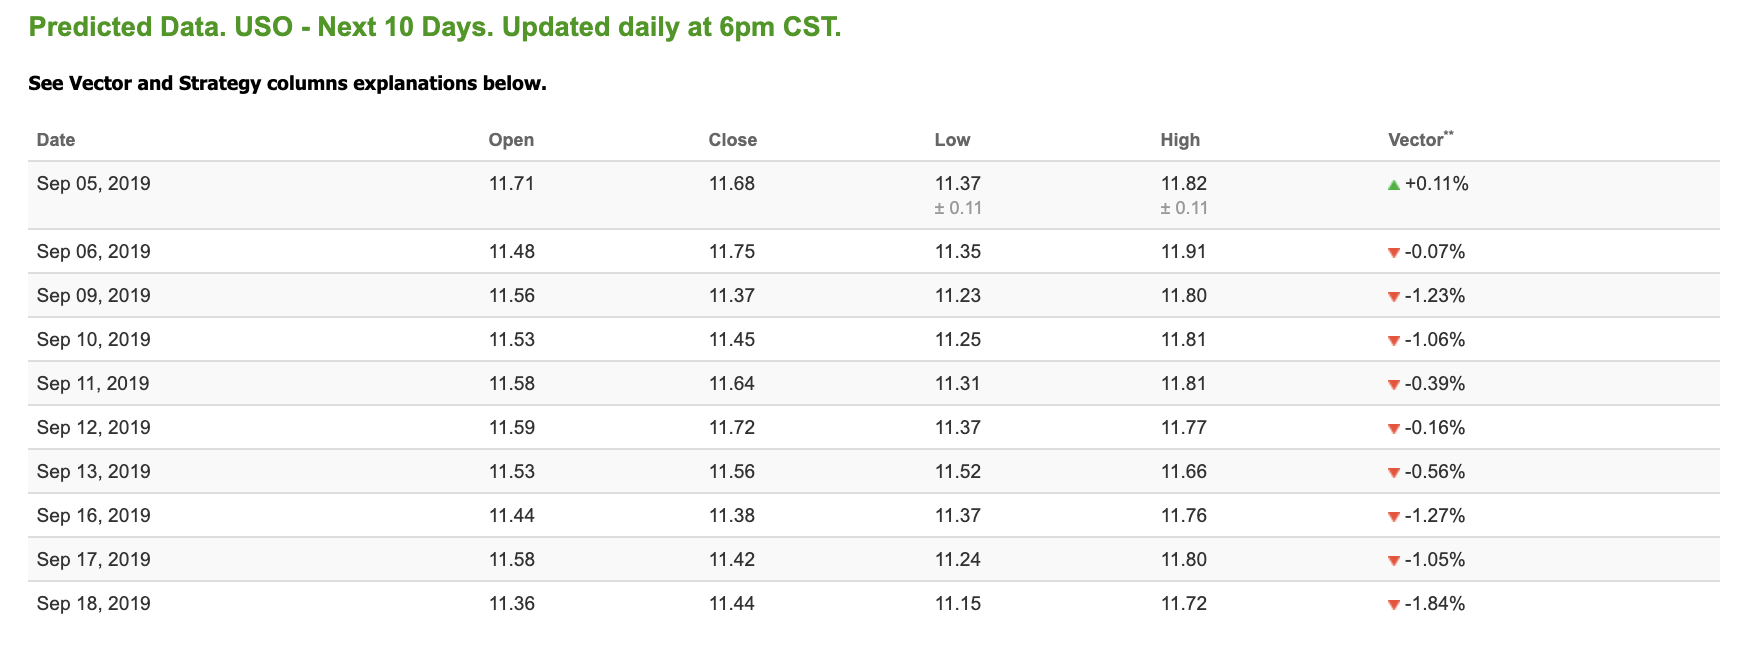
Looking at USO, a crude oil tracker, our 10-day prediction model shows mixed signals. The fund is trading at $11.88 at the time of publication, up 1.45% from the open. Vector figures show +0.11% today, which turns -0.16% in five trading sessions. Prediction data is uploaded after market close at 6 p.m., CST. Today’s data is based on market signals from the previous trading session.
(Want free training resources? Check our our training section for videos and tips!)
Gold
The price for the Gold Continuous Contract (GC00) is down 2.18% at $1,526.40 at the time of publication.
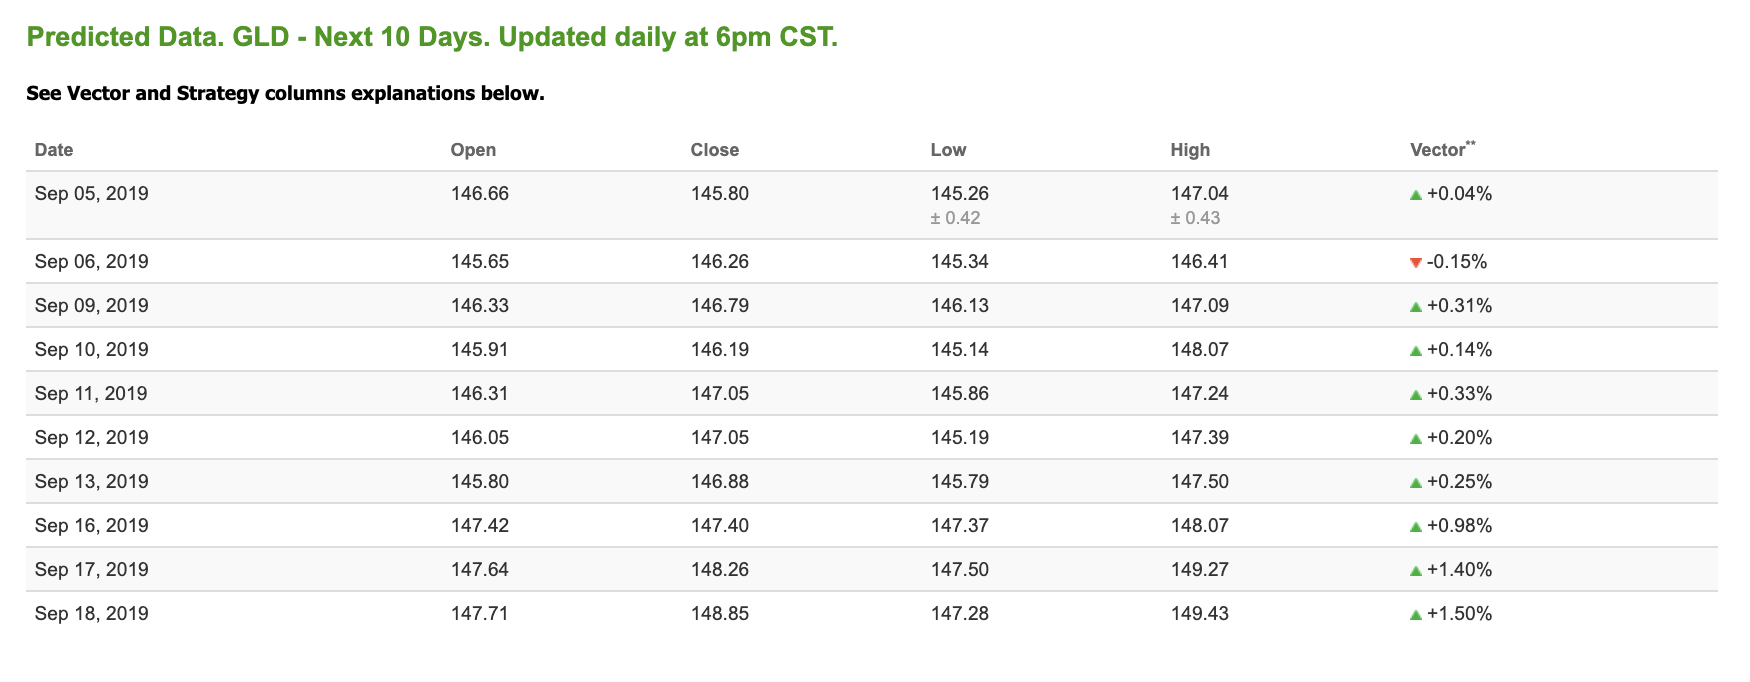
Using SPDR GOLD TRUST (GLD) as a tracker in our Stock Forecast Tool, the 10-day prediction window shows mostly positive signals. The gold proxy is trading at $143.12, down 2.41% at the time of publication. Vector signals show +0.04% for today. Prediction data is uploaded after market close at 6 p.m., CST. Today’s data is based on market signals from the previous trading session.
(Want free training resources? Check our our training section for videos and tips!)

Treasuries
The yield on the 10-year Treasury note is up 6.50% at 1.56% at the time of publication. The yield on the 30-year Treasury note is up 4.34% at 2.06% at the time of publication.
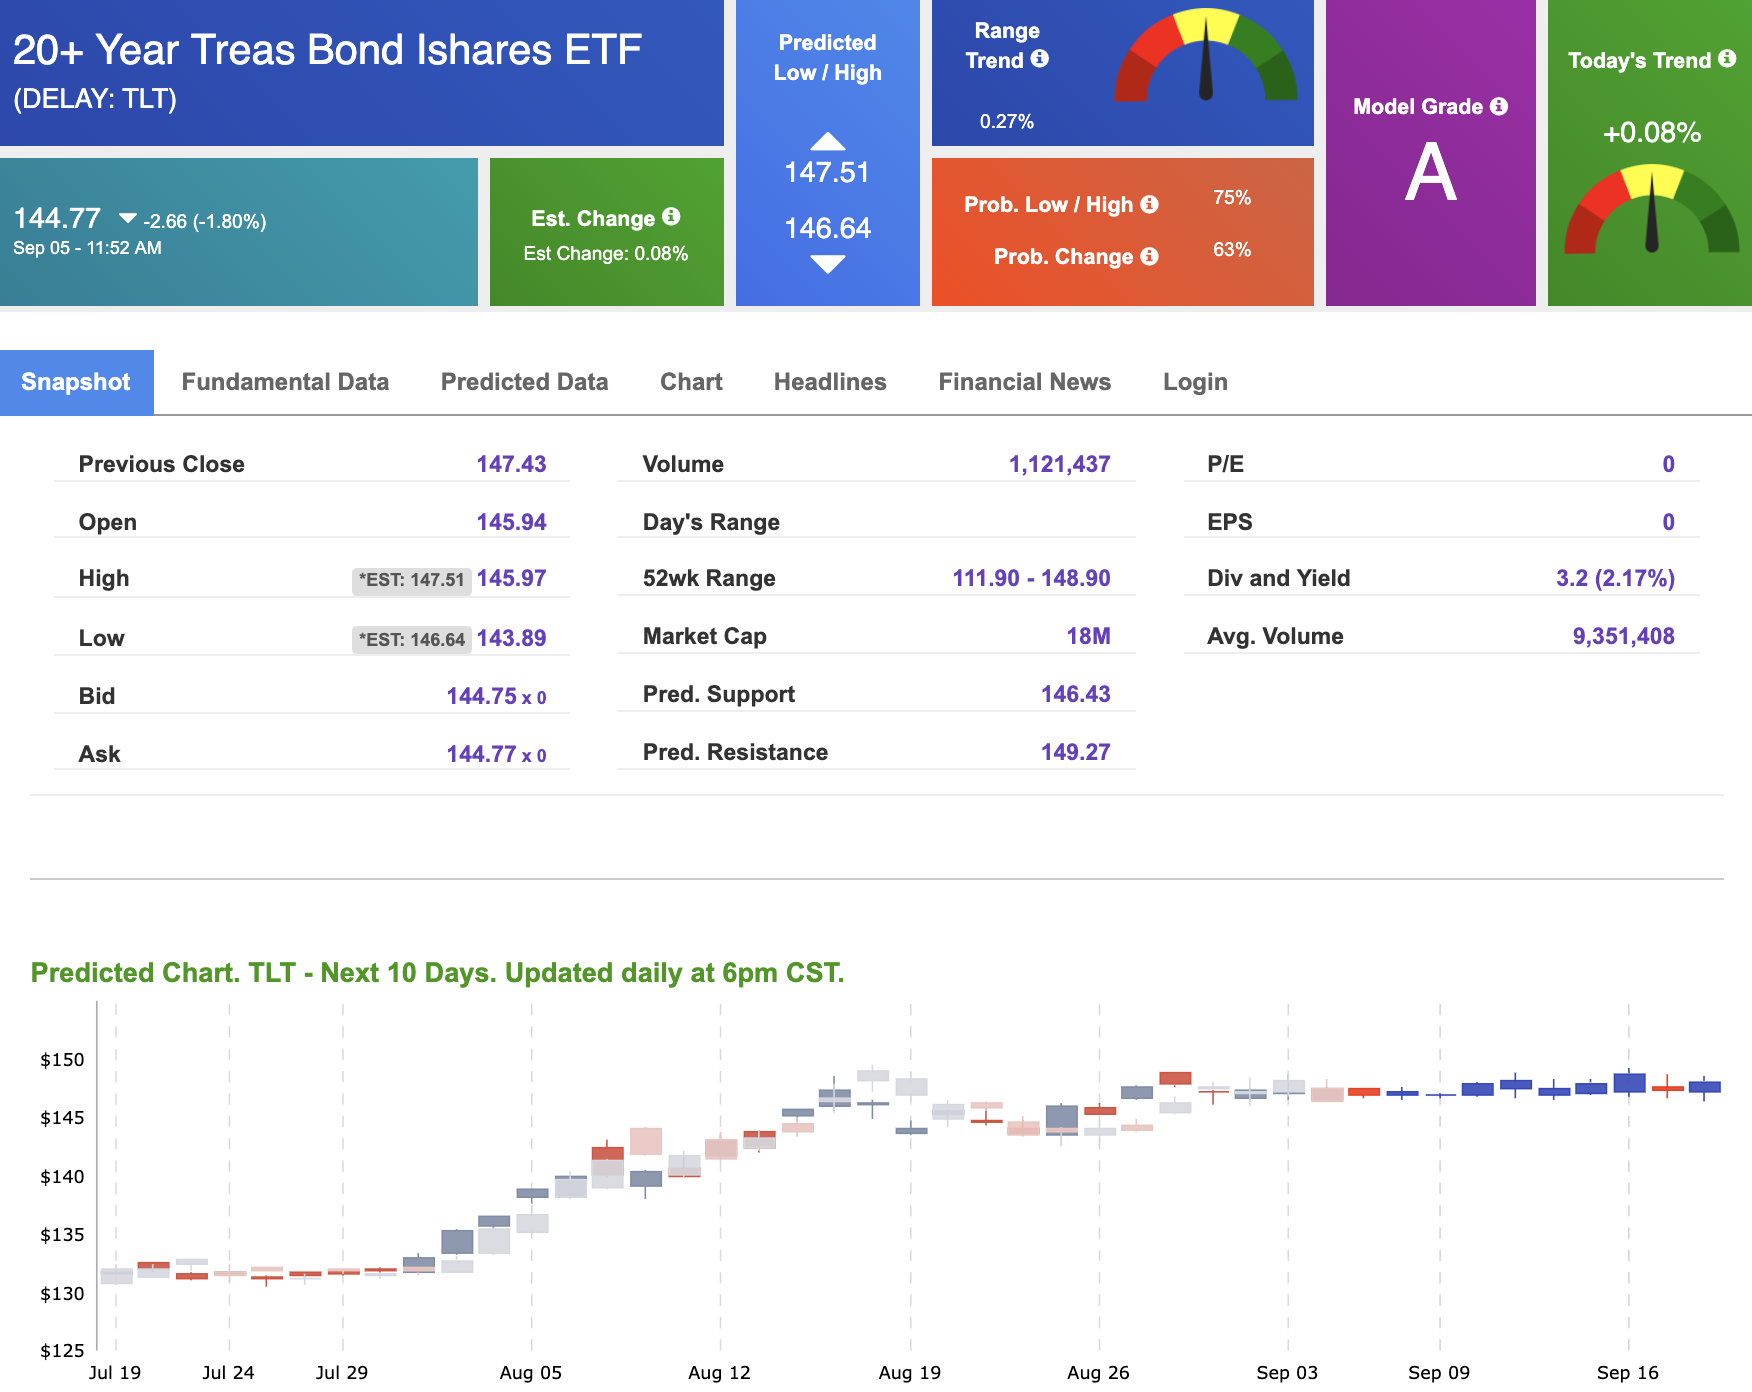
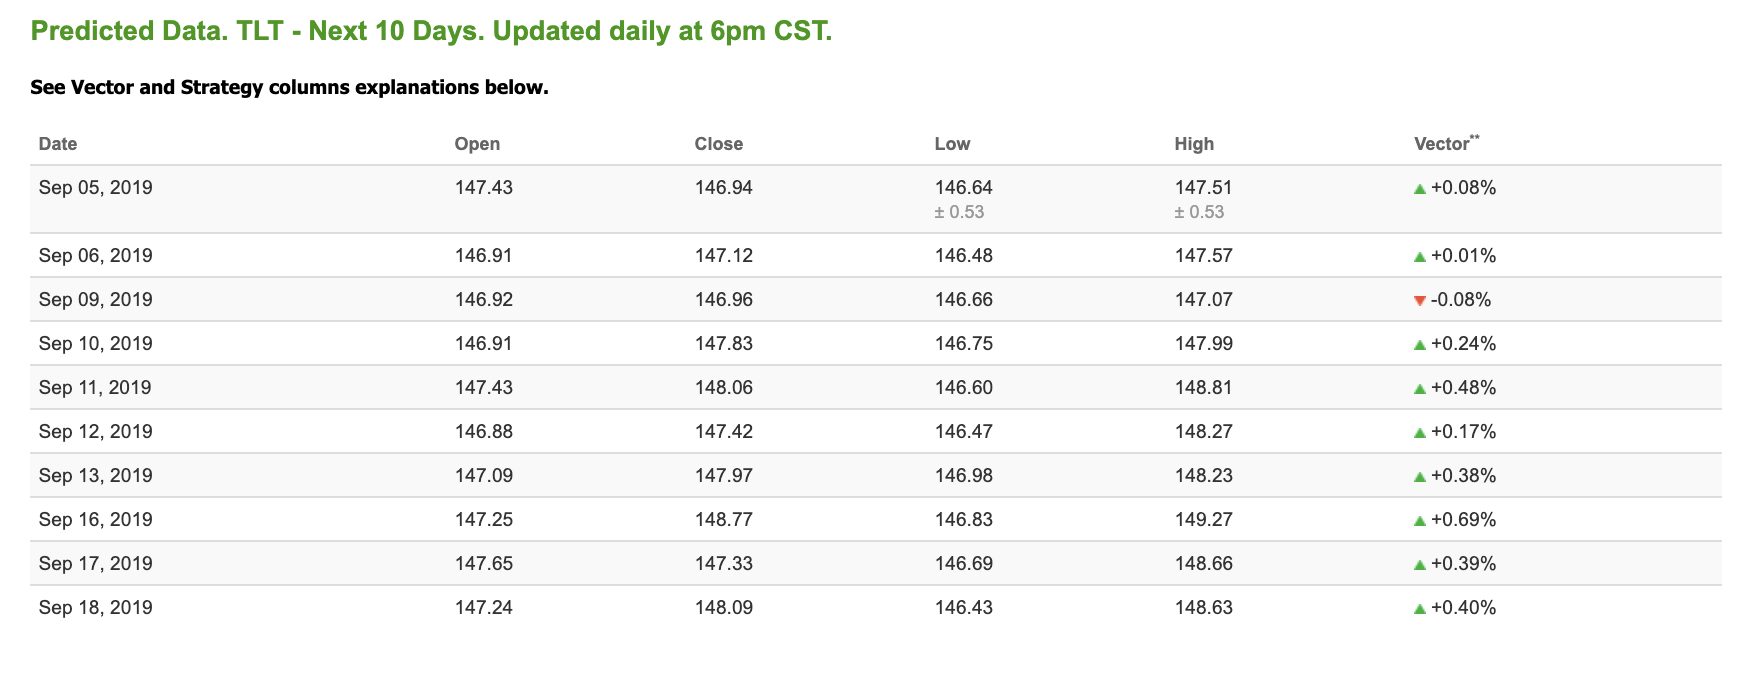
Using the iShares 20+ Year Treasury Bond ETF (TLT) as a proxy for bond prices in our Stock Forecast Tool, we see positive signals in our 10-day prediction window. Today’s vector of +0.08% moves to +0.24% in three sessions. Prediction data is uploaded after market close at 6 p.m., CST. Today’s data is based on market signals from the previous trading session.
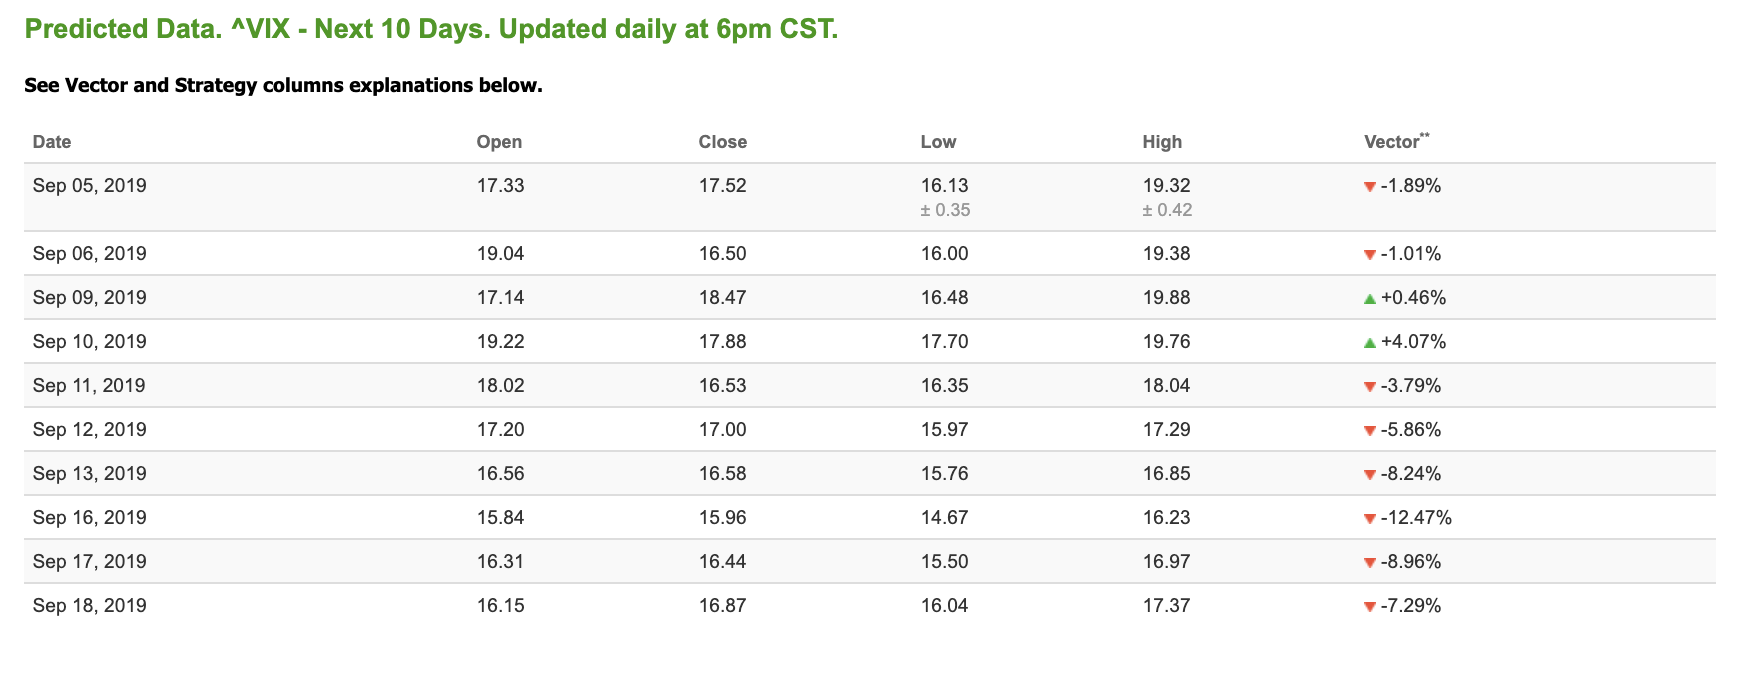
Volatility
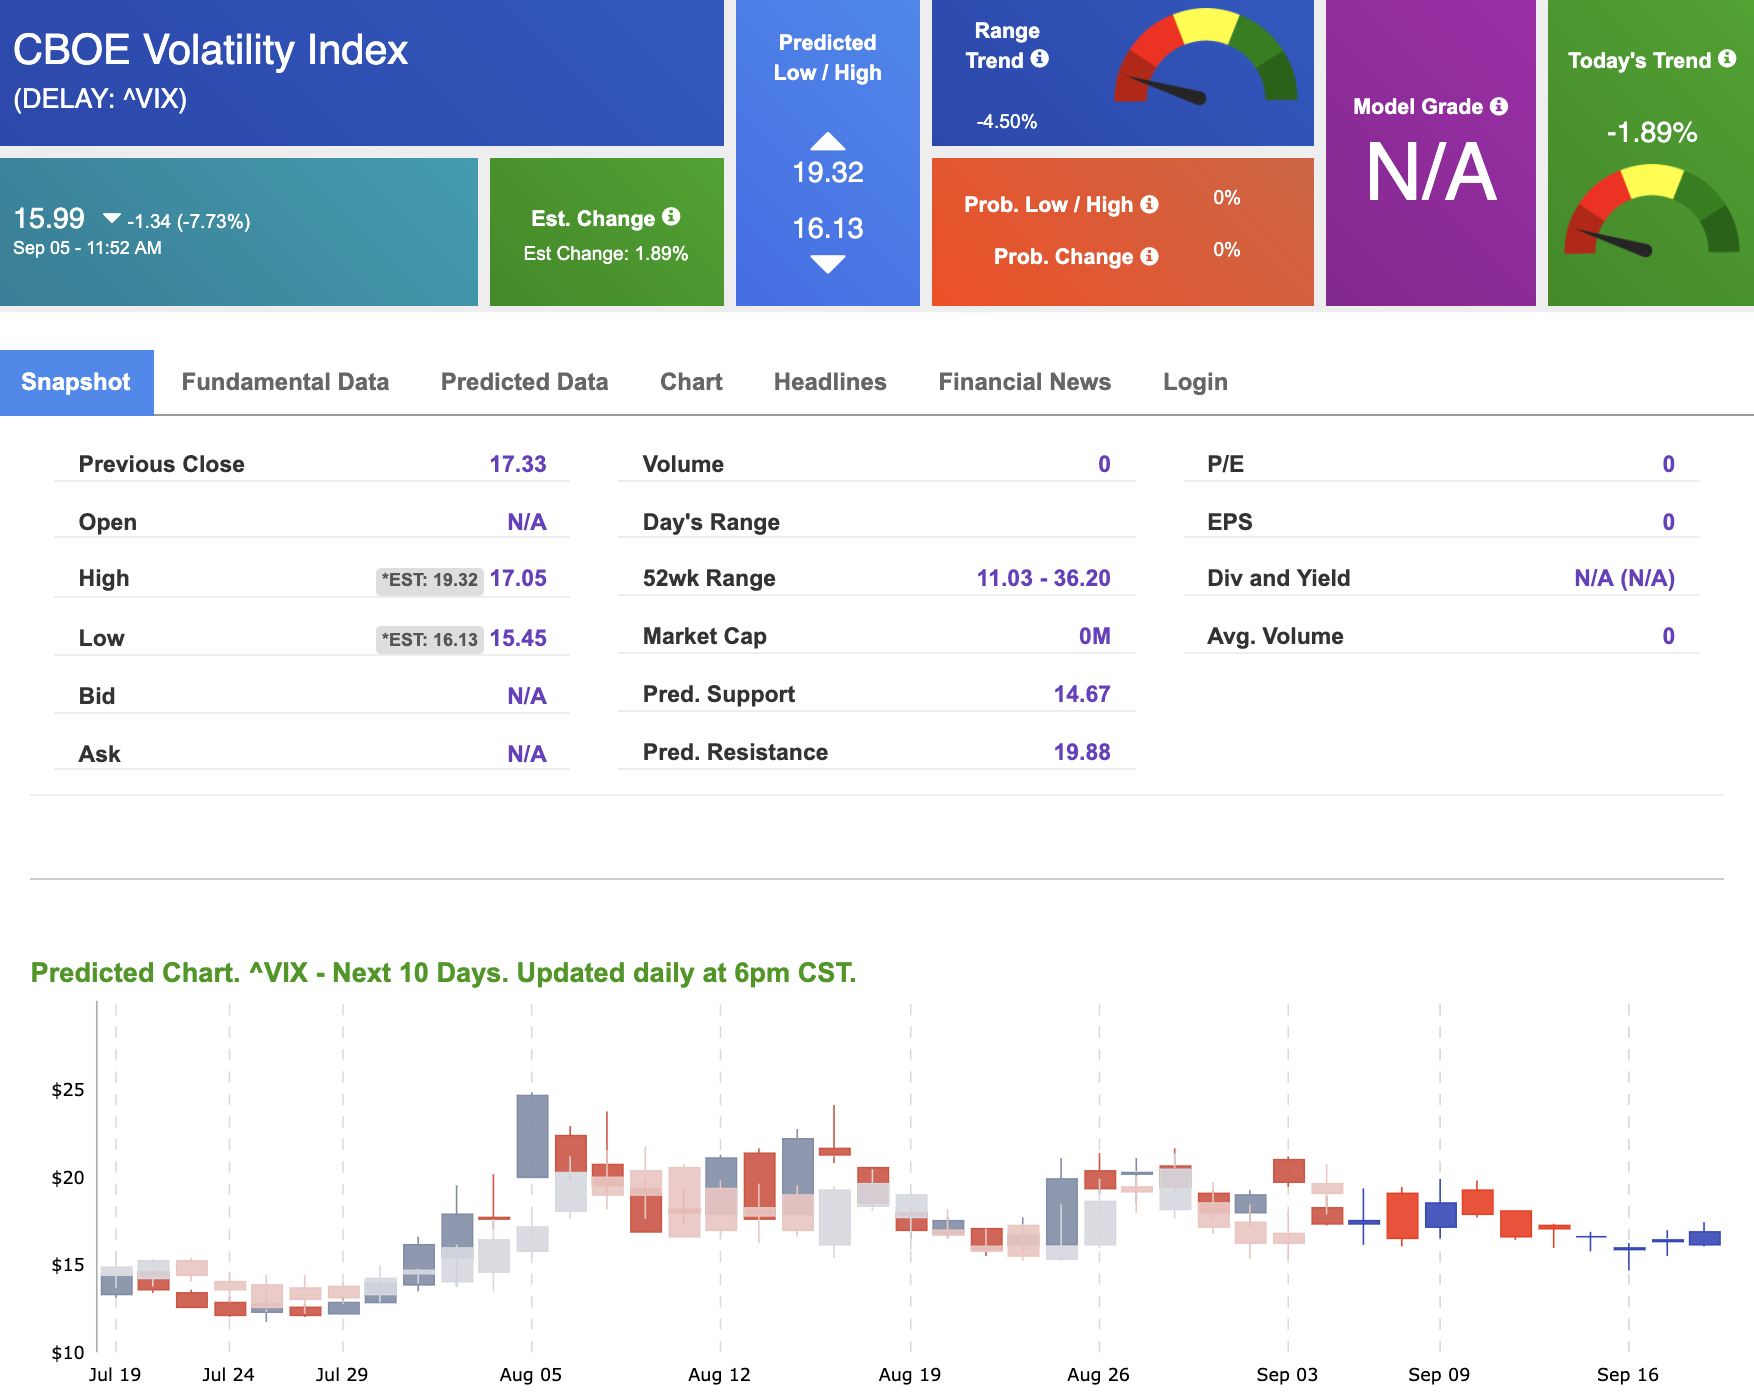
The CBOE Volatility Index (^VIX) is down 7.73% at $15.99 at the time of publication, and our 10-day prediction window shows negative signals. The predicted close for tomorrow is $16.50 with a vector of -1.01%. Prediction data is uploaded after market close at 6 p.m., CST. Today’s data is based on market signals from the previous trading session.
(Want free training resources? Check our our training section for videos and tips!)
Here’s the short version of what our Premium Service can do for you:
Trailing 36-month return. . . 1,342%!
What people are saying about Tradespoon:
Mauricio F. Member since August 2017
I really like your site and am learning from the videos and I made several good profitable trades following your site recommendations and advice.?
I used your site advice to buy 3 Netflix (NFLX) call options and I Paid $8.20 for two $270 call options 16 Feb… A half-hour later they were selling for $10.50! Your site predicted that NFLX would increase in price and I decide to buy one more of the same option and paid $10.30. Friday the Bid = $11.65 and Ask = $11.95…
I calculated that the gain is so far is about 17% against the money that I used to purchase the options.