
Government Shutdown and China Concern Pressure Stocks
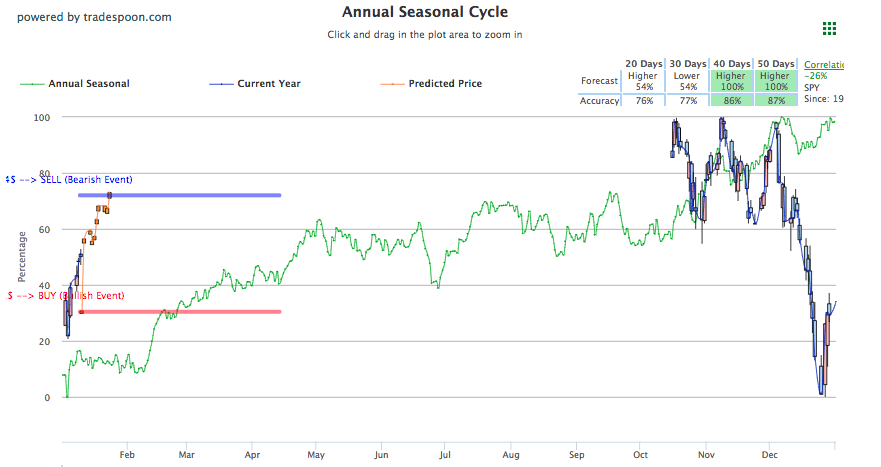
Major U.S. indices rose in early-morning trading before lowering in the afternoon, erasing gains as signs of a turbulent Chinese economy and continued partial U.S. government shutdown continues to weigh down investor sentiment. At its current state, the market broke out of $254 resistance level which is now a support for SPY. Earnings season is approaching and should break the market out of the oversold conditions it faced in December. As long as market trades above $253-$254 level, the next level of resistance is $260-$264 which coincides with 50-days moving average on SPY. If SPY trades below 50-days moving average, due to any negative news regarding China-U.S. or earnings, expect volatility to come back and a market correction to occur. We could see the market return to $280 level in Q1 of 2019 as we believe the market is currently oversold; however, we doubt this will be a “V” shaped recovery and investors should expect some volatility to return this quarter. For reference, the SPY Seasonal Chart is shown below:

Both the S&P and Dow are nearing correction-territory as all three major indices are currently floating near modest gains and losses for the day, initially lowering before remaining near flat in the afternoon. Recent Chinese reports regarding global growth and manufacturing are signaling at a troubled time for the economy and a serious slowdown this past year. Producer and consumer prices both lowered last month, according to official data released by China today. While optimism was high leaving the three-day meeting yesterday, Chinese and U.S. delegations are leaving Beijing without a deal and no future meeting scheduled. Both sides have displayed good faith and effort in working out their trade difference but with little clarity moving forward any negative news can deter investor sentiment and optimism.
The continuation of the partial U.S. government shutdown is also weighing on markets today after a meeting between Democrats and President Trump ended tensely with no resolution. Trump referred to the meeting as a “total waste of time” while Senate Minority Leader Chuck Schumer referred to Trump’s exit of the meeting as a “temper tantrum.” Since the meeting, members of both parties have come forth and urged the two sides to come to an agreement and continue negotiations. Several things to monitor include Trump’s recent statements regarding declaring a national emergency over the matter as well as cutting off wildfire aid to California for last year’s wildfires.
Earnings season is slowly revving up with retail earnings from companies such as Kohl’s, Macy’s, and L Brands all having reported below expectations and are currently lowering in the range of 7-18%. American Airlines also lowered behind earnings as the company enjoyed the three-day winning streak before lowering 10% today. Next week, major banks such as JPMorgan, Charles Schwab, and Wells Fargo are set to report.


Using the “^GSPC” symbol to analyze the S&P 500, our 10-day prediction window shows mixed signals. Today’s vector figure of +0.19% moves to -0.51% in four trading sessions. The predicted close for tomorrow is 2,565.85. Prediction data is uploaded after market close at 6 p.m., CST. Today’s data is based on market signals from the previous trading session.

Vlad Karpel
Tradespoon CEO and Founder
Special Offer:
LIFETIME ACCESS to our Stock Forecast Toolbox Membership for less than the regular price we normally charge for only 6 months of service!
I want to make this offer a complete no-brainer! Would you rather sign up for just one year of service or get Lifetime Access for an even lower price?
In addition, you will get Lifetime Access to our ActiveTrader service which includes daily high-probability stock & option trade ideas with exact entry/exit points for both bullish and bearish traders!
Click Here to Sign Up
Highlight of a Recent Winning Trade
On January 2nd, our ActiveTrader service produced a bearish recommendation for CMS Energy Corp. (CMS). ActiveTrader is included in all paid Tradespoon membership plans and is designed for day trading.
Trade Breakdown
CMS opened in its forecasted Strategy B Entry 1 price range (49.65, ± 0.26) and passed through its Target price (49.15)within the first hour of trading on 01/02/18. The Stop Loss price was set at $50.15.
Friday Morning Featured Stock
Our featured stock for Friday is Activison Blizzard Inc. (ATVI). ATVI is showing a confident vector trend in our Stock Forecast Toolbox’s 10-day forecast. This stock is assigned a Model Grade of (B) indicating it ranks in the top 25th percentile for accuracy for predicted support and resistance, relative to our entire data universe.
*Please note: Our featured stock is part of your free subscription service. It is not included in any paid Tradespoon subscription service. Vlad Karpel only trades his own personal money in paid subscription services. If you are a paid subscriber, please review your Premium Member Picks, ActiveTrader or ActiveInvestor recommendations. If you are interested in receiving Vlad’s personal picks, please click here.


The stock is trading at $51.08 at the time of publication, up 0.49% from the open with a +0.93% vector figure.
Prediction data is uploaded after market close at 6 p.m., CST. Today’s data is based on market signals from the previous trading session.
Note: The Vector column calculates the change of the Forecasted Average Price for next trading session relative to the average of actual prices for the last trading session. The column shows expected average price movement “Up or Down”, in percent. Trend traders should trade along the predicted direction of the Vector. The higher the value of the Vector the higher its momentum.
Oil
West Texas Intermediate for February delivery (CLG9) is priced at $52.68 per barrel, up 0.65% from the open, at the time of publication. Looking at USO, a crude oil tracker, our 10-day prediction model shows positive signals. The fund is trading at $11.12 at the time of publication, up 0.63% from the open. Vector figures show +0.73% today, which turns +4.07% in five trading sessions. Prediction data is uploaded after market close at 6 p.m., CST. Today’s data is based on market signals from the previous trading session.


Gold
The price for February gold (GCG9) is down 0.33% at $1,287.70 at the time of publication. Using SPDR GOLD TRUST (GLD) as a tracker in our Stock Forecast Tool, the 10-day prediction window shows mixed signals. The gold proxy is trading at $121.65, down 0.54% at the time of publication. Vector signals show +0.19% for today. Prediction data is uploaded after market close at 6 p.m., CST. Today’s data is based on market signals from the previous trading session.


Treasuries
The yield on the 10-year Treasury note is up 0.72% at 2.73% at the time of publication. The yield on the 30-year Treasury note is up 1.59% at 3.05% at the time of publication.
Using the iShares 20+ Year Treasury Bond ETF (TLT) as a proxy for bond prices in our Stock Forecast Tool, we see mixed signals in our 10-day prediction window. Today’s vector of -0.44% moves to -0.56% in three sessions. Prediction data is uploaded after market close at 6 p.m., CST. Today’s data is based on market signals from the previous trading session.


Volatility
The CBOE Volatility Index (^VIX) is flat at $19.98 at the time of publication, and our 10-day prediction window shows negative signals. The predicted close for tomorrow is $19.10 with a vector of -1.76%. Prediction data is uploaded after market close at 6 p.m., CST. Today’s data is based on market signals from the previous trading session.


Vlad Karpel
Tradespoon CEO and Founder
Special Offer:
LIFETIME ACCESS to our Stock Forecast Toolbox Membership for less than the regular price we normally charge for only 6 months of service!
I want to make this offer a complete no-brainer! Would you rather sign up for just one year of service or get Lifetime Access for an even lower price?
In addition, you will get Lifetime Access to our ActiveTrader service which includes daily high-probability stock & option trade ideas with exact entry/exit points for both bullish and bearish traders!