Inflation Concerns Keep Trading Ranges Intact
8:00am (EST)
The stock market was mostly lower on Wednesday as a worse-than-expected inflation reading weighed on sentiment. Specifically, the Consumer Price Index (CPI) showed core prices were up 0.4% last month and 3.3% higher from a year ago.
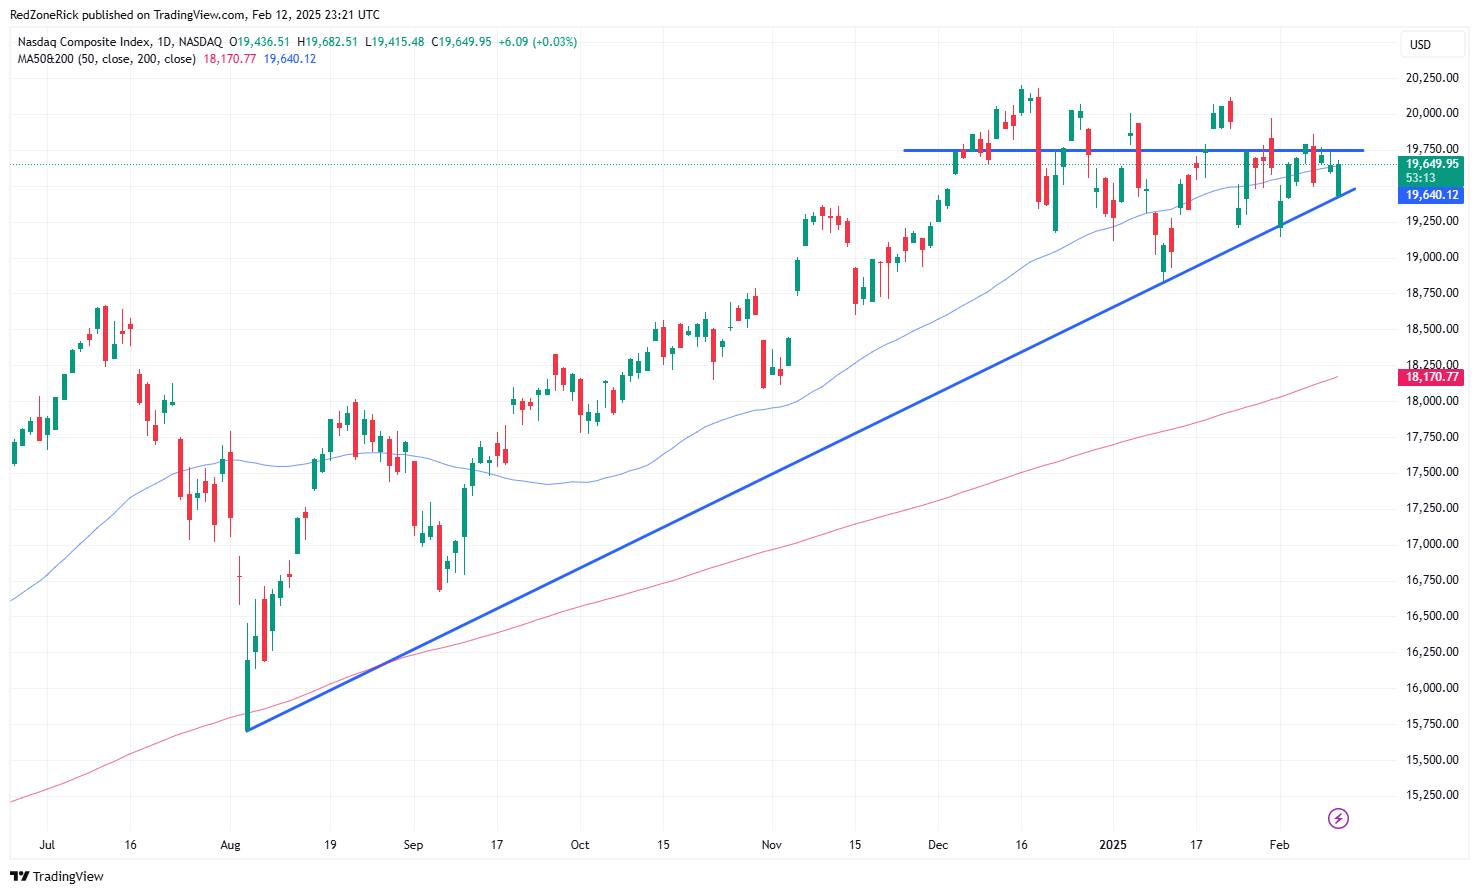
The Nasdaq closed slightly higher at 19,649 (+0.03%) despite tagging an intraday low of 19,415. Support at 19,500 was tripped but held. Resistance remains at 19,750.
The S&P 500 traded down to 6,003 before settling at 6,051 (-0.3%). Support at 6,000 held. Resistance is at 6,100.
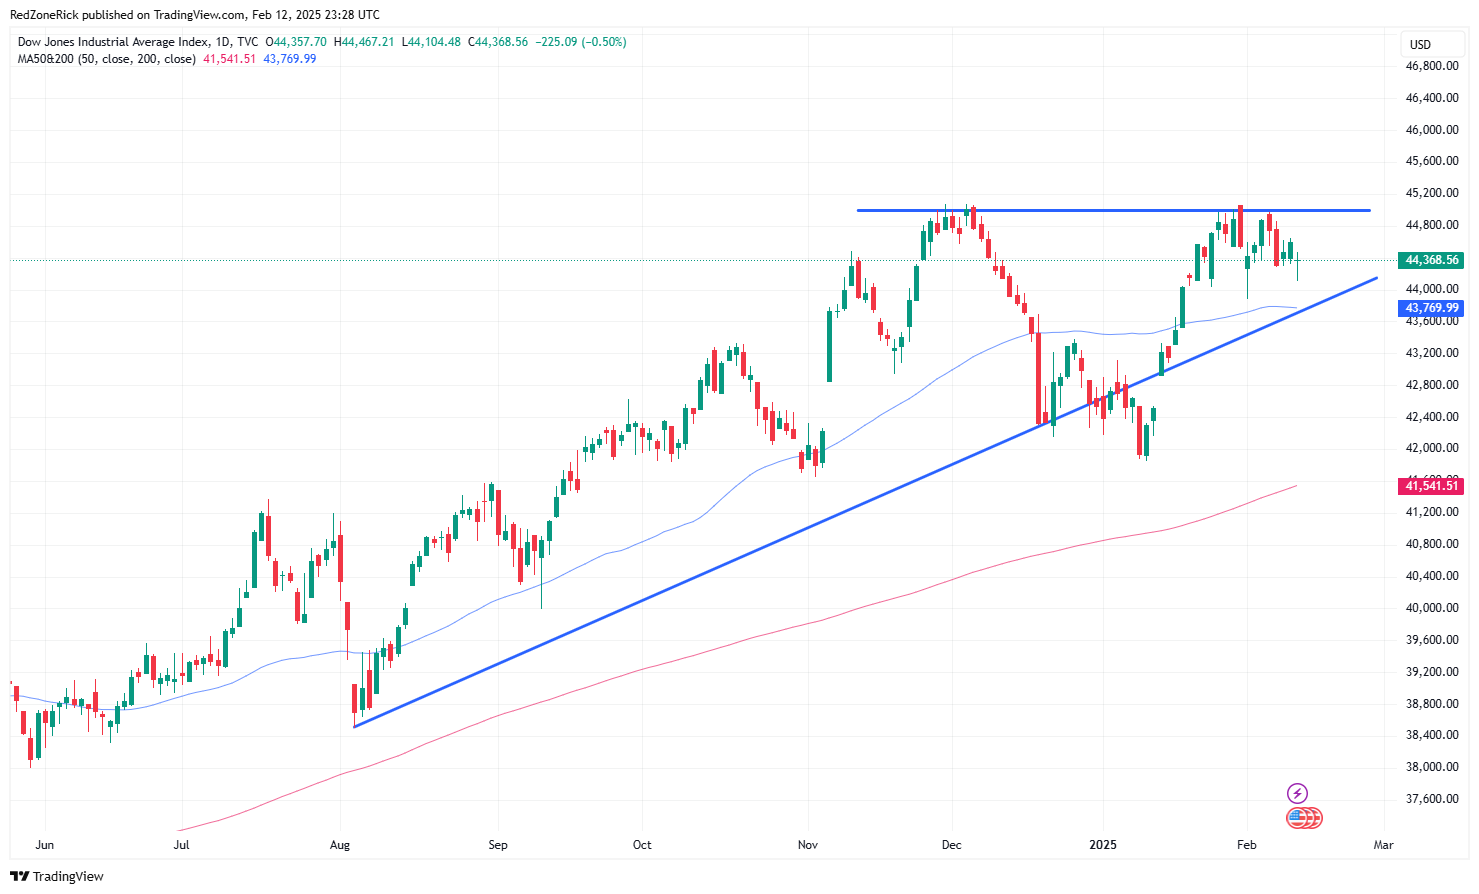
The Dow was last seen at 44,368 (-0.5%) after bottoming at 44,104. Support at 44,000 held. Resistance is at 44,500.
Earnings and Economic News
Before the open: Crocs (CROX), Datadog (DDOG), Deere & Company (DE)
After the close: Airbnb (ABNB), Coinbase (COIN), DraftKings (DKNG), JFrog (FROG), Palo Alto Networks (PANW), Roku (ROKU), Twilio (TWLO), Wynn Resorts (WYNN)
Economic news:
Initial Jobless Claims – 8:30am
Producer Price Index – 8:30am
Technical Outlook and Market Thoughts
The upcoming charts are a little cleaner this week to show that the major indexes remain in an ascending triangle pattern. The S&P and the Nasdaq are more defined with the Dow showing some stretch to the downside. The technical setup typically leads to higher highs but it is important to remember price action can change in a hurry.
The current outlook is still showing a short-term trading range in play since mid-January with key support and resistance levels well defined. The longer a trading range carries on, the bigger breakout, or breakdown, could be.
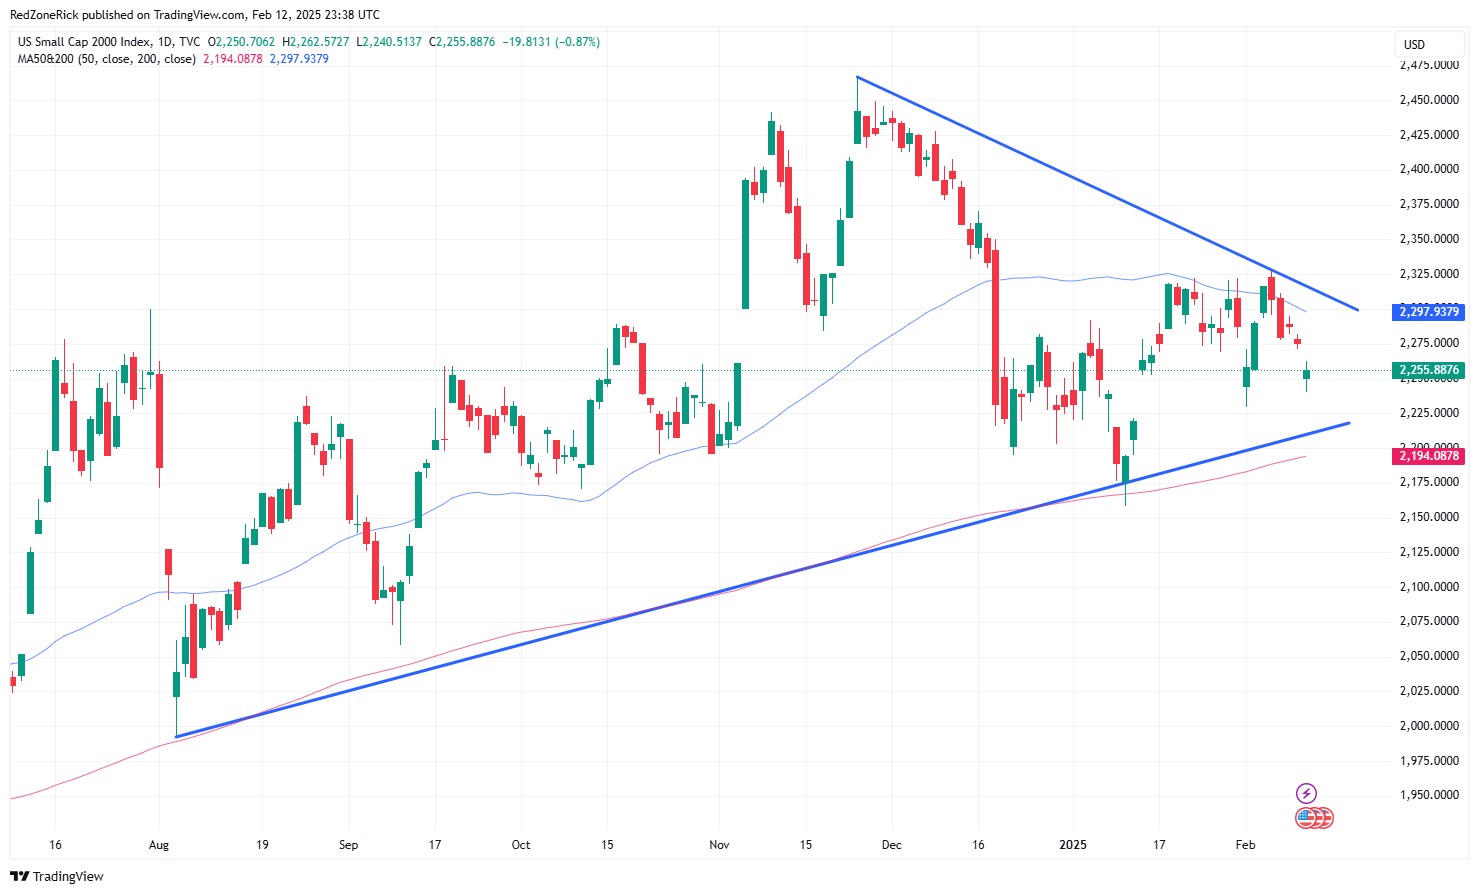
As for the Russell 2000, the technical setup is showing the potential for a major move forthcoming with the index in a symmetrical triangle. The problem with the small-caps is that the 50-day moving average is rolling over and yesterday’s close below key support at 2,260 was a renewed bearish development. This reopens downside risk towards 2,225-2,200 and the 200-day moving average.
Lowered resistance is at 2,325 and the 50-day moving average.

The Nasdaq held its uptrend channel, and more importantly, the 19,500 level into the closing bell. Backup and key support remains at 19,250. A drop below this level and out of the uptrend channel would indicate weakness to 19,000-18,750.
Key resistance remains at 19,750 followed by 20,000-20,250 with the December 16th all-time high at 20,204.

The S&P has traded in a more defined range between 6,000-6,100 over the past seven sessions with these levels being stretched over the past month. Key support remains at 6,000 and the 50-day moving average. Additional support is at 5,950-5,900.
Continued closes above 6,100 and the January 24th all-time high at 6,128 would signal upside towards 6,200-6,250.

The Dow’s close below 44,500 was slightly bearish with the 50-day moving average showing signs of flatlining and possibly rolling over. Continued closes below these levels would imply ongoing weakness to 44,000-43,750 and the 50-day moving average. A close below 43,500 and out of the current uptrend channel would be the possible start of a near-term top.
Lowered resistance is at 44,750-45,000 with the December 4th all-time top at 45,073.

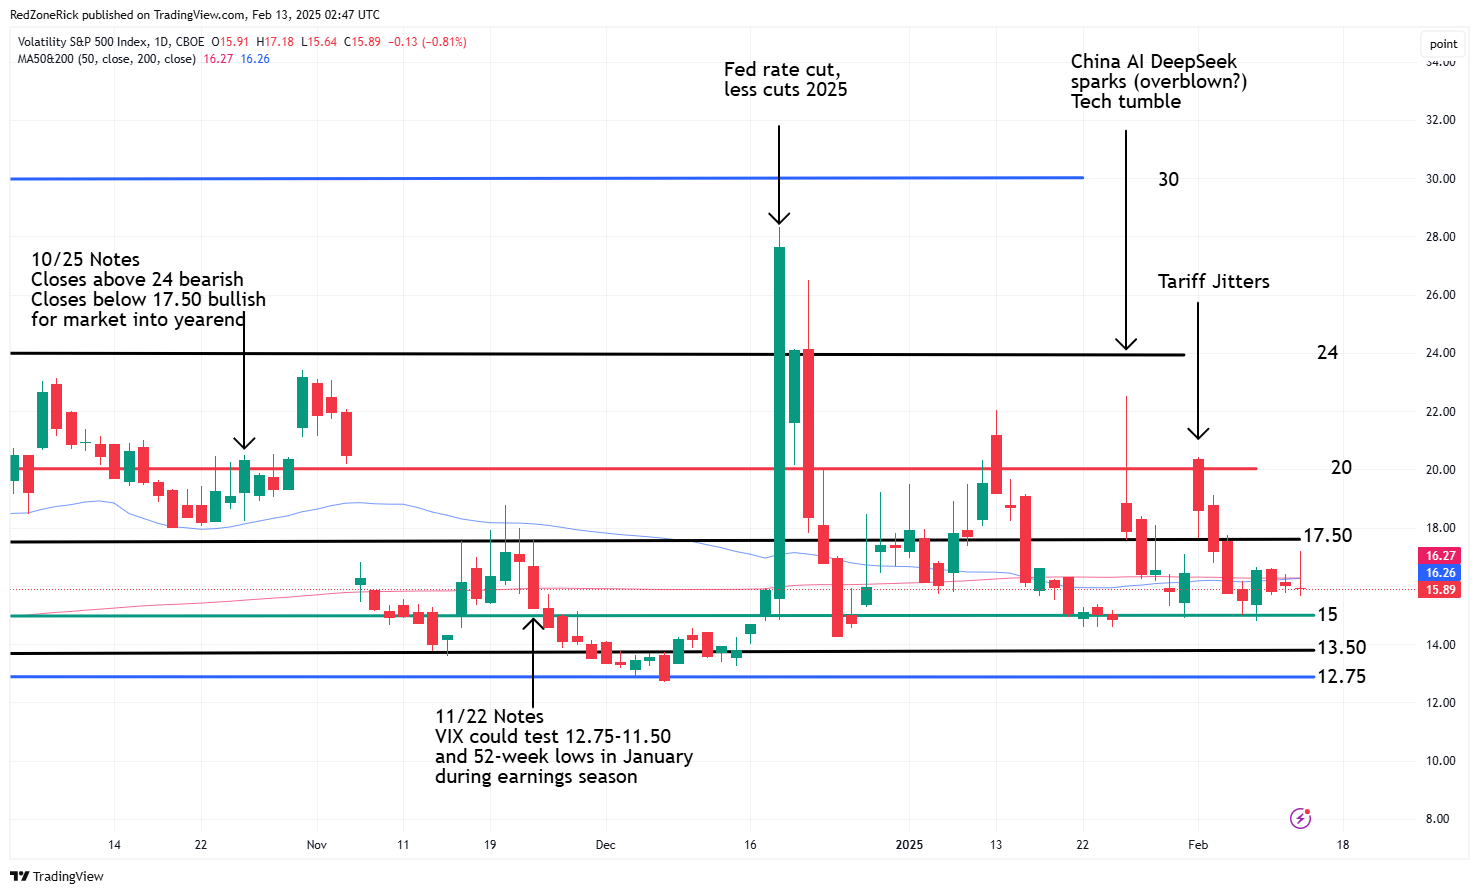
The Volatility Index (VIX) actually closed lower after surging to an opening high of 17.18. Key resistance at 17.50 held along with the 50-day and 200-day moving averages. A close above the former reopens upside risk to 20-22.
Key support remains at 15. Multiple closes below this level would be bullish for the market with weakness towards 13.50-12.75.
