
Key Resistance Levels Hold Despite First Trade Deal Announcement
Key Resistance Levels Hold Despite First Trade Deal Announcement
- For the week, the S&P 500 slipped 0.5%; the Nasdaq dipped 0.3%, the Dow was off 0.2%; and the Russell 2000 was up 0.1%.
- The RSI (relative strength index) levels for the major indexes remain neutral and aren’t indicating overbought, or oversold levels. The Nasdaq is at 58; the Dow is at 55; the S&P is at 57, and the Russell’s RSI is at 58.
- Futures were up over 1% and were showing a positive Monday open after Treasury Secretary Scott Bessent stated there was substantial progress following the U.S-China trade talks over the weekend.
The stock market broke out to fresh weekly highs on Thursday following news of a U.S.-U.K trade deal. Friday’s slight pullback came ahead of the weekend trade talks with China and gave the bears the weekly win.
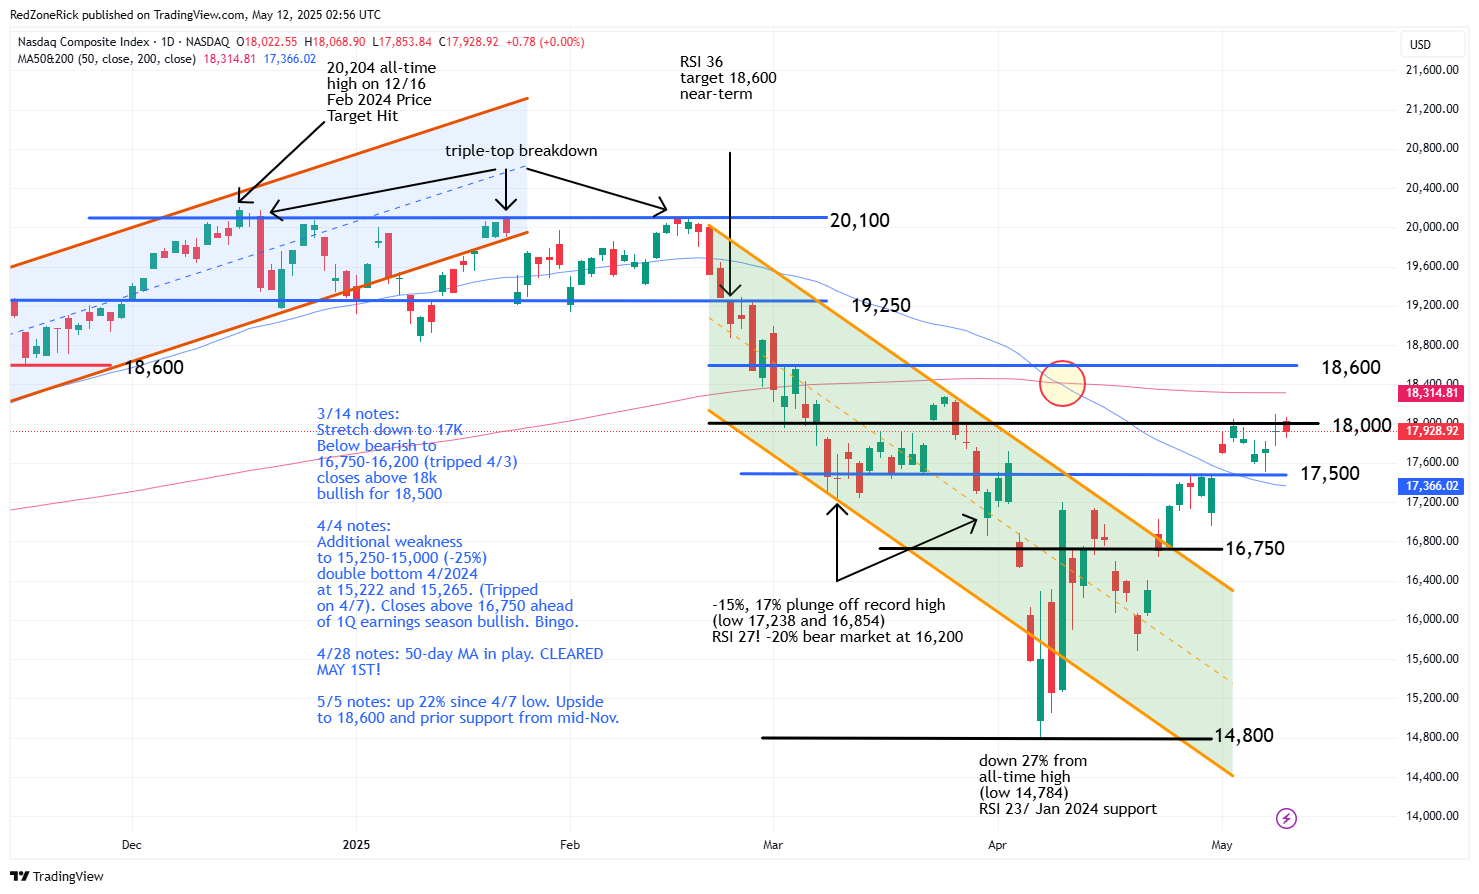
The Nasdaq closed at 17,928 (+0.0%) with the peak reaching 18,068. Key resistance at 18,000 held. Support is at 17,750.
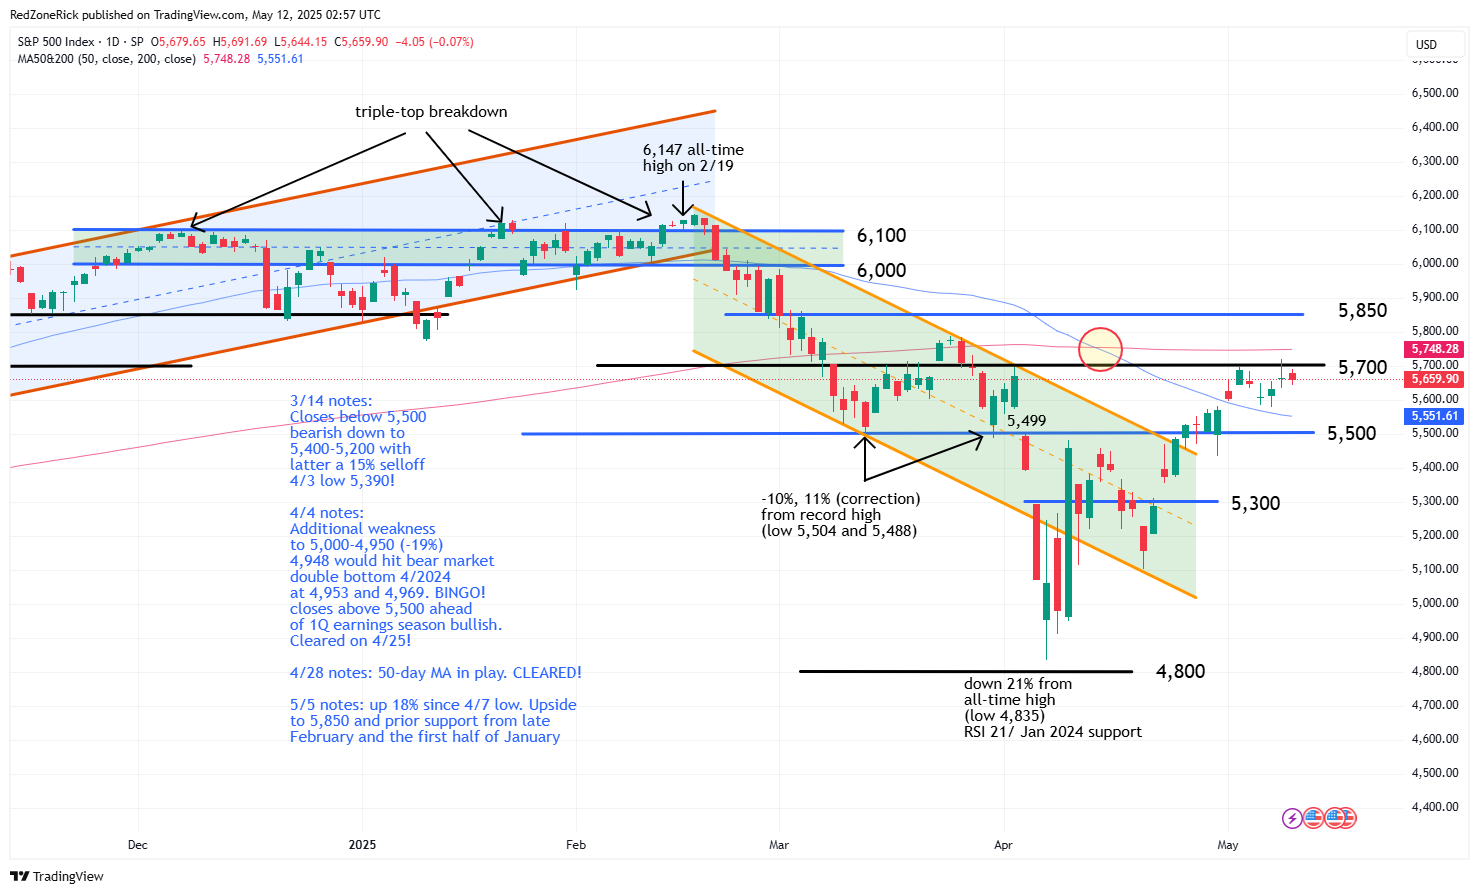
The S&P 500 traded down to 5,644 while settling at 5,659 (-0.1%). Key support at 5,650 was tripped but held. Resistance is at 5,700.
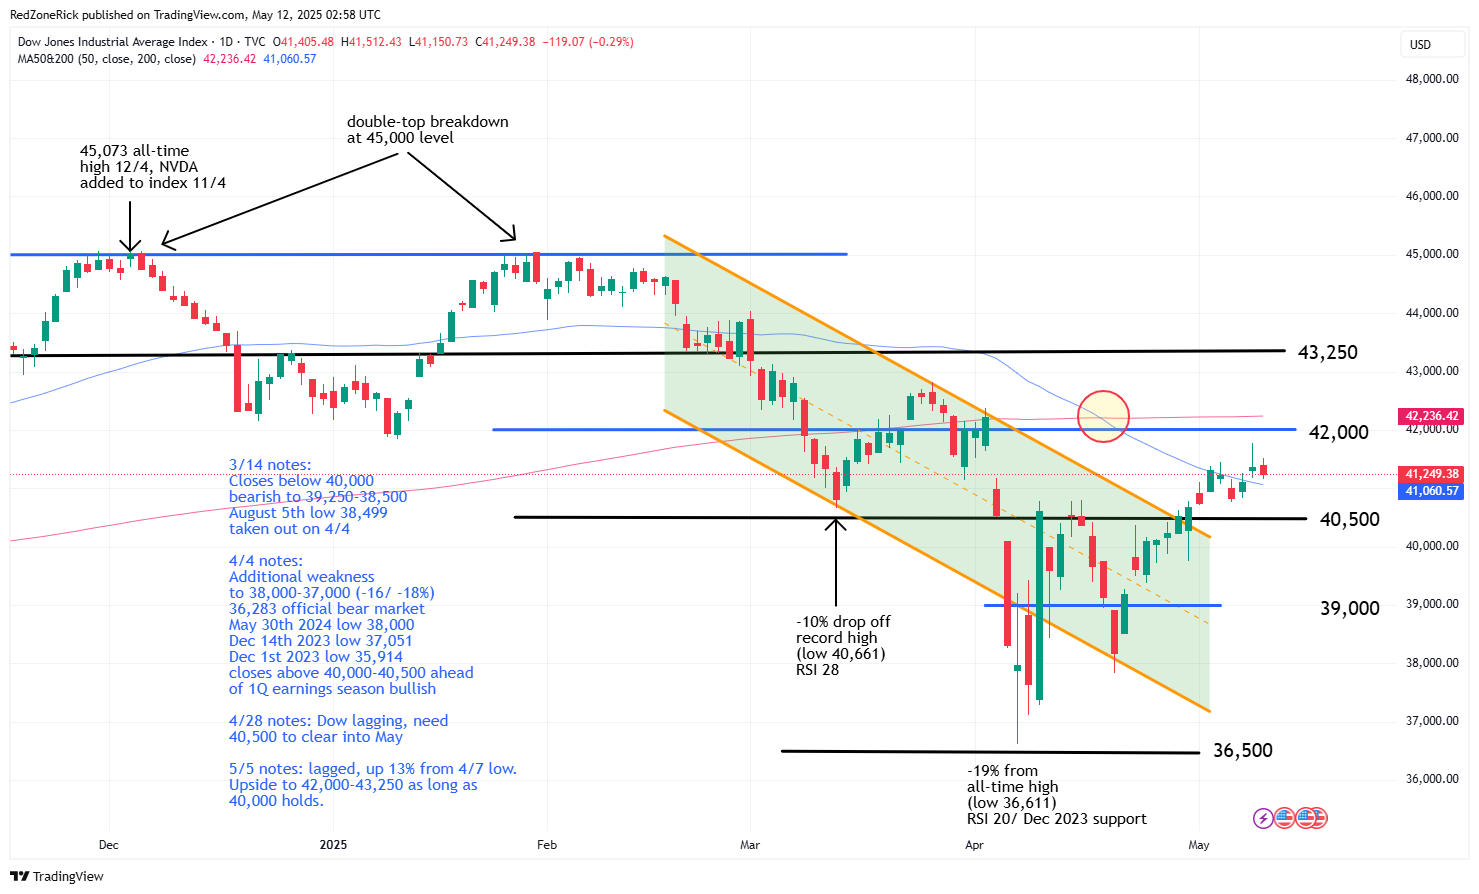
The Dow ended at 41,249 (-0.3%) after hitting a low of 41,150. Support at 41,250 failed to hold. Resistance is at 41,500.
Earnings and Economic News
Before the open: Chegg (CHGG), Dole (DOLE), Fox (FOXA), NRG Energy (NRG), SeaDrill (SDRL)
After the close: AST SpaceMobile (ASTS), BioStem Technologies (BSEM), Brink’s Company (BCO), Hertz Global (HTZ), Plug Power (PLUG)
Economic News
Treasury Budget – 2:00pm
Technical Outlook and Market Thoughts
For the week, the S&P 500 slipped 0.5%; the Nasdaq dipped 0.3%, the Dow was off 0.2%; and the Russell 2000 was up 0.1%. The major indexes remain at, or near, key resistance levels and above their 50-day moving averages. Just above key resistance remains the 200-day moving averages.
The Nasdaq cleared 18,000 on Thursday and Friday, along with the prior Friday, but a level that held on the session closes. Continued closes above 18,000 gets our near-term target of 18,300-18,600 and the 200-day moving average in play. The latter represents prior support from mid-November.
Support remains at 17,750-17,500. A move below the latter and the 50-day moving average would indicate weakness to 16,750.
The S&P 500 cleared 5,700 on Thursday’s trip to 5,720. Continued closes above 5,700-5,750 and the 200-day moving average would indicate ongoing strength towards 5,850 and prior support from late February and the first half of January.
Support is at 5,600-5,550 and the 50-day moving average. A drop under 5,500 would be a renewed bearish signal.
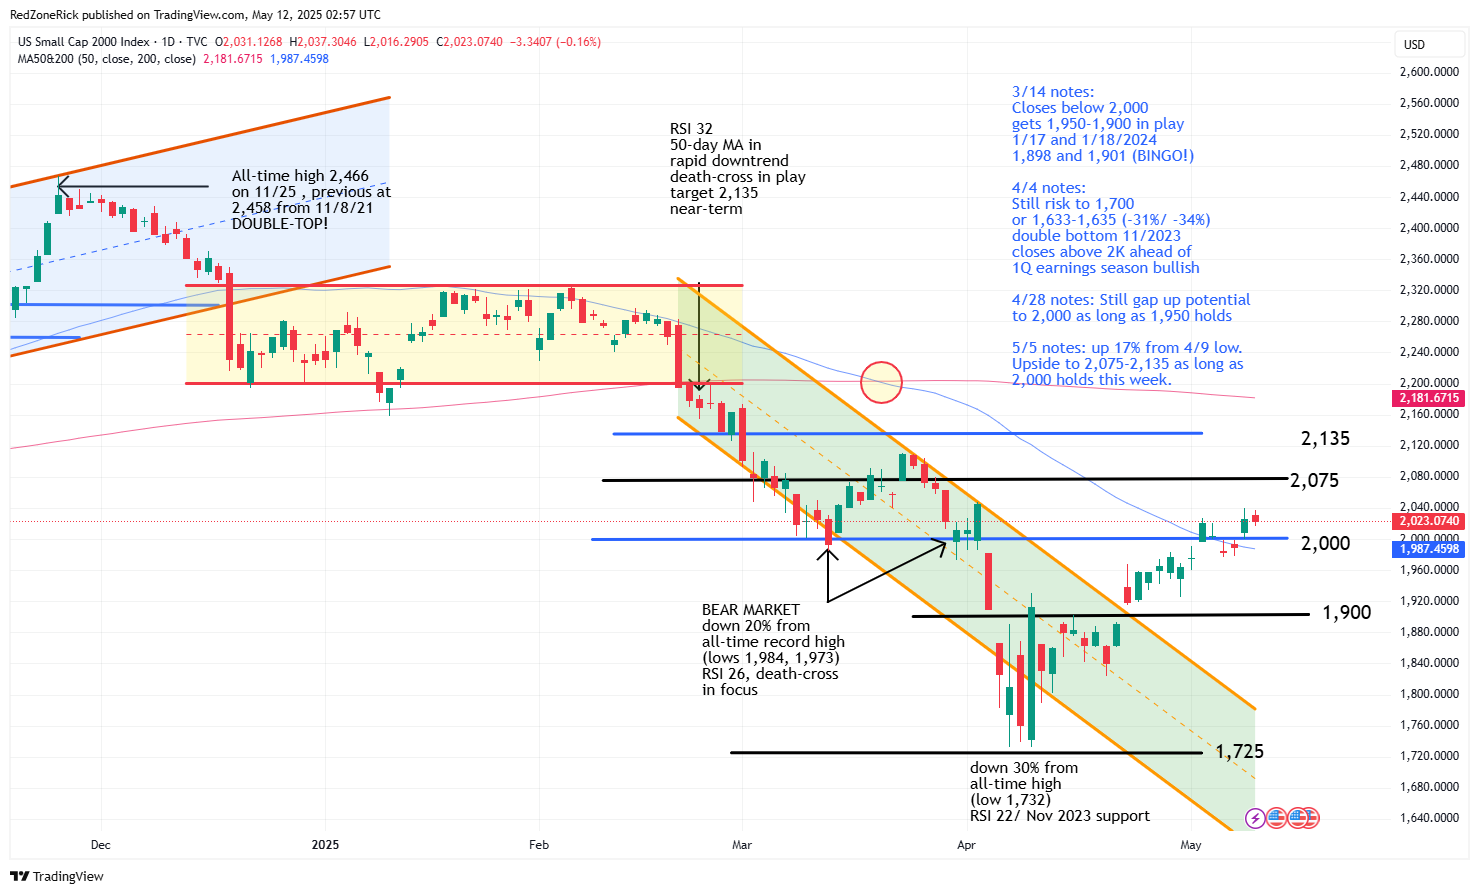
The Russell 2000 closed back below 2,000 on Tuesday and Wednesday but recovered this level on Thursday while holding on Friday. The Thursday peak reached 2,040 with a pop above 2,050 getting upside to 2,075-2,135 in the mix. The small-caps have closed above the 50-day moving average in four of the past six sessions and is an ongoing bullish development.
Support is at 1,975-1,950. A move below 1,900 would be a warning signal for lower lows towards 1,875-1,850.
The Dow has settled above its 50-day moving average in three of the past four sessions with key resistance at 42,000 followed by 42,250 and the 200-day moving average. Closes above the latter two levels should lead to upside towards 43,250 which represents key support from late February.
Current support is at 40,500-40,000. A close below the latter would reopen downside risk to 39,000-38,000.
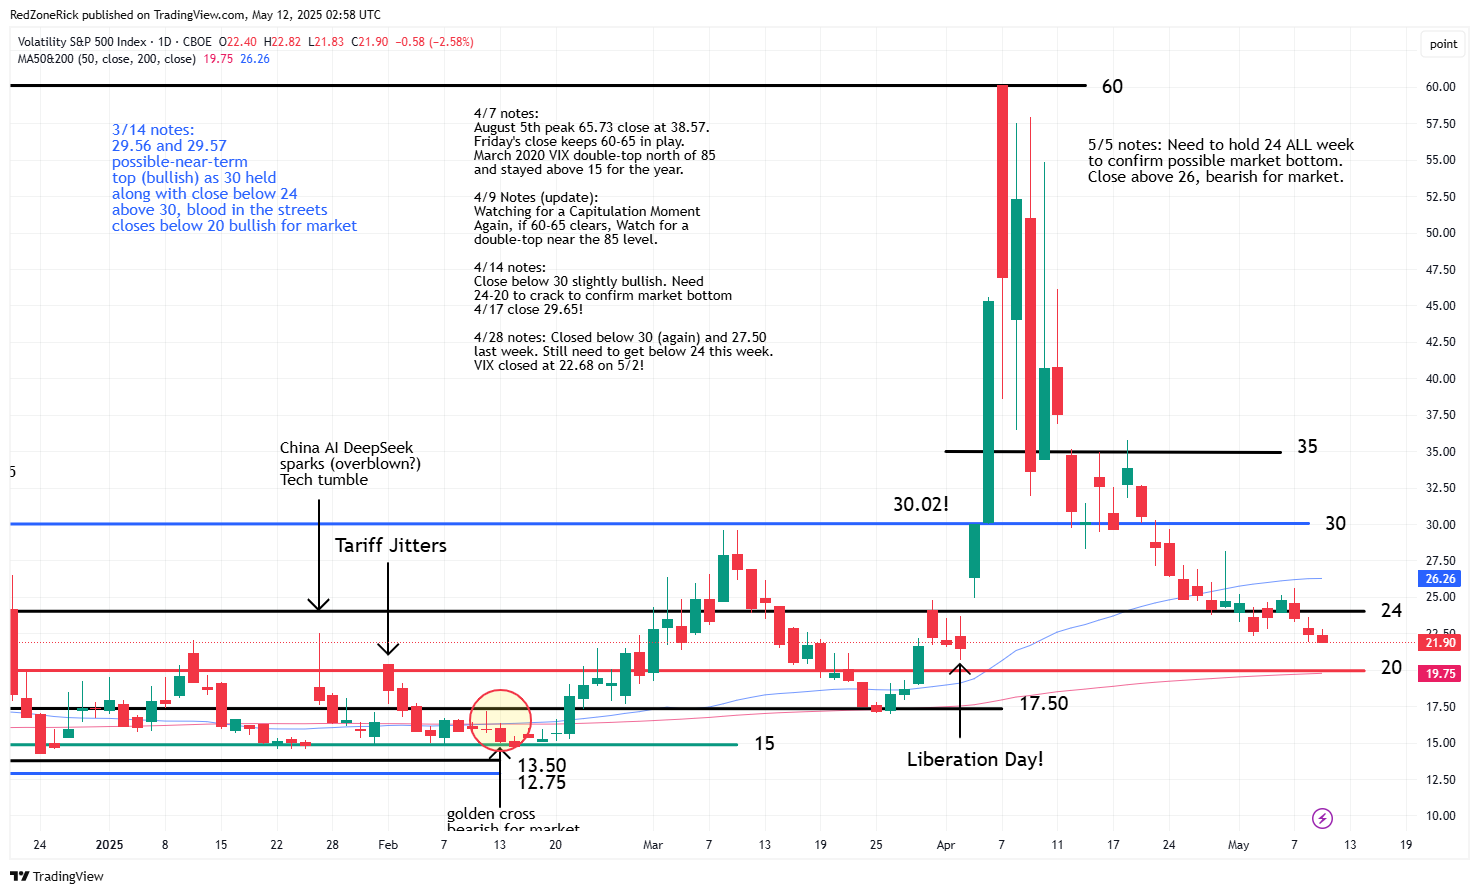
The Volatility Index (VIX) has closed below 24 in five of the past six sessions. We talked about multiple closes below 24 would start to confirm a possible near-term market bottom and a level that needs to hold all of this week. Ideally, we would like to see continued weakness down to 20 with the 200-day moving average at 19.75.
Key resistance is at 26 and the 50-day moving average. A close back above these levels would be slightly bearish for the market with upside risk to 30-35.
We talked about Monday’s (and Friday’s) needing to be positive to show that cash in still coming into the market. Following a lower Monday and Friday this past week, it still shows investors are leery of holding positions over a weekend despite the massive rebound off the April 7th market lows. This isn’t a big deal but something we continue to monitor.
The RSI (relative strength index) levels for the major indexes remain neutral and aren’t indicating overbought, or oversold levels. The Nasdaq is at 58; the Dow is at 55; the S&P is at 57, and the Russell’s RSI is at 58. Readings at 70 and above are considered overbought. RSI readings at 30 and below indicate oversold conditions.
Futures were up over 1% and were showing a positive Monday open after Treasury Secretary Scott Bessent stated there was substantial progress following the U.S-China trade talks over the weekend. If key resistance levels are cleared and held to start the week, we could be busy with fresh trade ideas.