Major Tech Selloff Has Market Down, More Earnings, and FOMC Meeting on Horizon
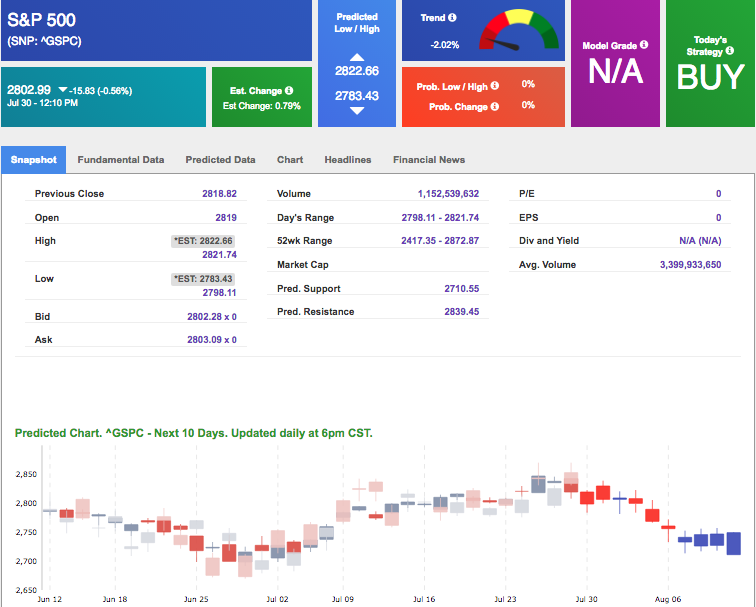
U.S. assets are trading lower today, pushing a third straight day of losses for the S&P, amidst a widespread tech selloff. Key support level for SPX looks to be $2800. This week will feature a heavy load of economic data, along with another major week in earnings, and the Federal Open Market Committee will hold their two-day meeting beginning tomorrow. This week in earnings will see Apple, Tesla, Loews, Marathon Oil, Duke Energy, T-Mobile, and many more.
After Alphabet and Amazon reported positively last week, most tech companies, most notably Facebook and Netflix, plummeted, suffering major selloffs affecting a majority of U.S markets. Facebook saw a steep decline in Q2 earnings and growth that was another dark spot on the troublesome year Facebook has had. Both Netflix and Facebook shares dropped significantly, while Twitter followed suit on Friday with another batch of underwhelming results that shot the stock down 21%. On the other hand, Amazon posted far better results but also fall casualty to the wide-market tech selloff, dropping 1.76% while Google, similarly, posted positive results but is slightly down for the day. Tomorrow, Apple will report which will be key in directing market movement this week as they maintain the capacity to turn the market if earnings counter other underperforming tech companies.
Another key factor in directing the market this week will be the two-day FOMC meeting. Previously reported, the Federal Reserve indicated there will be two more interest rate hikes, however, investors and strategist alike believe there will not be a hike issued at the conclusion of this two-day meeting. Still, investors should monitor the rhetoric coming out of the meeting as Powell and Co. will likely address the other 2018 interest rate hike, providing indication on when traders can expect them.
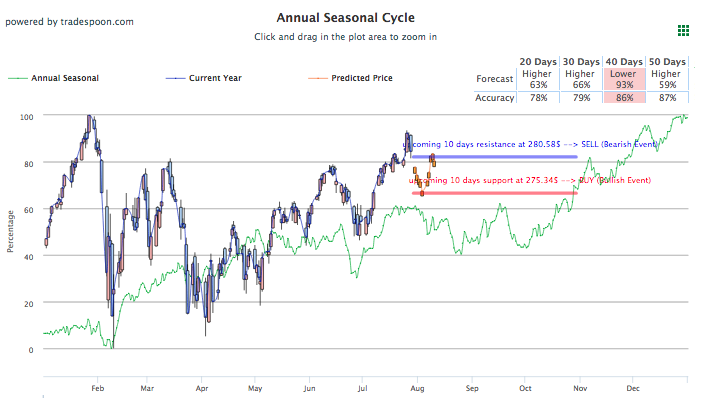
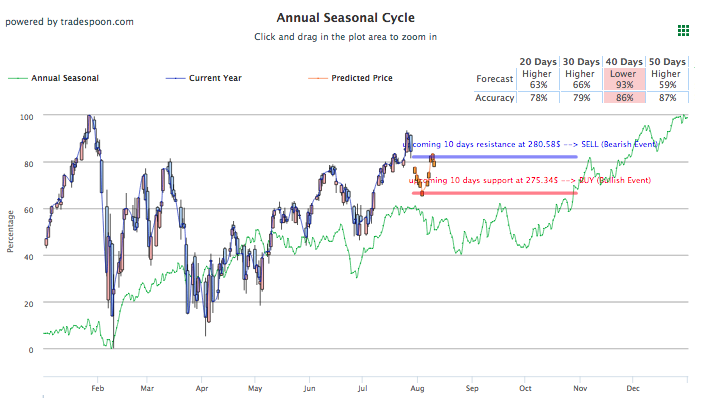
As trade war concerns cool off the market should continue to be guided by earnings reports and economic data. Monitor my Seasonal Charts for key support and resistance level to pinpoint those perfect entry and exit positions, while incorporating Stock Forecast Toolbox open-close ranges along with vector figures to determine trends for the next one, ten, or hundred eighty days.
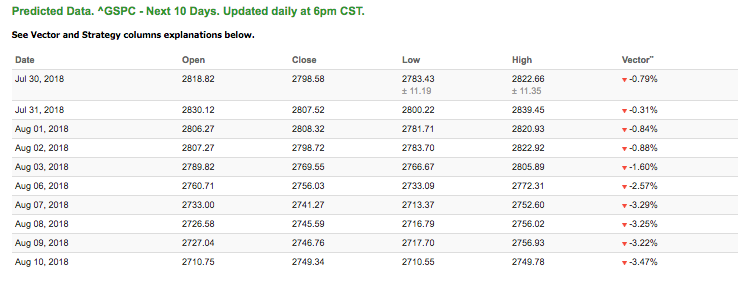
Using the ^GSPC symbol to analyze the S&P 500, our 10-day prediction window shows all negative signals. Today’s vector figure of -0.79% moves to -0.84% in two trading sessions. The predicted close for tomorrow is 2,807.52. Prediction data is uploaded after market close at 6 p.m., CST. Today’s data is based on market signals from the previous trading session.
Highlight of a Recent Winning Trade
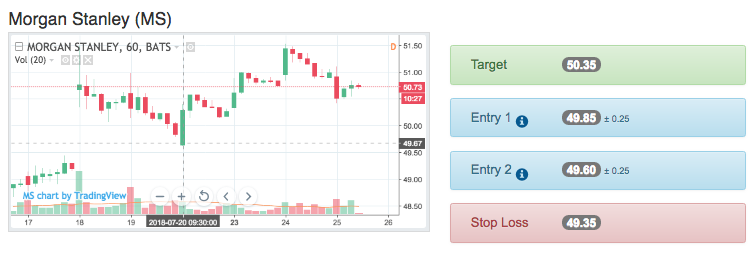
On July 20th, our ActiveTrader service produced a bullish recommendation for Morgan Stanley (MS). ActiveTrader, included in all Tradespoon membership plans, is designed for short-term trading.
Trade Breakdown
MS opened near Entry 1 price range of $49.85 (± 0.25) and moved through its Target Price of $50.35 in its second hour of trading, reaching a high of $50.60 that day. The Stop Loss was set at $49.35.
Tuesday Morning Featured Stock
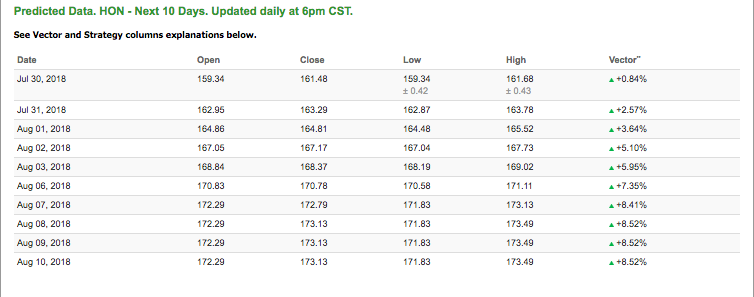
Our featured stock for Tuesday is Honeywell Intl Co (HON). HON is showing a confident uptrend in our Stock Forecast Toolbox’s 10-day forecast. This stock is assigned a Model Grade of (C) indicating it ranks in the top 50th percentile for accuracy for predicted support and resistance, relative to our entire data universe. Our 10-day prediction model shows positive vector figure reaching +2.57% tomorrow. Our benchmark for vector figures is +1.00%.
*Please note: Our featured stock is part of your free subscription service. It is not included in any paid Tradespoon subscription service. Vlad Karpel only trades his own personal money in paid subscription services. If you are a paid subscriber, please review your Premium Member Picks, ActiveTrader or ActiveInvestor recommendations. If you are interested in receiving Vlad’s personal picks, please click here.
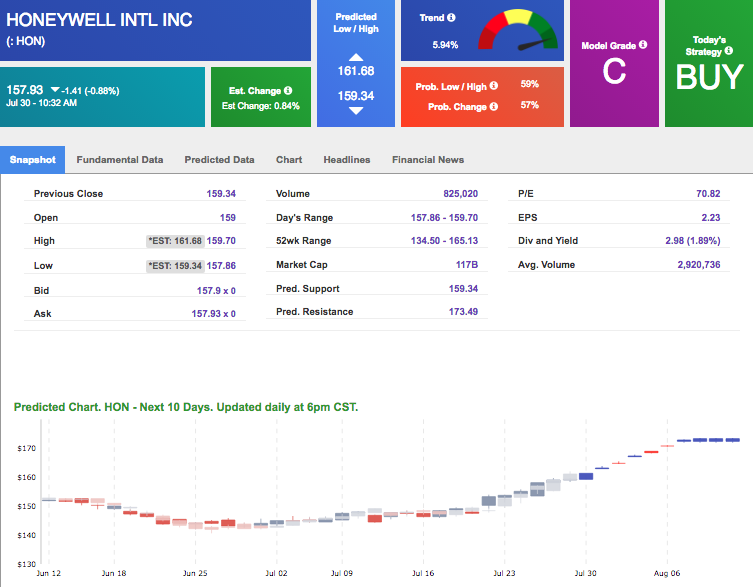
The stock is trading at $157.93 at the time of publication, down 0.88% from the open with a +0.84% vector figure.
Tuesday’s prediction shows an open price of $162.95, a low of $162.87 and a high of $163.78.
The predicted close for Tuesday is $163.29. Vector figures stay positive tomorrow and drive upward throughout the 10-day forecast. This is a good signal for trading opportunities because we use vectors as a primary factor in determining price movements for stocks and ETF.
Prediction data is uploaded after market close at 6 p.m., CST. Today’s data is based on market signals from the previous trading session.
Note: The Vector column calculates the change of the Forecasted Average Price for the next trading session relative to the average of actual prices for last trading session. The column shows expected average price movement “Up or Down”, in percent. Trend traders should trade along the predicted direction of the Vector. The higher the value of the Vector the higher its momentum.
Click here to read more…
Oil
West Texas Intermediate for September delivery (CLU8) is priced at $70.11 per barrel, up 1.95% from the open, at the time of publication. For the first time in three weeks. U.S. oil is priced above $70 a barrel. After dropping for most of last week, today’s recent bump seems to reports of rising U.S. crude stock, OPEC production outages, and an overall constantly changing oil landscape.
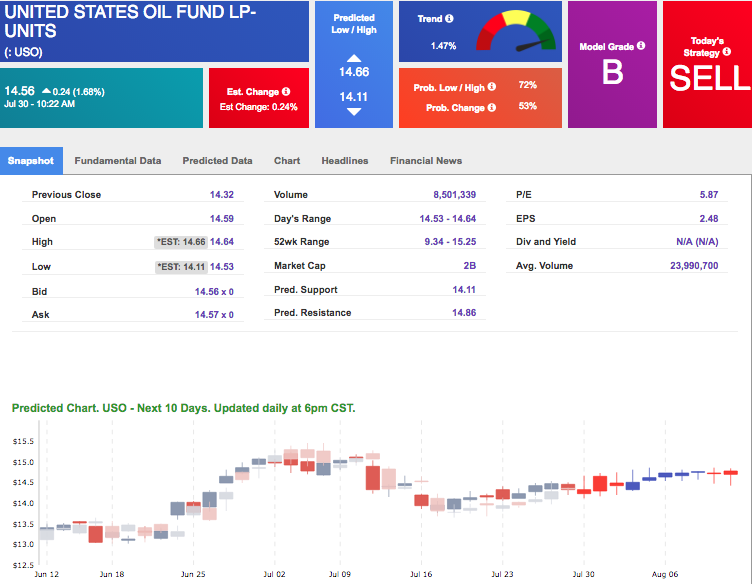
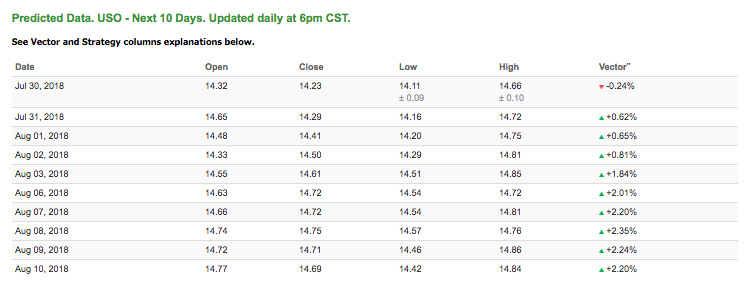
Looking at USO, a crude oil tracker, our 10-day prediction model mostly all positive signals. The fund is trading at $14.56 at the time of publication, up 1.68% from the open. Vector figures show -0.23% today, which turns +0.65% in two trading sessions. Prediction data is uploaded after market close at 6 p.m., CST. Today’s data is based on market signals from the previous trading session.
Gold
Gold continued last week’s trend of trading lower this morning before rebounding as the dollar began to drop in the early afternoon. Another surprising development is the recent surge in December gold contracts, which became the most active contract today. The price for August gold (GCQ8) is up 0.01% at $1,223.20 at the time of publication. .The price for December gold (GCZ8) is up 0.06% at $1,233.80 at the time of publication.
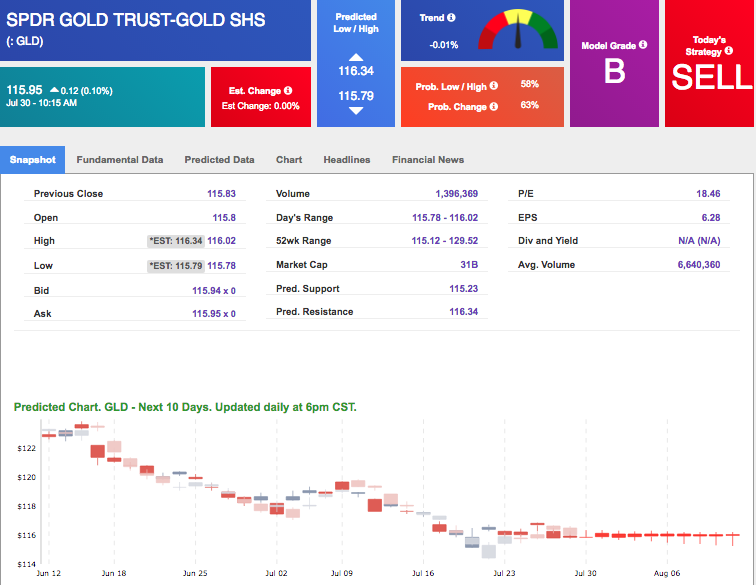
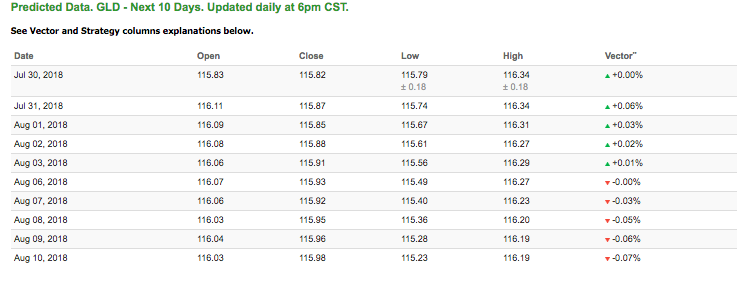
Using SPDR GOLD TRUST (GLD) as a tracker in our Stock Forecast Tool, the 10-day prediction window shows mixed signals. The gold proxy is trading at $115.95, up 0.10% at the time of publication. Vector signals show 0.00% for today. Prediction data is uploaded after market close at 6 p.m., CST. Today’s data is based on market signals from the previous trading session.
Treasuries
Government bonds were on the move up today as investors look forward to a week heavy with financial data and reports. Beyond the ongoing earnings, the Federal Reserve meeting will take place this week along with a slew of other economic data released throughout the week. This bump in activity and information has pushed yields on 10-year notes closer to the 3.00% threshold in early morning trading before leveling off. The yield on the 10-year Treasury note is down 0.06% at 2.98% at the time of publication. The yield on the 30-year Treasury note is down 0.08% at 3.10% at the time of publication.
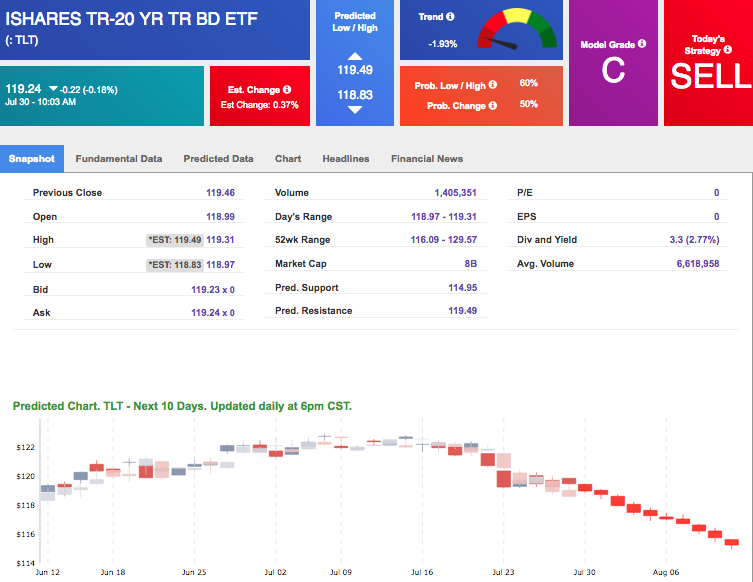
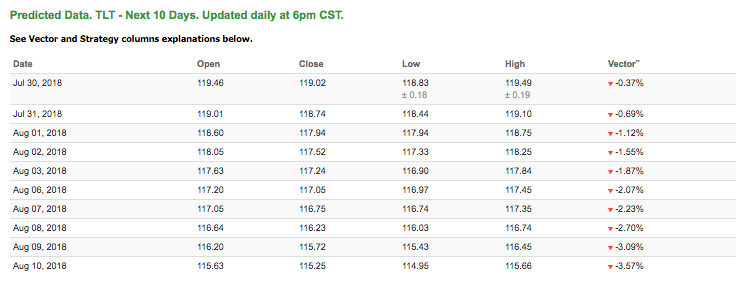
Using the iShares 20+ Year Treasury Bond ETF (TLT) as a proxy for bond prices in our Stock Forecast Tool, we see all negative signals in our 10-day prediction window. Today’s vector of -0.37% moves to -1.55% in three sessions. Prediction data is uploaded after market close at 6 p.m., CST. Today’s data is based on market signals from the previous trading session.
Volatility
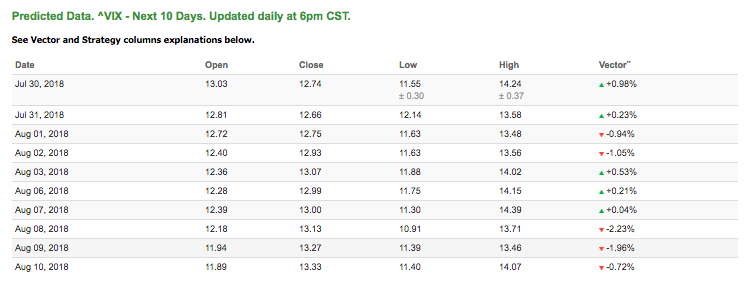
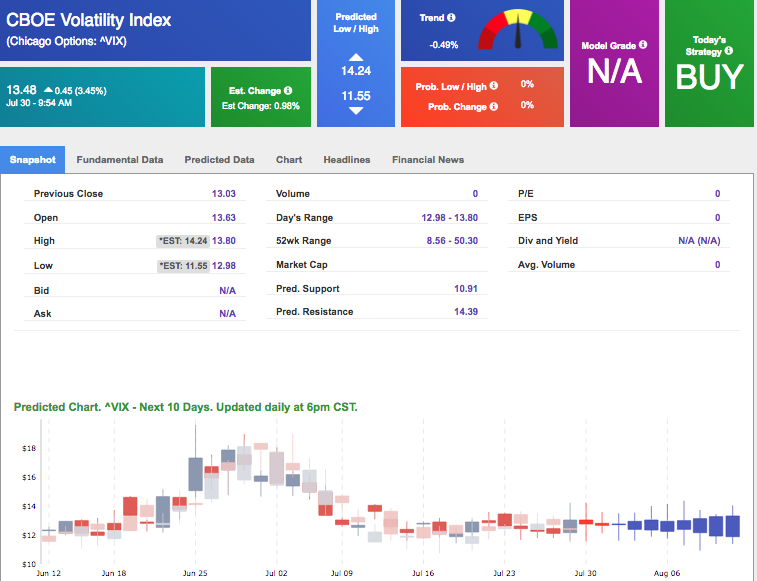
The CBOE Volatility Index (^VIX) is up 3.45% at $13.48 at the time of publication, and our 10-day prediction window shows mixed signals. The predicted close for tomorrow is $12.66 with a vector of +0.23%. Prediction data is uploaded after market close at 6 p.m., CST. Today’s data is based on market signals from the previous trading session.
