
Market Slides as Treasuries Rise
- We talked about possible trading ranges forming into the back half of the month for the major indexes following the May 12th market breakout. Given the stealth v-shape recovering, this is a healthy process as long as fresh support levels hold.
- The charts are again simplified to show the uptrend channels and key support and resistance levels. The starting point remains off the early April lows with a breakdown out of these uptrend channels being the first warning signals of possible upcoming market weakness.
- The two negatives from yesterday’s session were the small-caps close out of the uptrend channel and the action in the VIX (volatility). If the other major indexes fail to hold key support levels, or fall out of their uptrend channels, and the VIX clears 24, investors should prepare for another bear attack.
The stock market pulled back on Wednesday as Wall Street prepared for President Trump’s tax bill with treasury yields rising over fears it could add trillions to the national debt. The 10-year Treasury yield jumped to 4.59% while the 30-year Treasury yield cleared 5%, its highest level in two years.
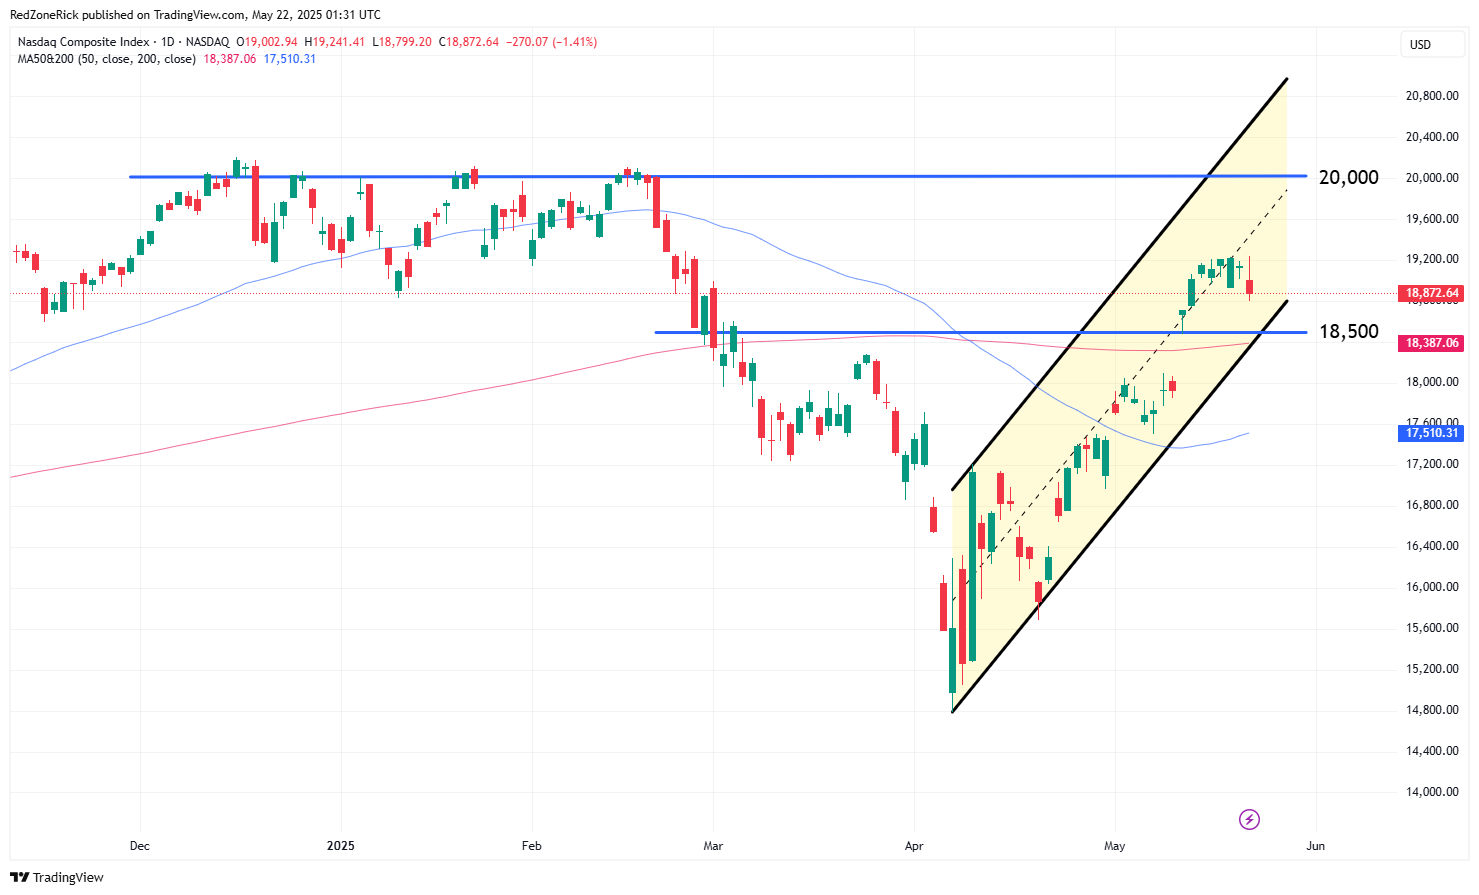
The Nasdaq ended at 18,872 (-1.4%) after testing a low of 18,799. Key support at 18,750 held. Resistance remains at 19,250.
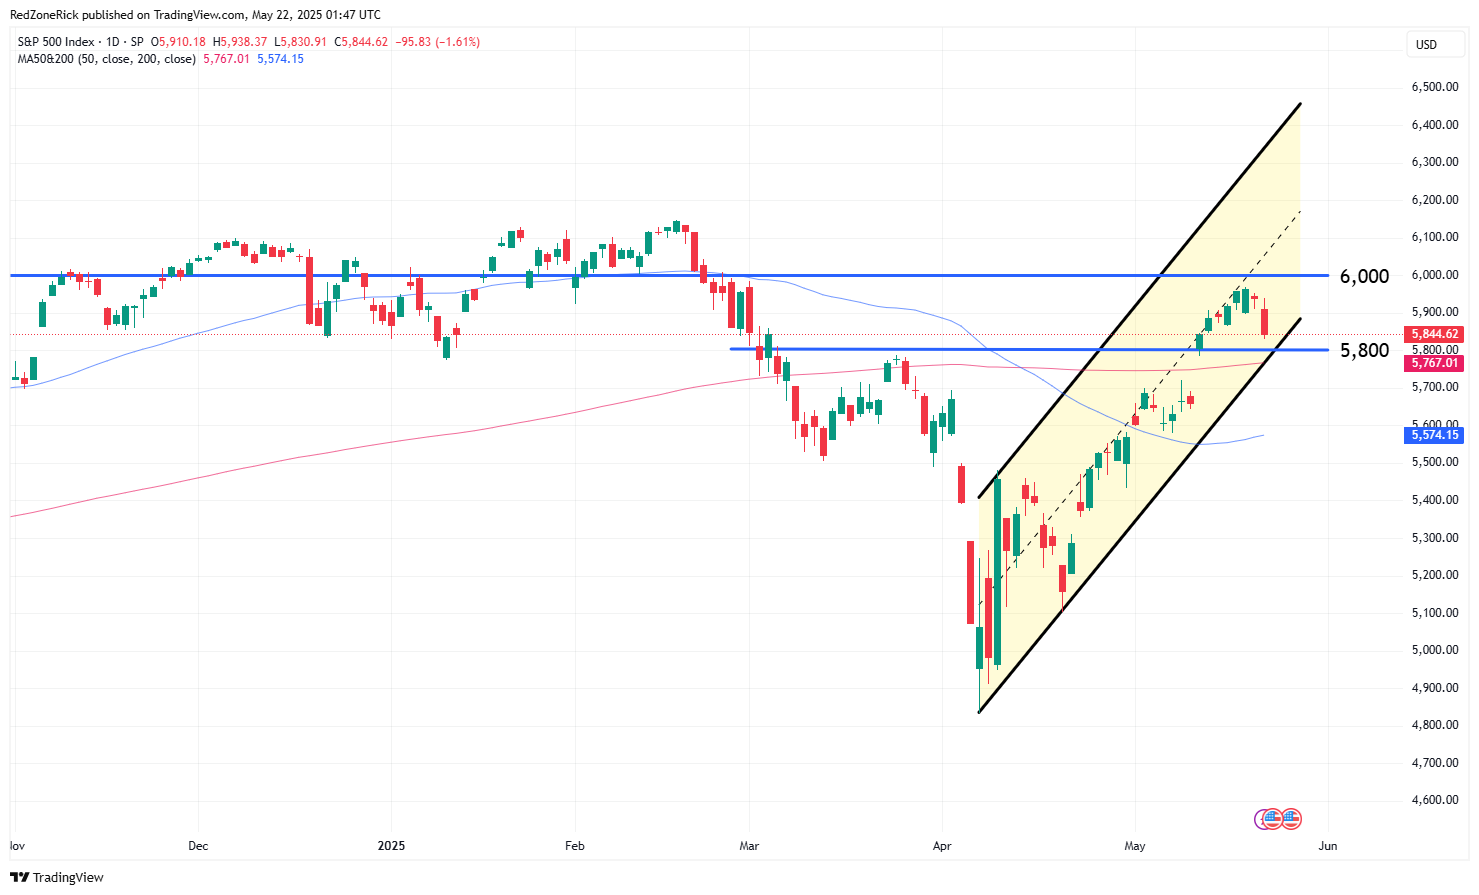
The S&P 500 traded down to 5,830 before closing at 5,844 (-1.6%). Support at 5,850 failed to hold. Resistance is at 5,900.
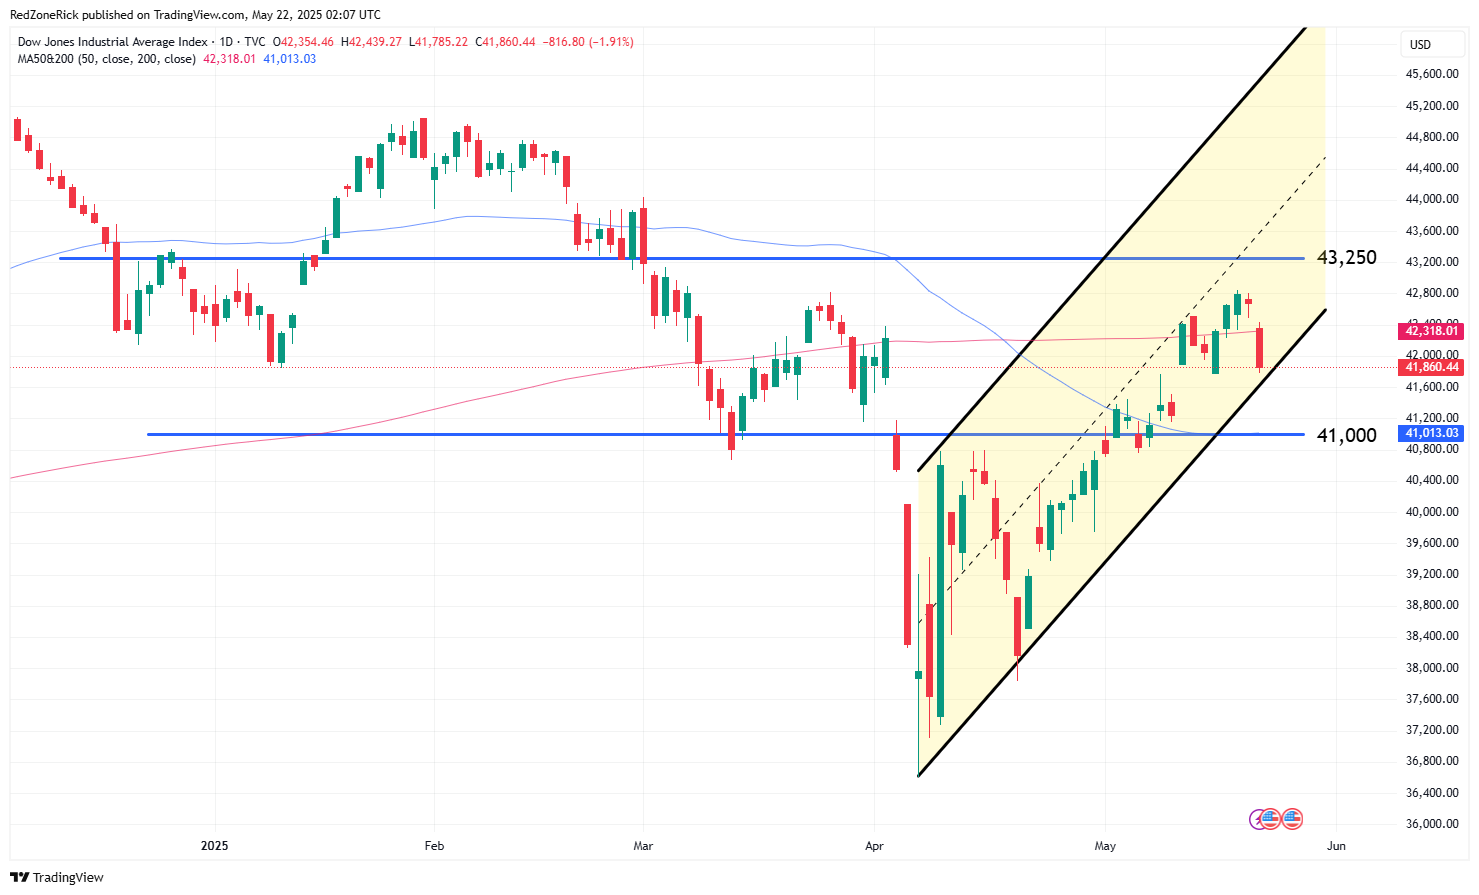
The Dow finished at 41,860 (-1.9%) with the low hitting 41,860. Support at 42,000 failed to hold. Resistance is at 42,500.
Earnings and Economic News
Before the open: Advance Auto Parts (AAP), BJ’s Wholesale (BJ), TD Bank Group (TD), Williams-Sonoma (WSM)
After the close: Autodesk (ADSK), Copart (CPRT), Deckers Brands (DECK), Intuit (INTU), Ralph Lauren (RL), Ross Stores (ROST), Workday (WDAY)
Economic news:
Initial Jobless Claims – 8:30am
PMI Services Index – 9:45am
Existing Home Sales – 10:00am
Technical Outlook and Market Thoughts
We talked about possible trading ranges forming into the back half of the month for the major indexes following the May 12th market breakout. Given the stealth v-shape recovering, this is a healthy process, as long as fresh support levels hold.
The charts are again simplified to show the uptrend channels and key support and resistance levels. The starting point remains off the early April lows with a breakdown out of these uptrend channels being the first warning signals of possible upcoming market weakness.
The Nasdaq remains in a seven-session trading range with support at 18,750-18,500. A close below the latter would be a slightly bearish signal with additional weakness to 18,250-18,000.
Resistance is at 19,750-20,000. The latter level is currently 6% away from clearing following Wednesday’s close.
The S&P 500 is in an eight-session trading range with crucial support at 5,800. There is stretch down to 5,750 and the 200-day moving average with a close below these levels and out of the current uptrend channel implying a near-term top.
Resistance is at 5,950-6,000. A close above the latter gets the previous one-month trading range from late January to late February up to 6,100 in play. The all-time high from February 19th is at 6,147.
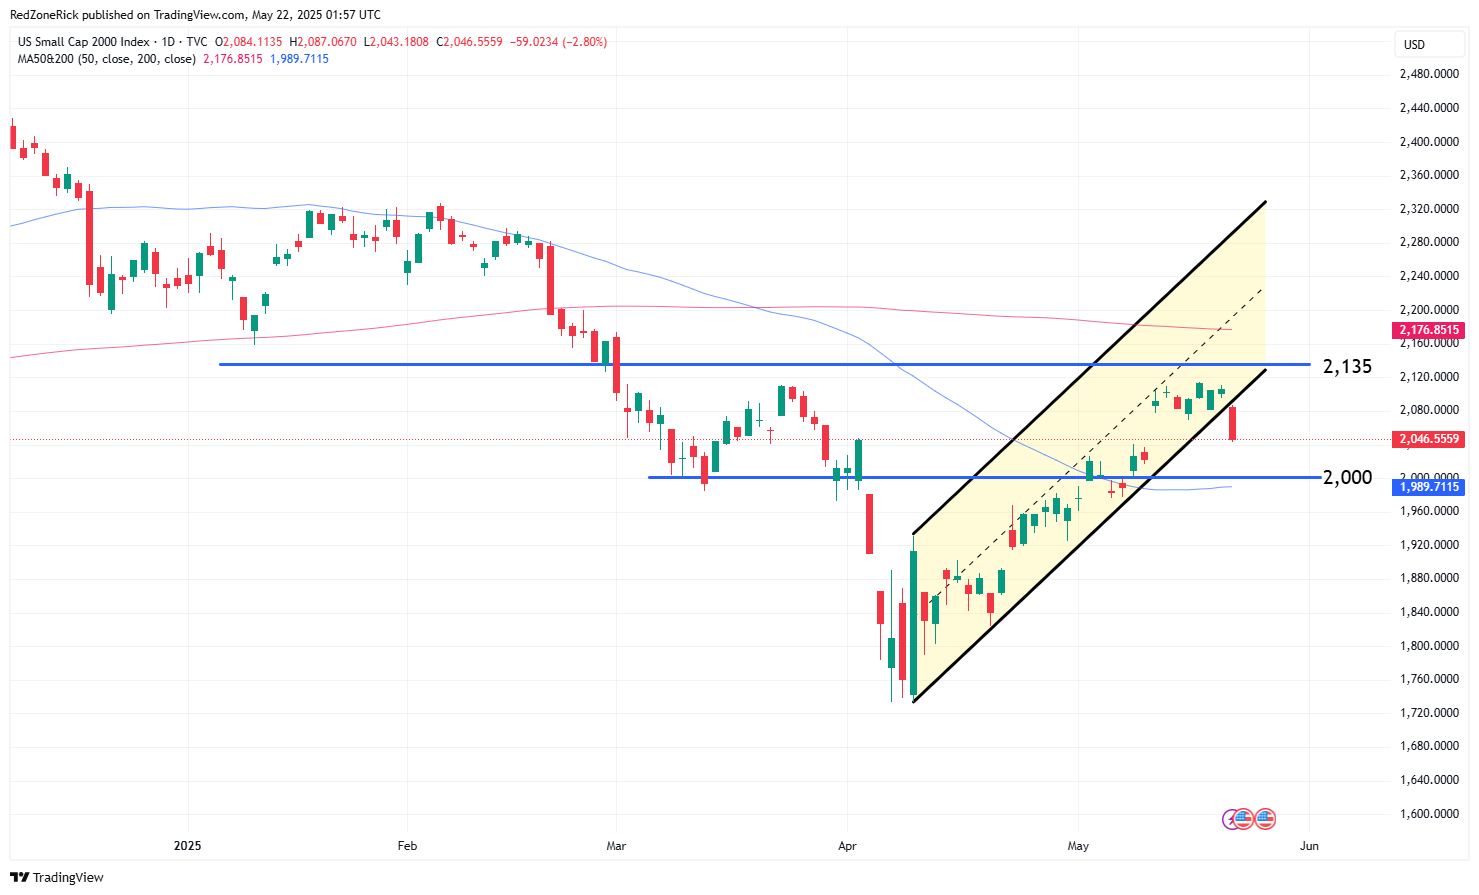
The Russell 2000 fell out of its current uptrend channel and closed below key support at 2,050. We mentioned last week there could be stretch down to 2,000-1,975 and the 50-day moving average if 2,050 failed to hold.
Key resistance remains at 2,135. If cleared the next hurdles are at 2,175 and the 200-day moving average.
The Dow closed back below its 200-day moving average but held the uptrend channel into Wednesday’s closing bell. A drop below 41,750 likely leads to further weakness to 41,000 and the 50-day moving average.
Resistance is at 42,750-43,000 with Monday’s peak at 42,842. We think another leg higher or a resumed rally occurs once 43,250 is cleared and held for multiple sessions.
The Volatility Index (VIX) closed back above 20 and the 200-day moving average on Wednesday. There is risk up to 24 if 22.50 is cleared this week.
Key support remains at 17.50 which was recovered for only one session on last Friday’s close at 17.24. This is why we always talk about confirming multiple closes above support or resistance levels to confirm price action.
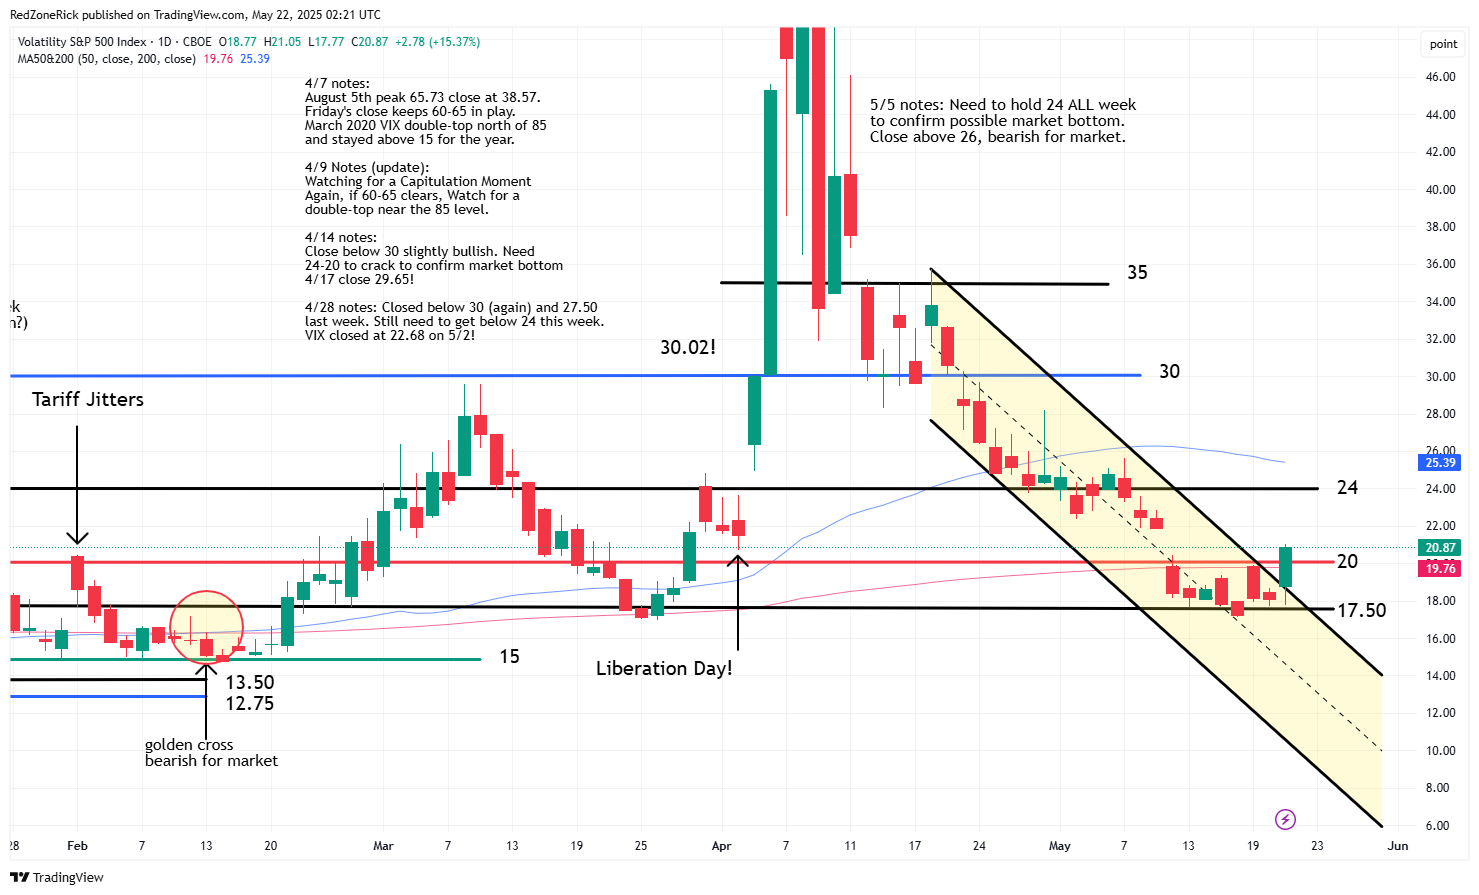
The two negatives from yesterday’s session were the small-caps close out of the uptrend channel and the aforementioned action in the VIX. If the other major indexes fail to hold key support levels, or fall out of their uptrend channels, and the VIX clears 24, investors should prepare for another bear attack.