Markets Lower Behind Global Trade Uncertainty and Additional Tariffs
Trade uncertainty drag stocks down
U.S. stocks are trending down on Monday as earnings season slows down and trade uncertainty continues to grow. Last week, President Trump announced an additional 10% tariffs will be added on $300 billion worth of Chinese goods which sent markets sharply lower.
Notable earnings this week
This week look for Disney, Marriott, Kraft-Heinz, and Uber earnings as well as consumer credit reports for June and producer price index for July.
Volatility returns
Although earnings have returned mostly positive and the Fed announced a rate cut last week, volatility has returned. Uncertainty regarding U.S.-China negotiations, Brexit, and interest rates continues to grow as market breached $290 level on SPY.
(Want free training resources? Check our our training section for videos and tips!)
Buy near $270 for the SPY
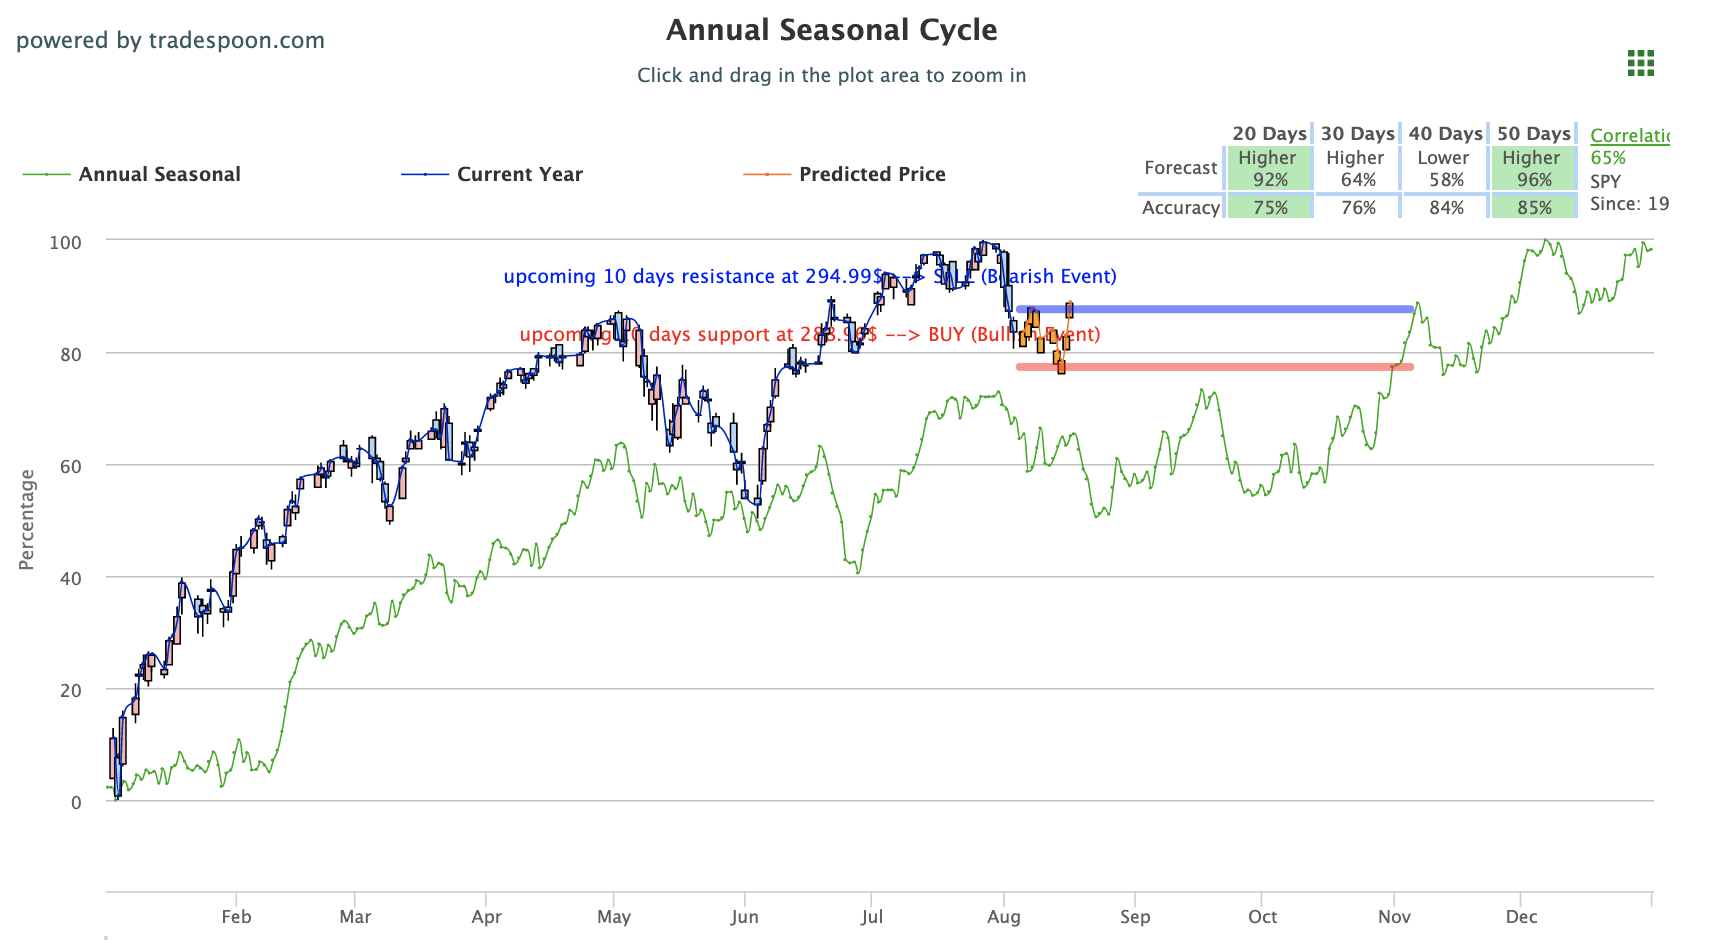
With the current state of the market, we will sell when it is near $290 and look to buy near $270 for the SPY. We urge our readers to have very clearly defined stop levels for all positions as volatility in the market continues to rise. For reference, the SPY Seasonal Chart is shown below:

(Want free training resources? Check our our training section for videos and tips!)
All three major U.S. indices close in red
All three major U.S. indices are on track to close in the red today following continued uncertainty regarding future FOMC interest rate decisions as well as U.S.-China trade relations.
Notes from Powell
After cutting rates by a quarter-point in last week’s FOMC, Fed Chair Jerome Powell tempered the notion the Fed would go into a long rate cutting cycle. Powell referred to the cut as a “mid-cycle adjustment,” stating political pressure and global trade did not impact the Fed’s decision.
(Want free training resources? Check our our training section for videos and tips!)
Talks between U.S. and China fail
Also taking place last week were talks between U.S. and China trade representative which, while stated as productive by both sides, did not result in any agreement or significant progress which triggered President Trump to move forth with further tariffs.
An additional 10% on $300 billion worth of Chinese goods
Starting September 1st, an additional 10% on $300 billion worth of Chinese goods will go into effect. Both sides are due to meet in September for continued negotiations as well.
Chinese currency lower after additional tariffs news
Originally, Chinese currency lowered significantly following news of additional tariffs but have since rebound causing Trump to address the situation this morning.
Trump call China for “currency manipulation”
In an early-morning tweet, President Trump called for Fed’s attention stating “China dropped the price of their currency to an almost historic low. It’s called “currency manipulation.” Are you listening Federal Reserve? This is a major violation which will greatly weaken China over time!” Continue monitoring this situation as it develops.
Global markets share the same destiny as U.S.
Globally, Asian markets finished significantly lower while European markets traded also closed in the red.
(Want free training resources? Check our our training section for videos and tips!)
Earnings season slow down
Although having significantly slowed, several big-name brands are still due to report earnings. Tyson shares rose after the meat producer topped expectations while Lowe’s, which also released before the market opened today, saw shares lower after missing expectations.
Notable earnings to pay attention
Still, due to report today are Marriott, Caesars Entertainment, and Avis Budget Group while tomorrow look for Blue Apron, Devon Energy, Hertz, Papa John’s, and Disney. Major earnings to monitor in the back of the week include CVS, Cronos Group, Kraft-Heinz, Lyftt, Marathon Oil, Viacom, and Uber.
Economic data this week
Economic report releases are also light this week with June job openings data set to be released tomorrow, Wholesale Inventories month-on-month on Thursday, and Producer Price Index for July on Friday.
(Want free training resources? Check our our training section for videos and tips!)
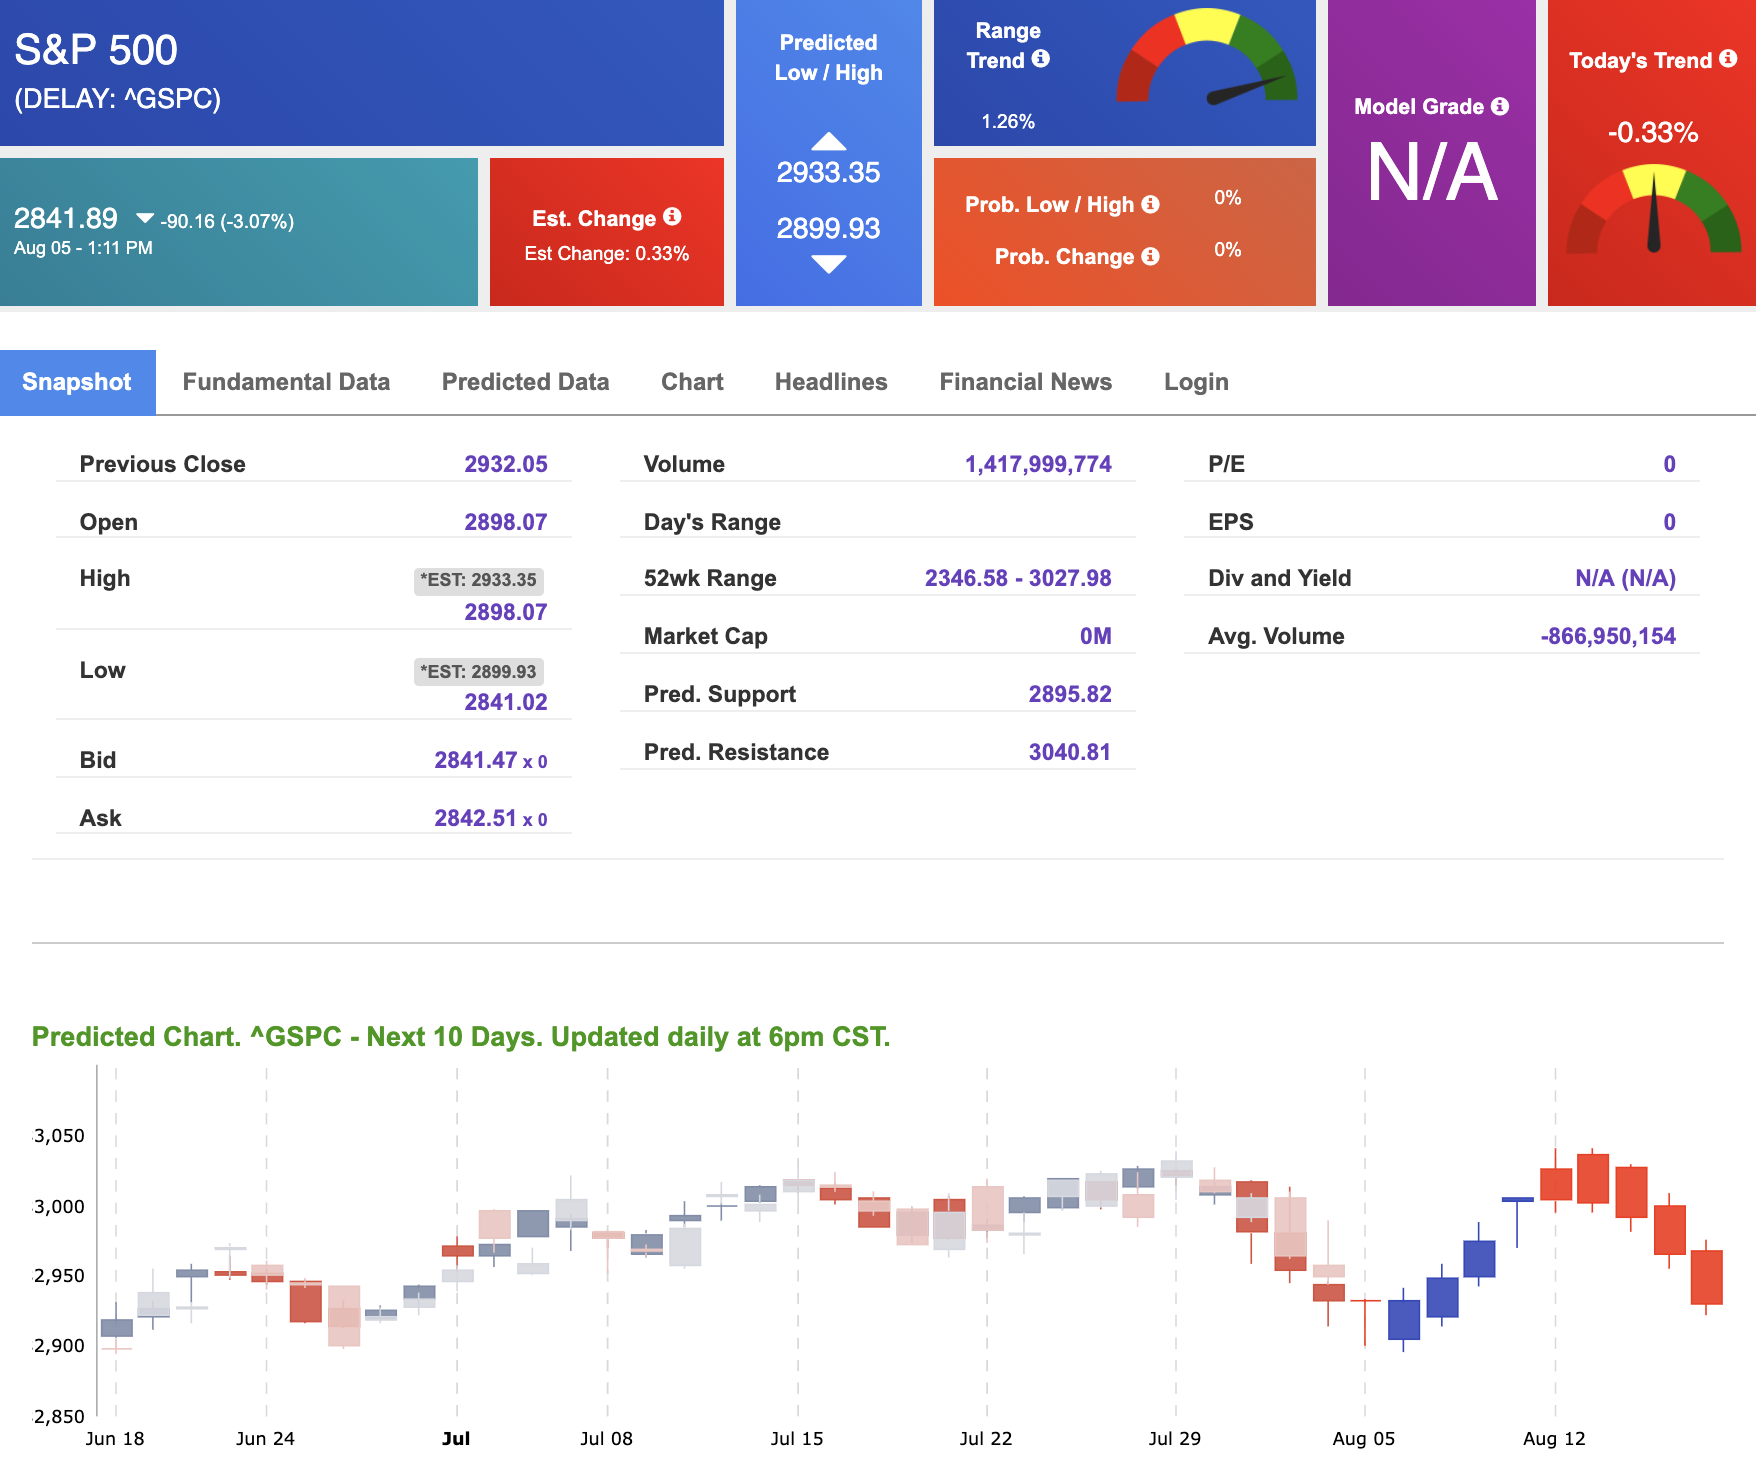
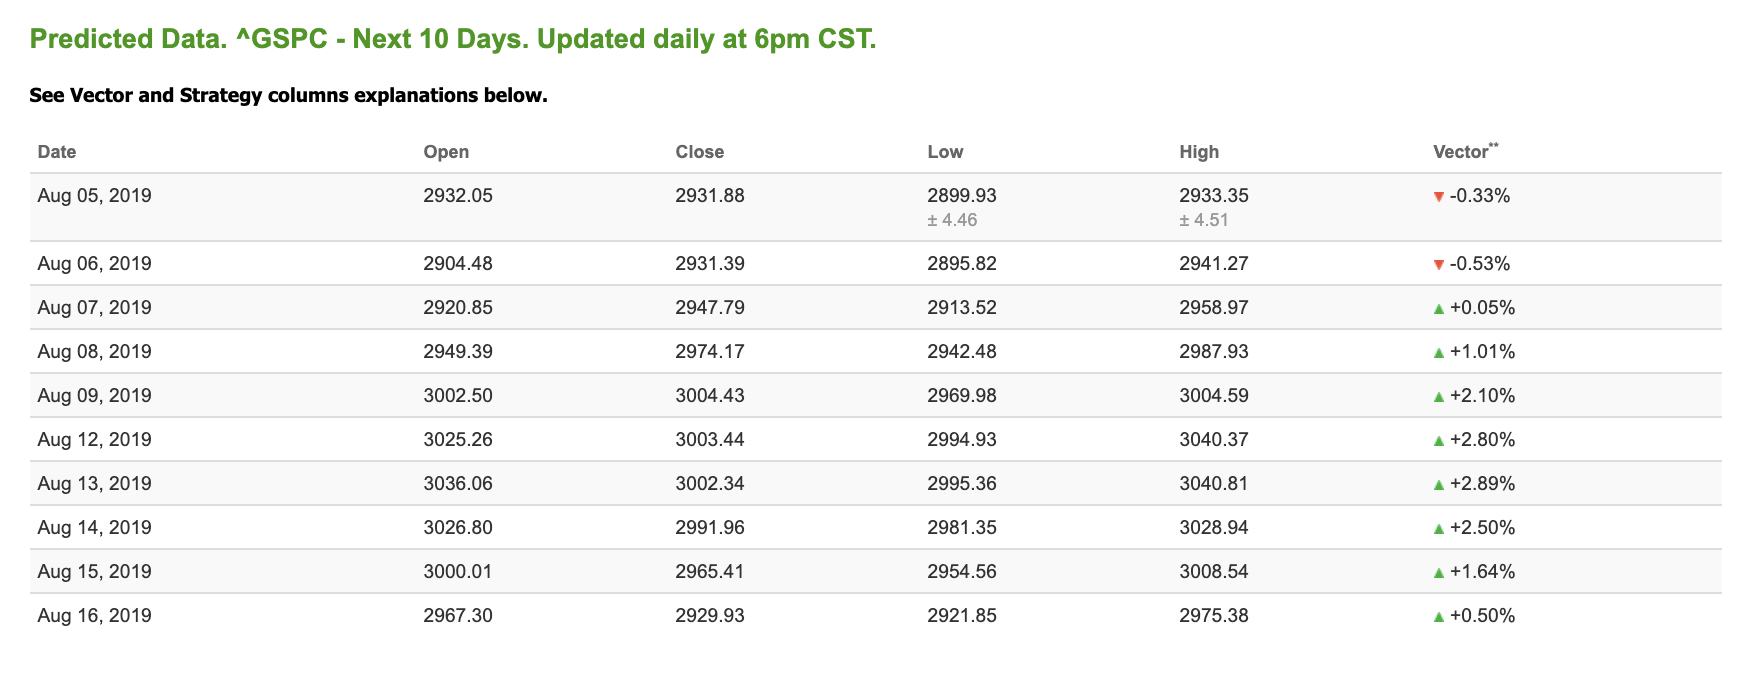
Using the “^GSPC” symbol to analyze the S&P 500 our 10-day prediction window shows mixed signals. Today’s vector figure of -0.33% moves to +2.80% in five trading sessions. Prediction data is uploaded after the market close at 6pm, CST. Today’s data is based on market signals from the previous trading session.
(Want free training resources? Check our our training section for videos and tips!)
I’VE GOT SKIN IN THIS GAME!
Even in this wild market, you can do it too. This no-risk trial will empower you with the same incredible volatility tested “tools” I use to trade my own money! Our AI will forecast any “Buy-Sell” Signals with a stunning 75% win rate for both a short- and long-term investment strategy.
Click here for more info…
(Want free training resources? Check our our training section for videos and tips!)
Highlight of a Recent Winning Trade
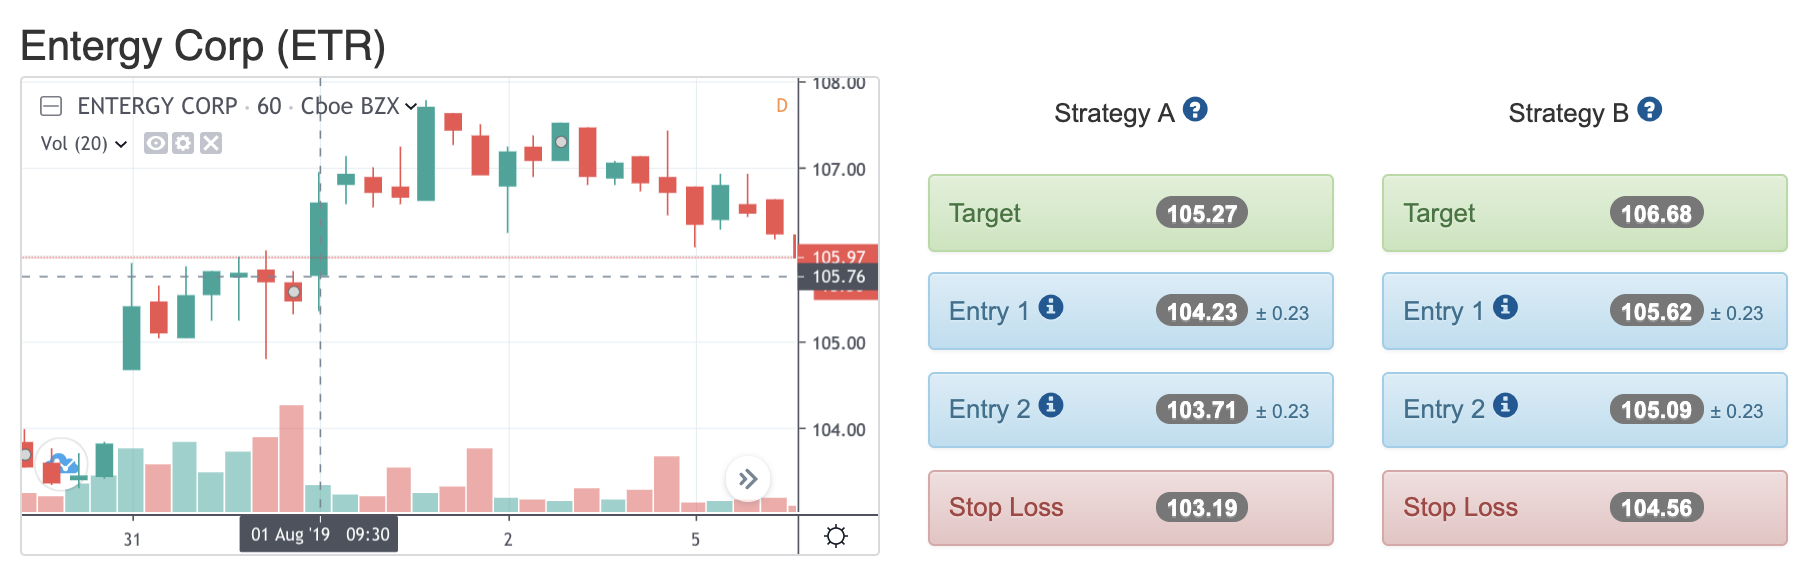
On August 1st, our ActiveTrader service produced a bullish recommendation for Entergy Corp (ETF). ActiveTrader is included in all paid Tradespoon membership plans and is designed for day trading.
Trade Breakdown
ETR entered its forecasted Strategy B Entry 1 price range $105.62 (± 0.23) in its first hour of trading and passed through its Target price $106.68 in the second hour of trading that day. The Stop Loss price was set at $104.56
(Want free training resources? Check our our training section for videos and tips!)
Tuesday Morning Featured Symbol
*Please note: At the time of publication we do own the featured symbol, VXX. We are long on VXX. Our featured symbol is part of your free subscription service. It is not included in any paid Tradespoon subscription service.
Vlad Karpel only trades his own personal money
Vlad Karpel only trades his own personal money in paid subscription services. If you are a paid subscriber, please review your Premium Member Picks, ActiveTrader or MonthlyTrader recommendations. If you are interested in receiving Vlad’s personal picks, please click here.
(Want free training resources? Check our our training section for videos and tips!)
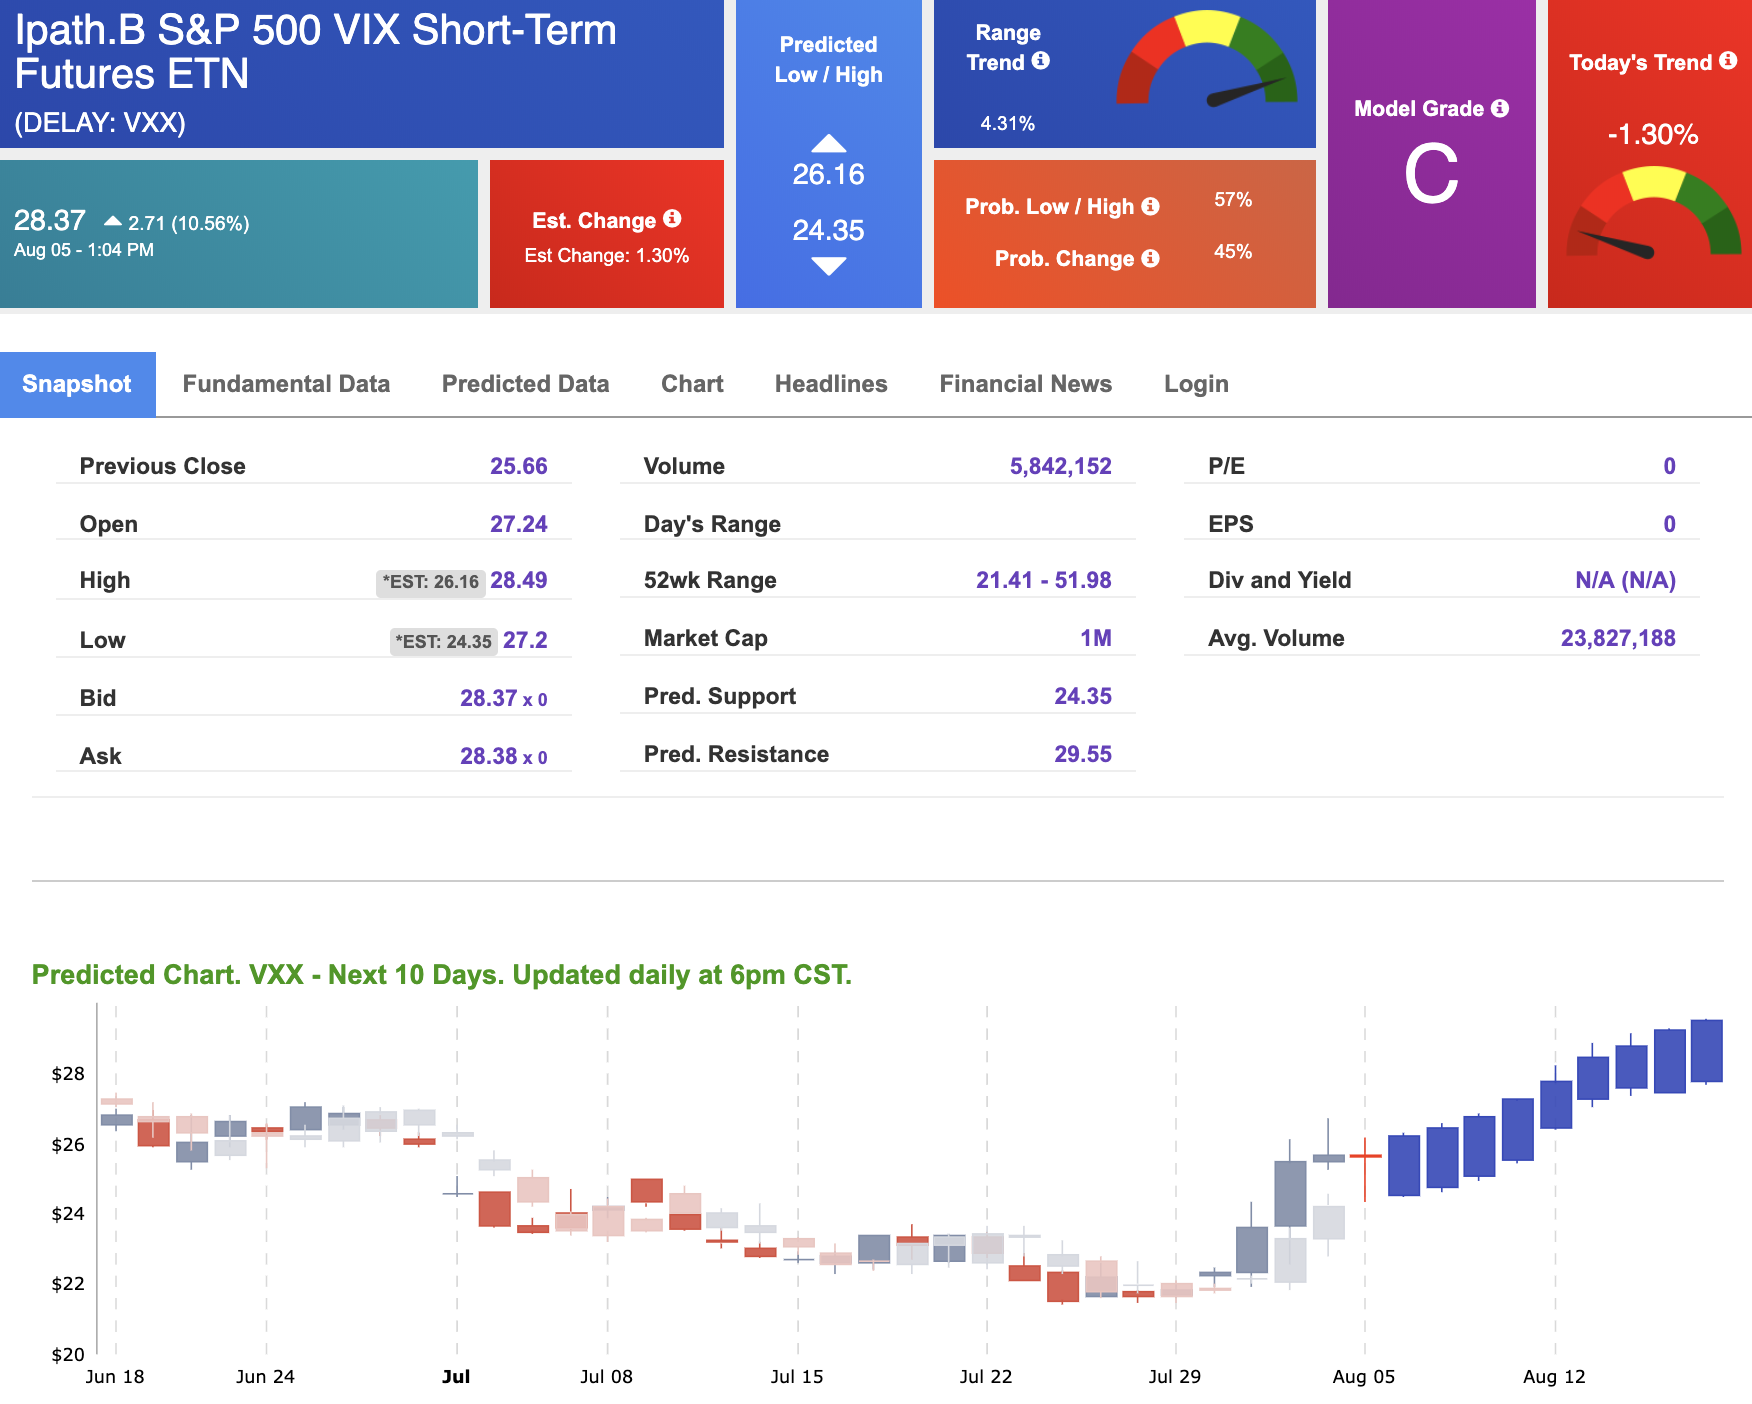
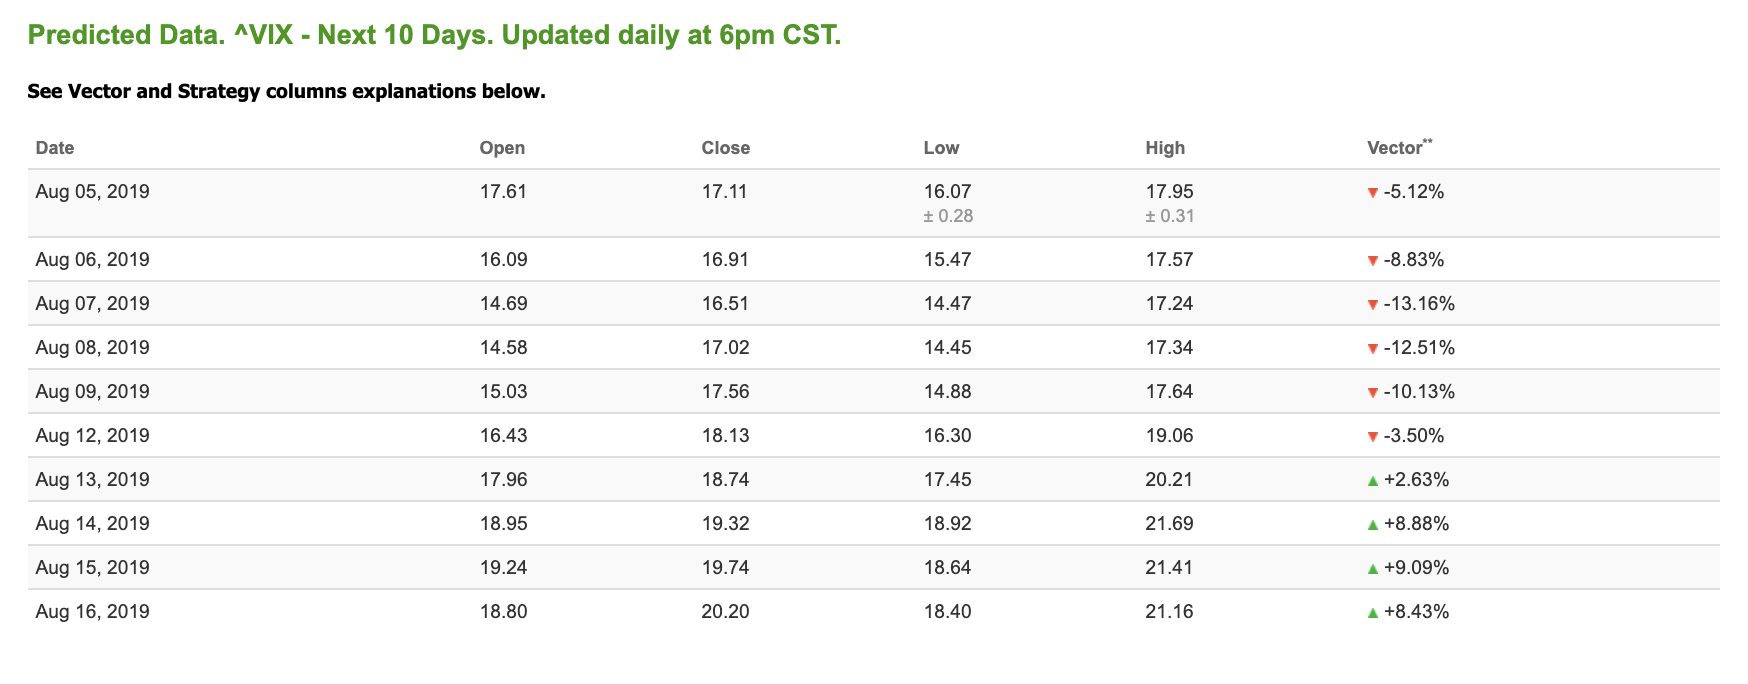
Our featured symbol for Tuesday is iPath S&P 500 VIX (VXX). VXX is showing a confident vector trend in our Stock Forecast Toolbox’s 10-day forecast. This stock is assigned a Model Grade of (C) indicating it ranks in the top 50th percentile for accuracy for predicted support and resistance, relative to our entire data universe.
(Want free training resources? Check our our training section for videos and tips!)
(Want free training resources? Check our our training section for videos and tips!)
The stock is trading at $28.27 at the time of publication, up 10.56% from the open with a -1.30% vector figure.
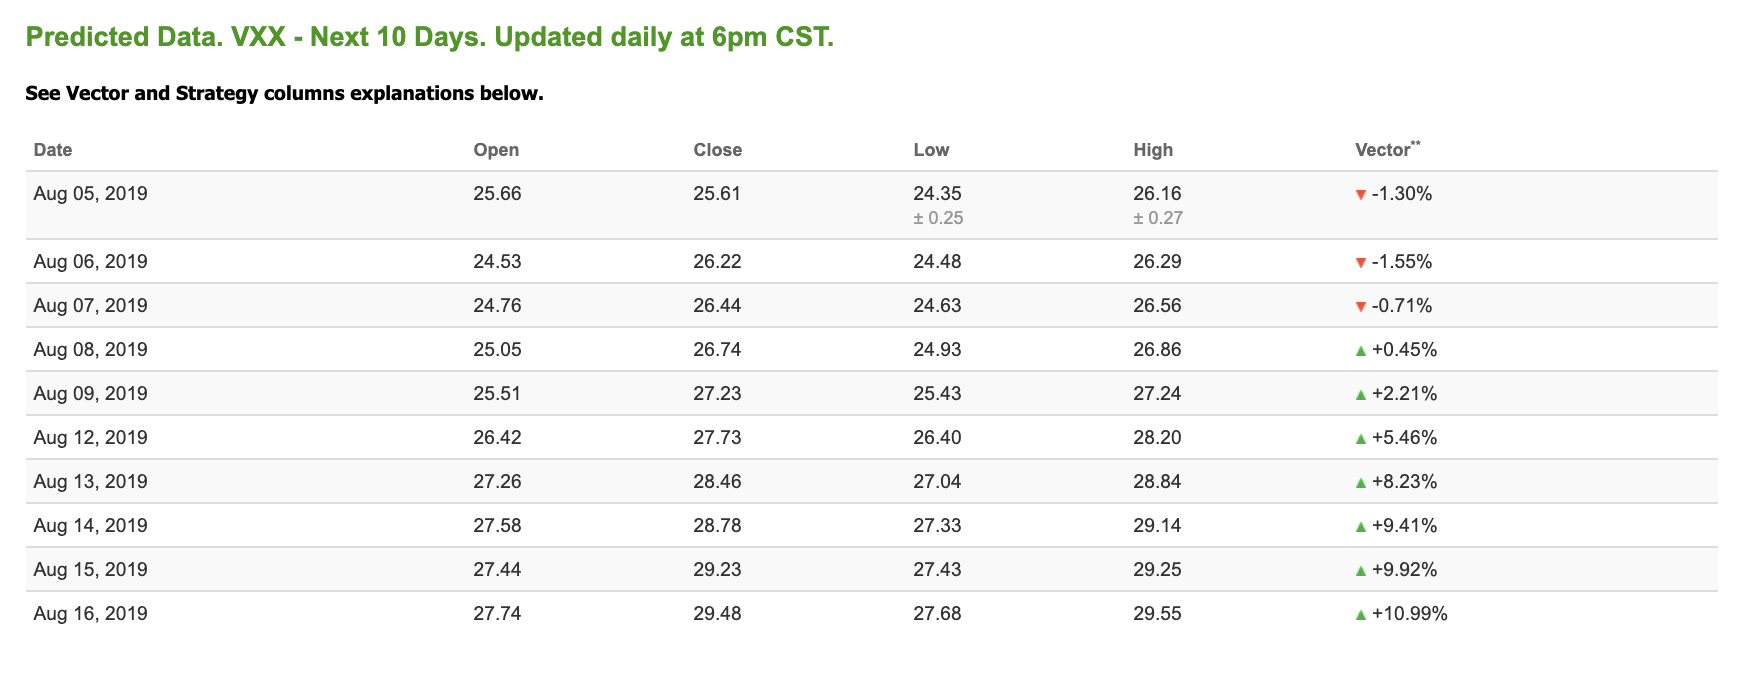
Prediction data is uploaded after market close at 6 p.m., CST. Today’s data is based on market signals from the previous trading session.
Note: The Vector column calculates the change of the Forecasted Average Price for the next trading session relative to the average of actual prices for the last trading session. The column shows expected average price movement “Up or Down”, in percent. Trend traders should trade along the predicted direction of the Vector. The higher the value of the Vector the higher its momentum.
(Want free training resources? Check our our training section for videos and tips!)
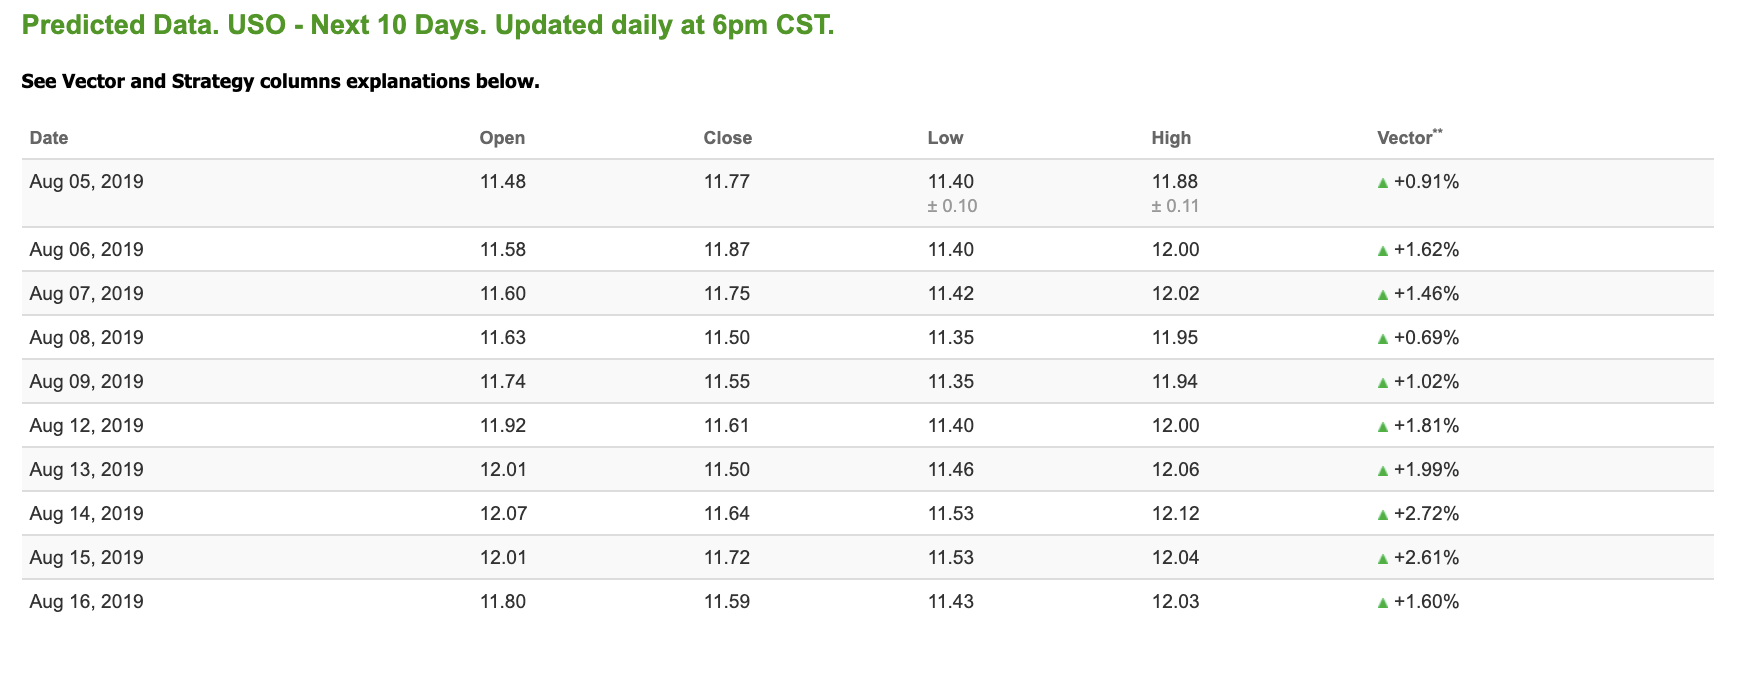
Oil
West Texas Intermediate for Crude Oil delivery (CL.1) is priced at $54.58 per barrel, down 1.96% from the open, at the time of publication.
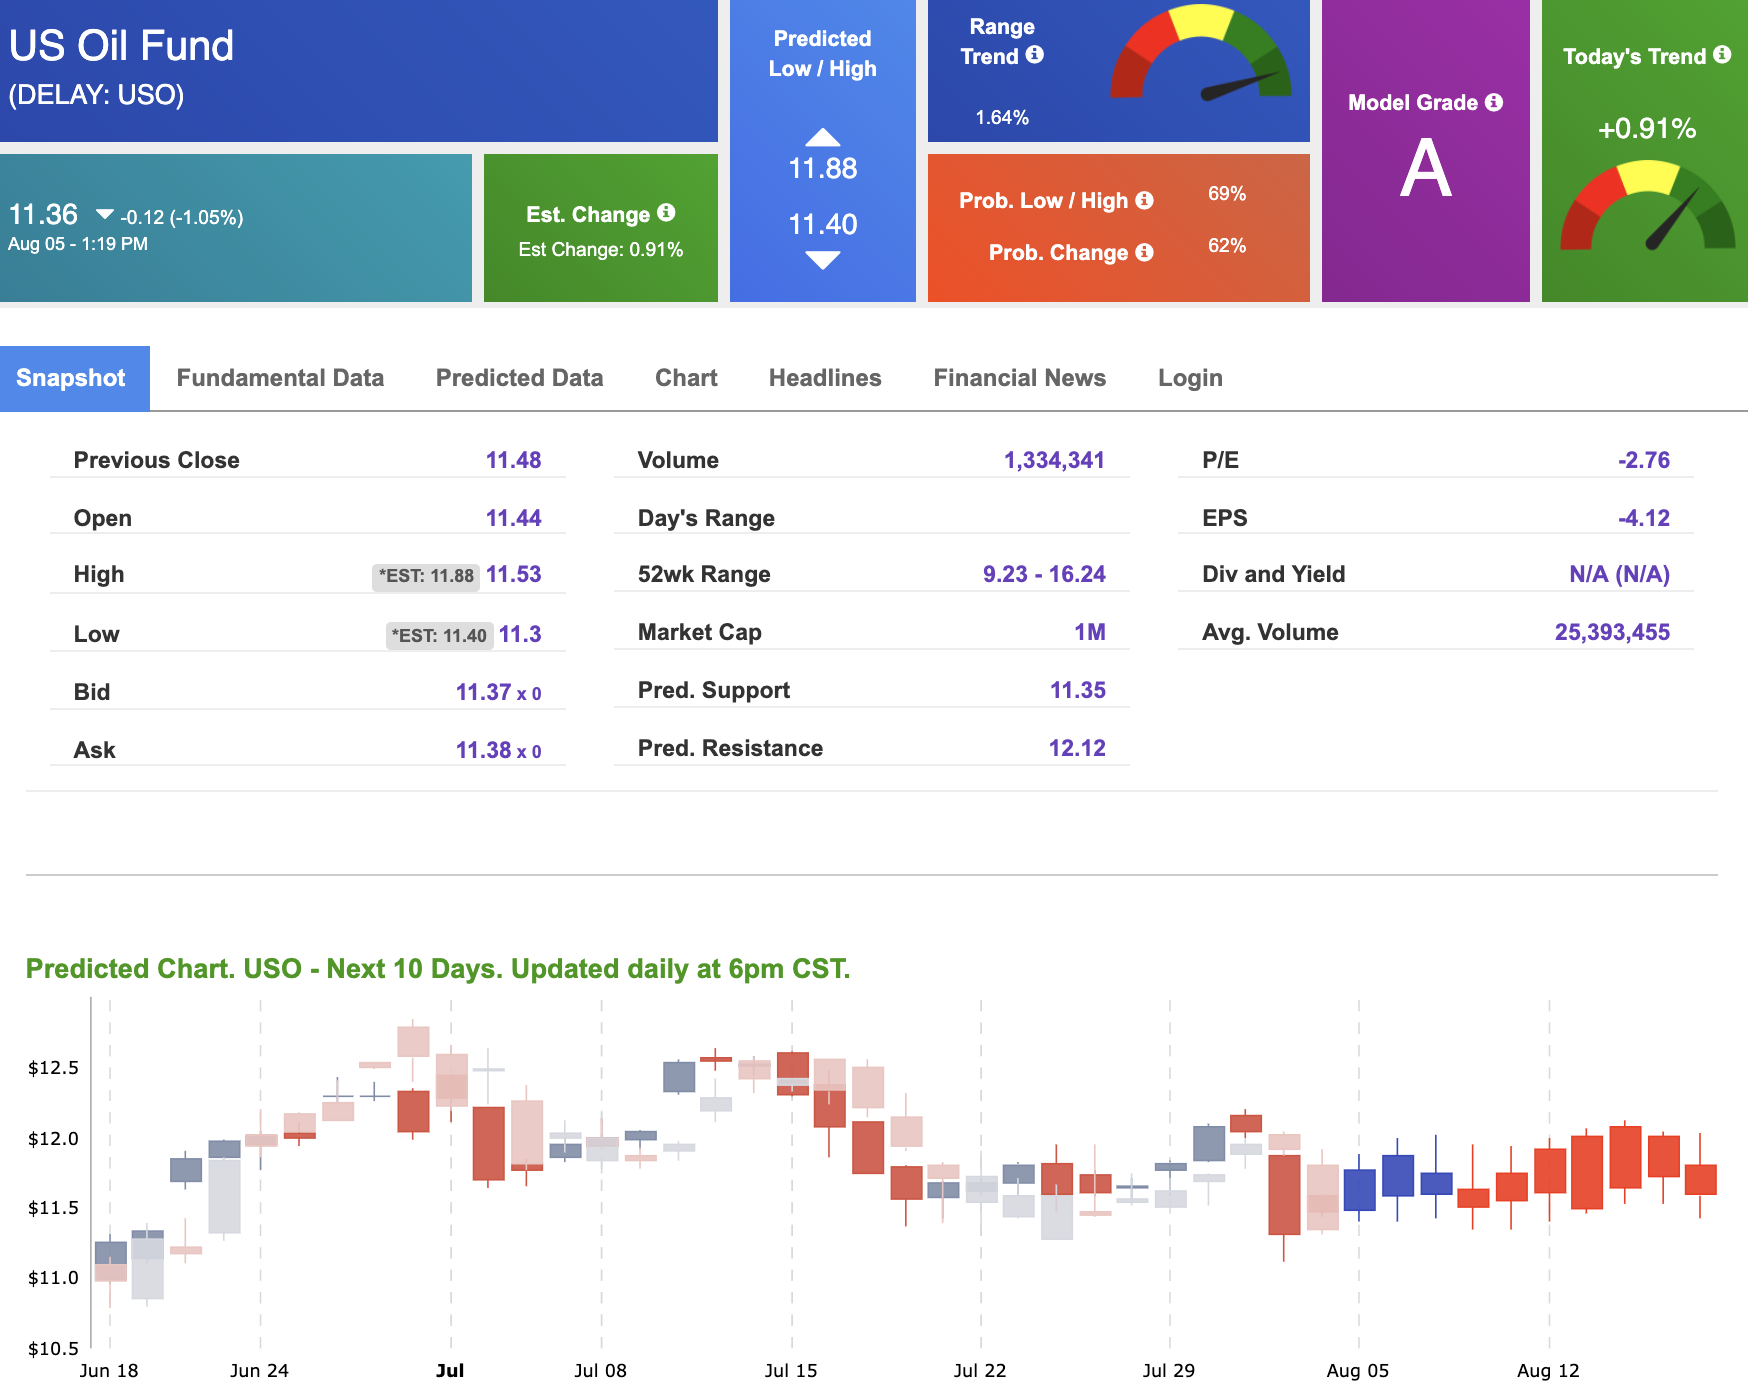
Looking at USO, a crude oil tracker, our 10-day prediction model shows positive signals. The fund is trading at $11.36 at the time of publication, down 1.05% from the open. Vector figures show +0.91% today, which turns +1.81% in five trading sessions. Prediction data is uploaded after market close at 6 p.m., CST. Today’s data is based on market signals from the previous trading session.
(Want free training resources? Check our our training section for videos and tips!)
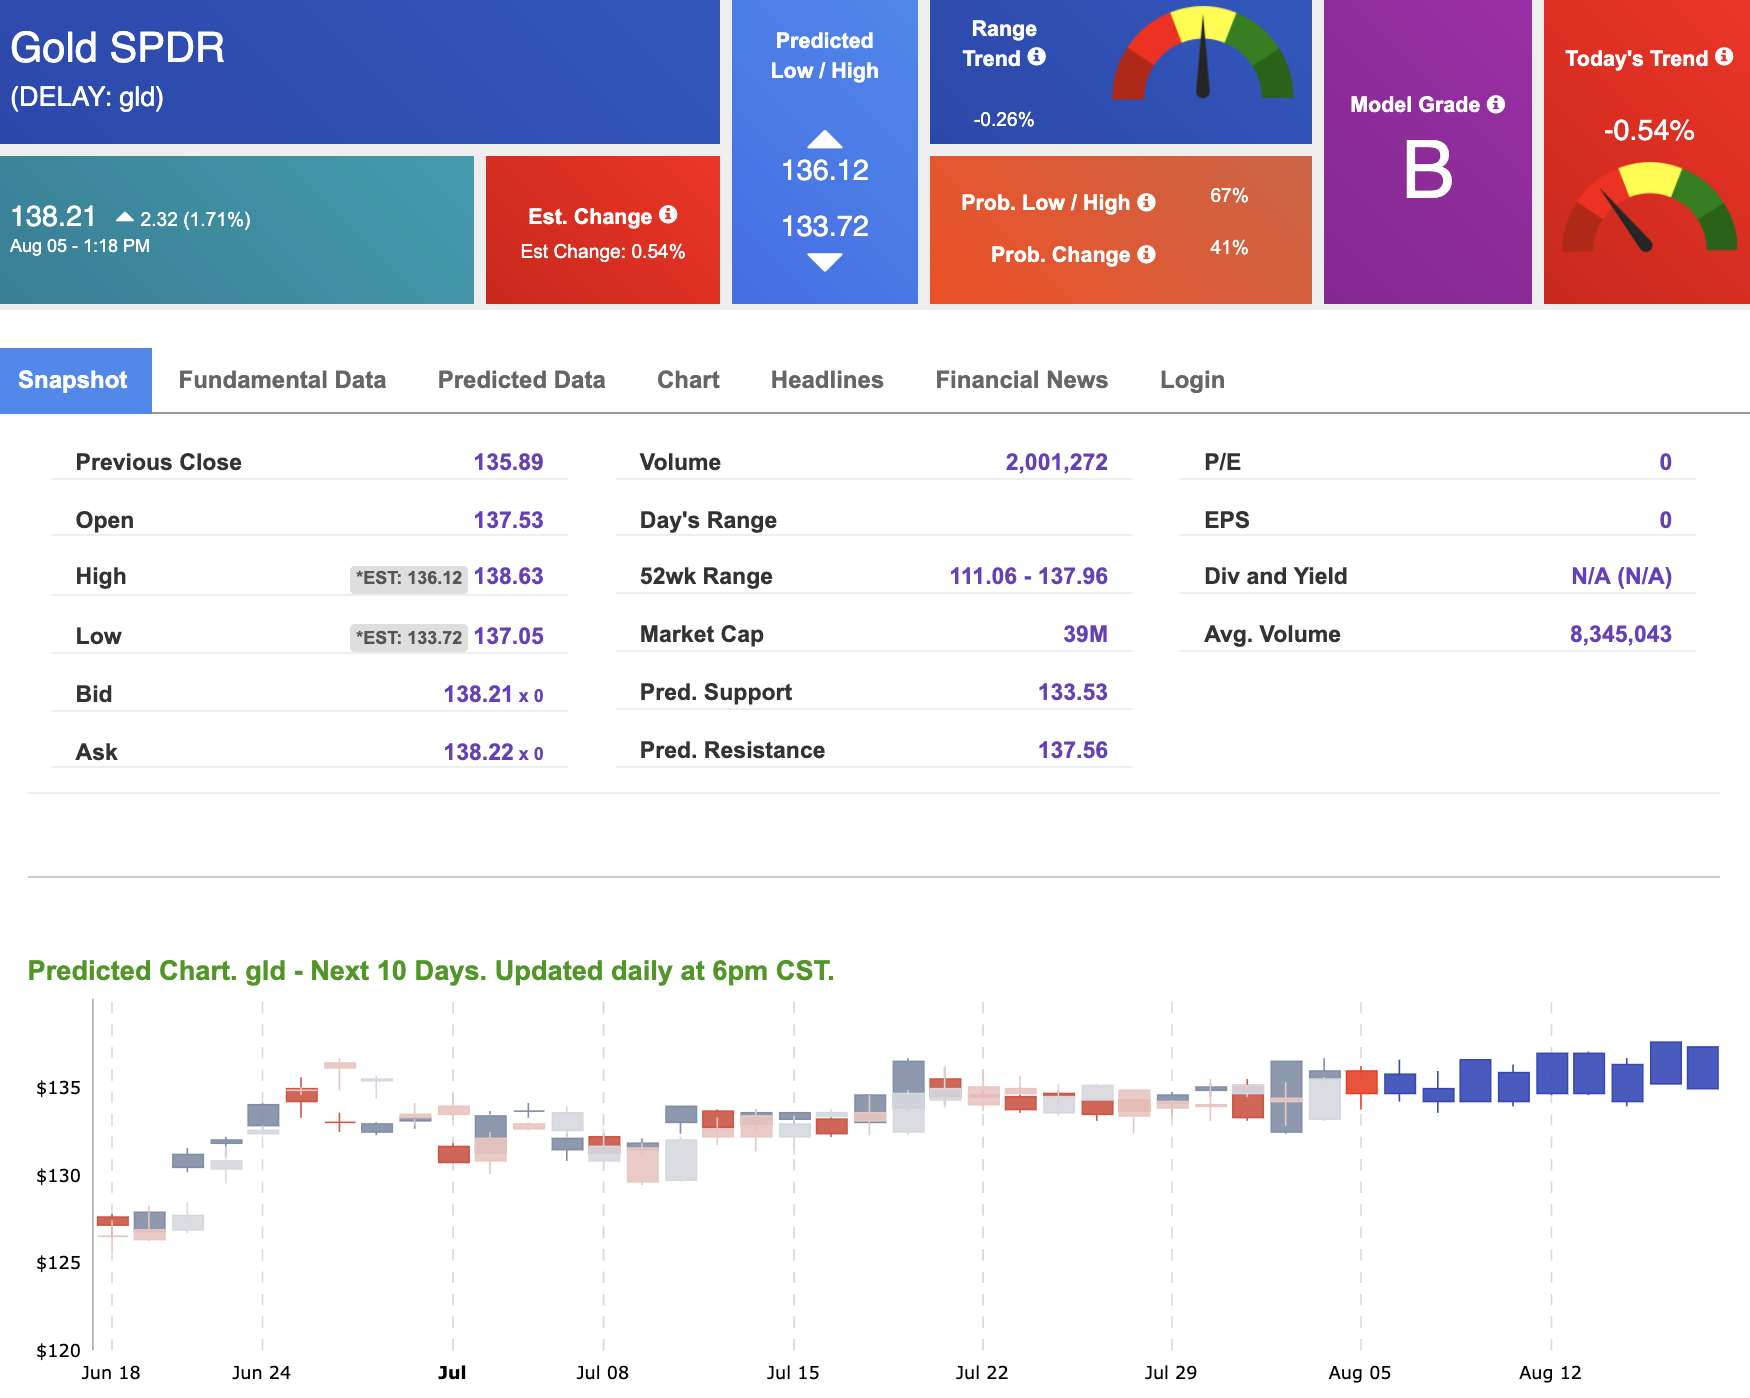
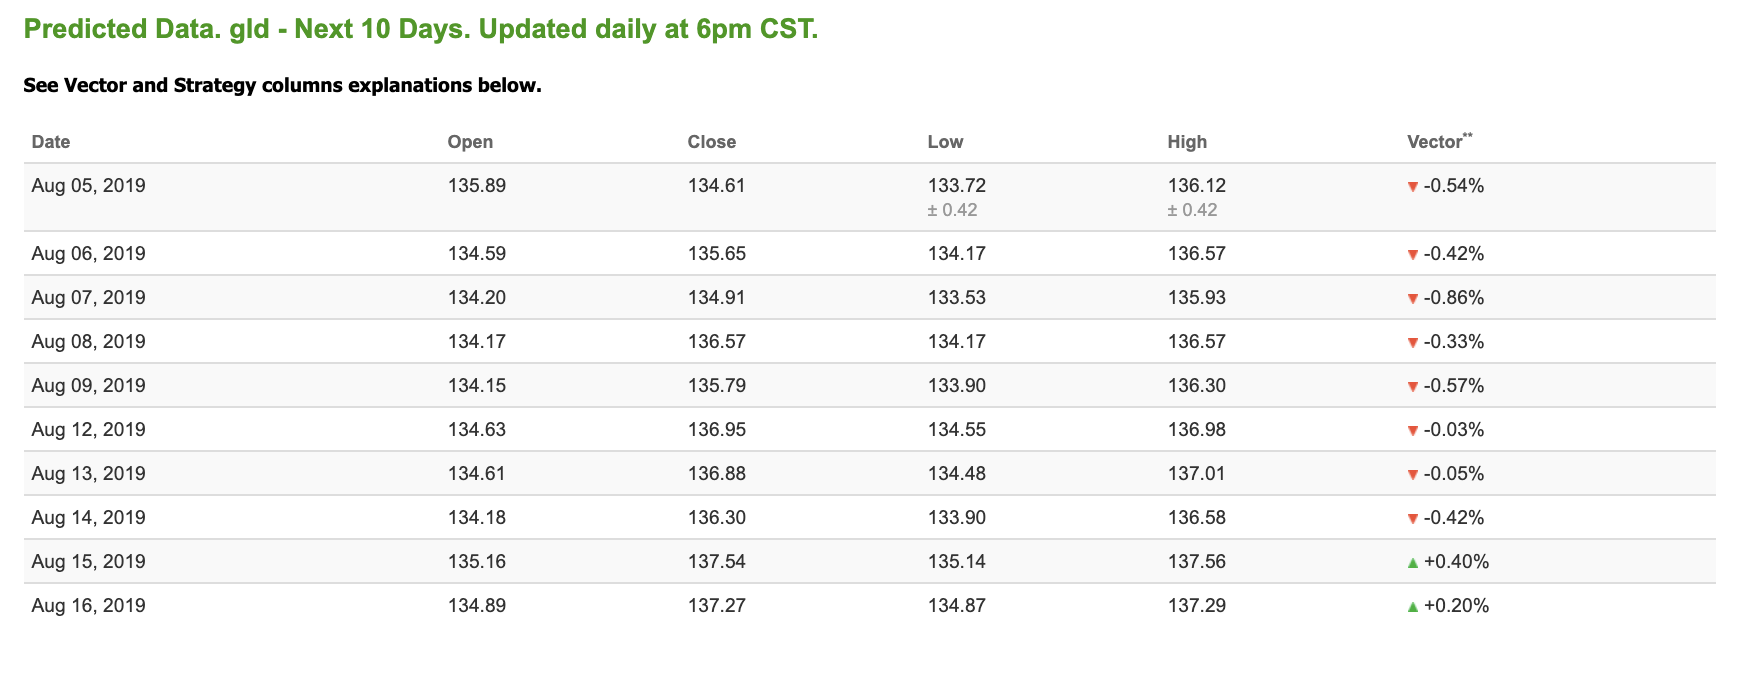
Gold
The price for the Gold Continuous Contract (GC00) is up 1.43% at $1,478.70 at the time of publication.
Using SPDR GOLD TRUST (GLD) as a tracker in our Stock Forecast Tool, the 10-day prediction window shows mostly negative signals. The gold proxy is trading at $138.21, up 1.71% at the time of publication. Vector signals show -0.54% for today. Prediction data is uploaded after market close at 6 p.m., CST. Today’s data is based on market signals from the previous trading session.
(Want free training resources? Check our our training section for videos and tips!)
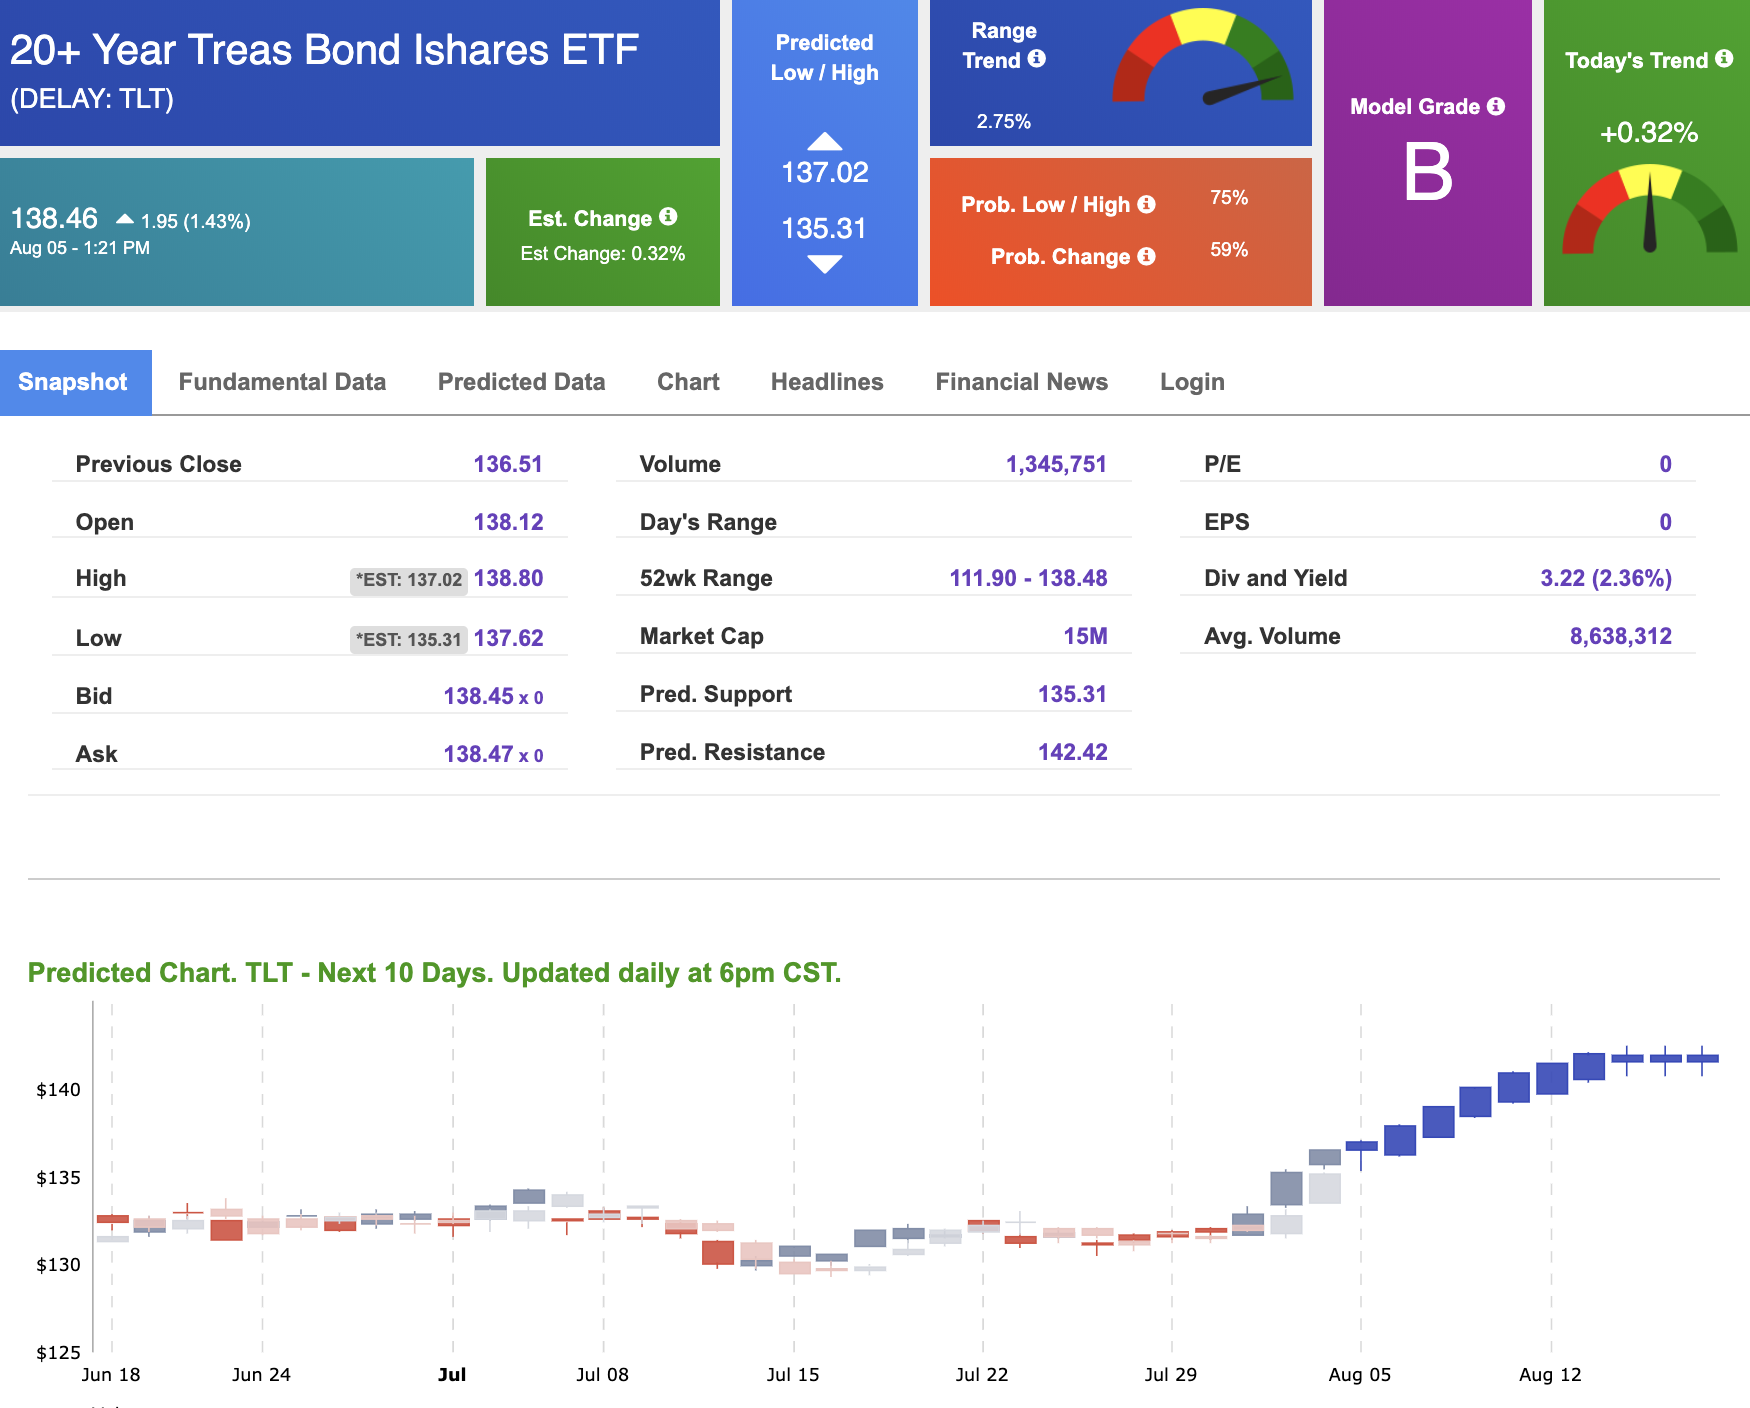
Treasuries
The yield on the 10-year Treasury note is down 5.58% at 1.74% at the time of publication. The yield on the 30-year Treasury note is down 3.50% at 2.30% at the time of publication.
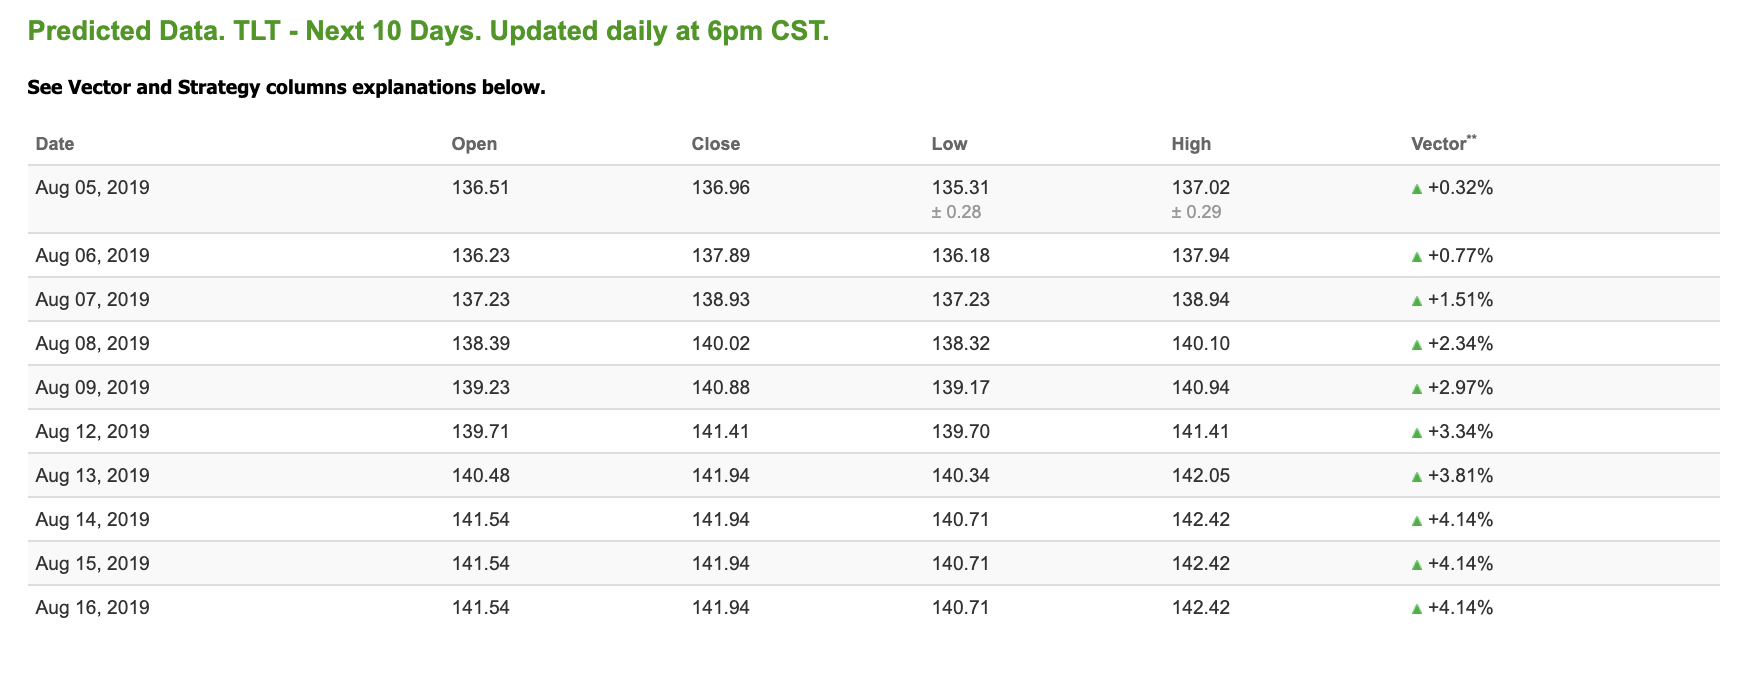
Using the iShares 20+ Year Treasury Bond ETF (TLT) as a proxy for bond prices in our Stock Forecast Tool, we see positive signals in our 10-day prediction window. Today’s vector of +0.32% moves to +2.34% in three sessions. Prediction data is uploaded after market close at 6 p.m., CST. Today’s data is based on market signals from the previous trading session.
(Want free training resources? Check our our training section for videos and tips!)
Volatility
The CBOE Volatility Index (^VIX) is up 29.42% at $22.79 at the time of publication, and our 10-day prediction window shows mixed signals. Prediction data is uploaded after market close at 6 p.m., CST. Today’s data is based on market signals from the previous trading session.
(Want free training resources? Check our our training section for videos and tips!)