Markets Lower Behind Global Uncertainty
TRADE UNCERTAINTY PUSH STOCKS LOWER
Stocks are trending lower today behind underwhelming economic data and continued U.S.-China trade uncertainty.
TRUMP’S COMMENTS ALARM INVESTORS
Core CPI and inflation data returned mostly flat while yesterday’s comments from President Trump regarding a U.S.-China trade deal have alarmed investors.
FEDERAL BUDGET REPORT TO RELEASE TODAY
Look for May’s Federal Budget report to release today while weekly jobless claims and import price index data is scheduled for tomorrow.
NOTABLE ECONOMIC DATA ON FRIDAY
Retail sales, industrial production, and consumer sentiment index are due Friday.
(Want free training resources? Check our our training section for videos and tips!)
SPY BUYING OPPORTUNITY NEAR $286
We expect the market to remain between $286-$290 for the SPY and encourage our readers to buy near $286. Avoid chasing near $290 and monitor 50 days moving average, $286, for SPY, which we are currently trading above.
OVERHEAD RESISTANCE FOR SPY SITS AT $290
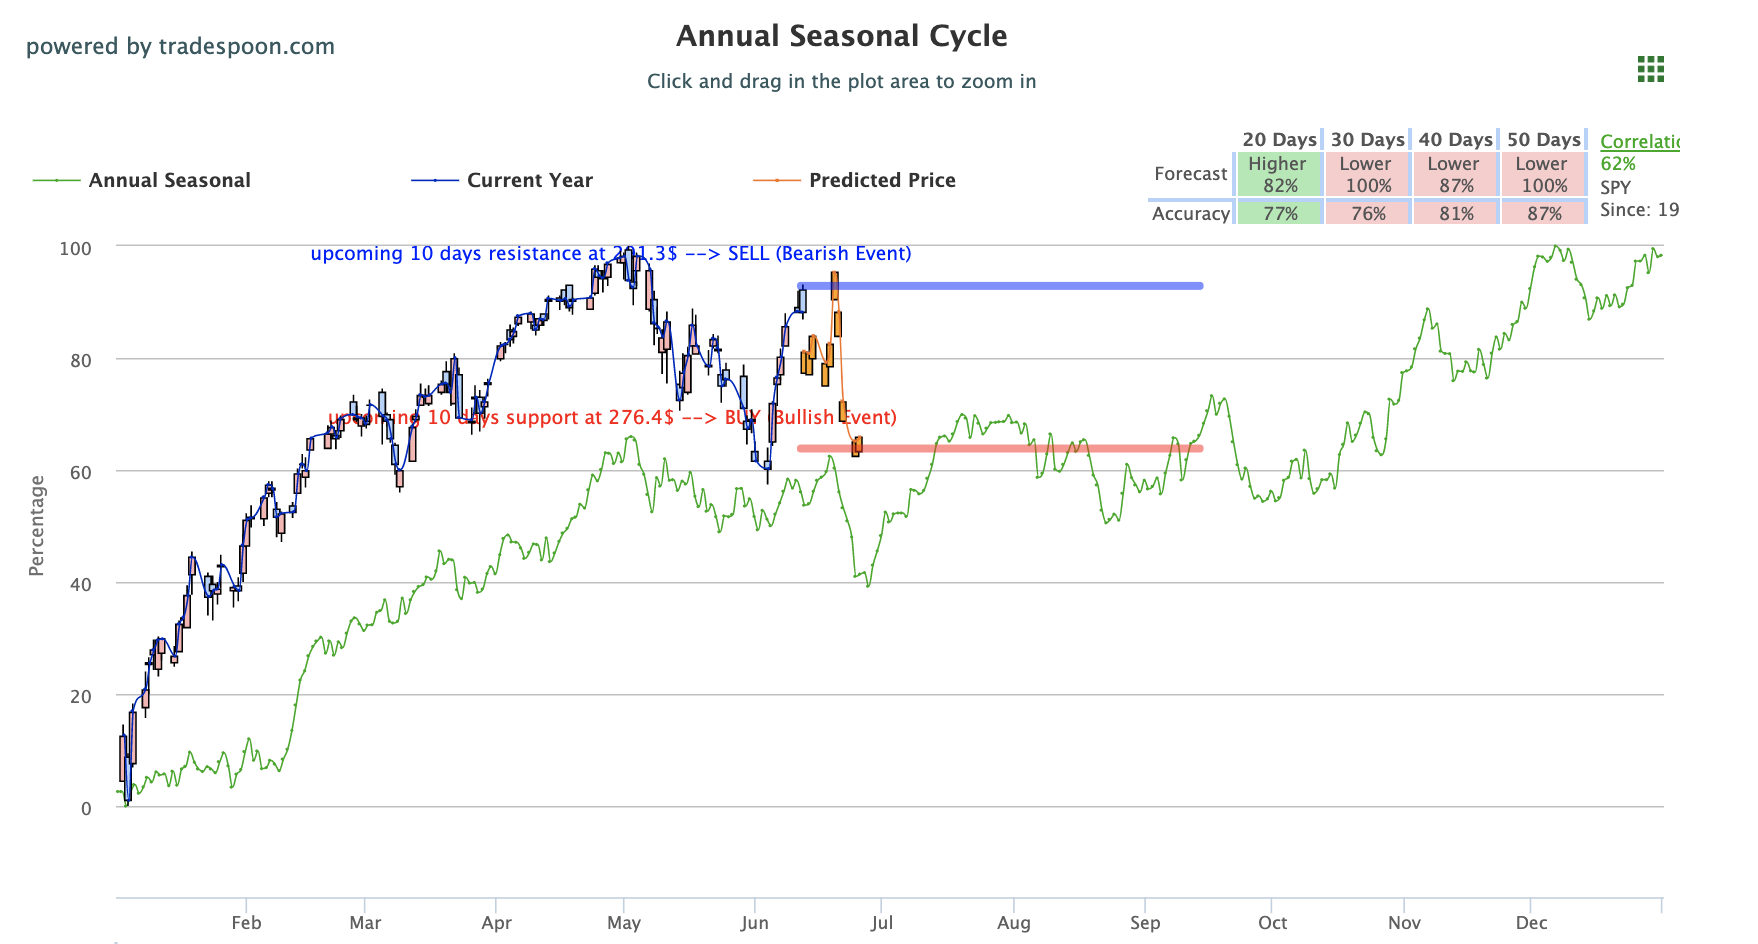
Overhead resistance for SPY sits at $290. If the market breaks $290 for a few days we could see a retest of the 52 weeks high. For reference, the SPY Seasonal Chart is shown below:
CURRENT INFLATION DATA LOWERED MARKETS TODAY
Although the current inflation data lowered markets today, speculation that a rate cut is soon due only increased, which in turn could support markets in the days to come.
CPI MADE SMALLEST INCREASE THIS YEAR APART FROM JANUARY
The consumer price index rose only 0.1% in April, which was the smallest increase this year apart from January, and a more noticeable increase in the cost of living was also noted in the report. Other data to note from the report includes gasoline prices lowering 0.5%, food rising 0.3%, medical care and rent rising 0.2%, and used-vehicle prices lowering 1.4%.
LULULEMON AND BROADCOM EARNINGS SET TO RELEASE
Look for Lululemon earnings are set to release after market close today while Broadcom will release tomorrow. Next week look for Oracle and Canopy Growth numbers.
TRADE UNCERTAINTY LOWER THE STOCKS
On Tuesday, President Trump stated he was “holding up” a trade deal with China in hopes of a better deal, clarifying both sides would either “do a great deal…or we’re not doing a deal at all.” This sent markets lower this morning after a string of consecutive days in the green for all three major U.S. indices.
(Want free training resources? Check our our training section for videos and tips!)
Also coming from the President yesterday were some harsh words towards the Fed, stating high-interest rates are devaluing the dollar against global currencies such as the euro. Overseas, China inflation data for May returned and showed sizable growth, up 2.7%. Globally, Asian and European markets closed in the red, with the Hong Kong market picking up the largest loss at -1.73% for the day.
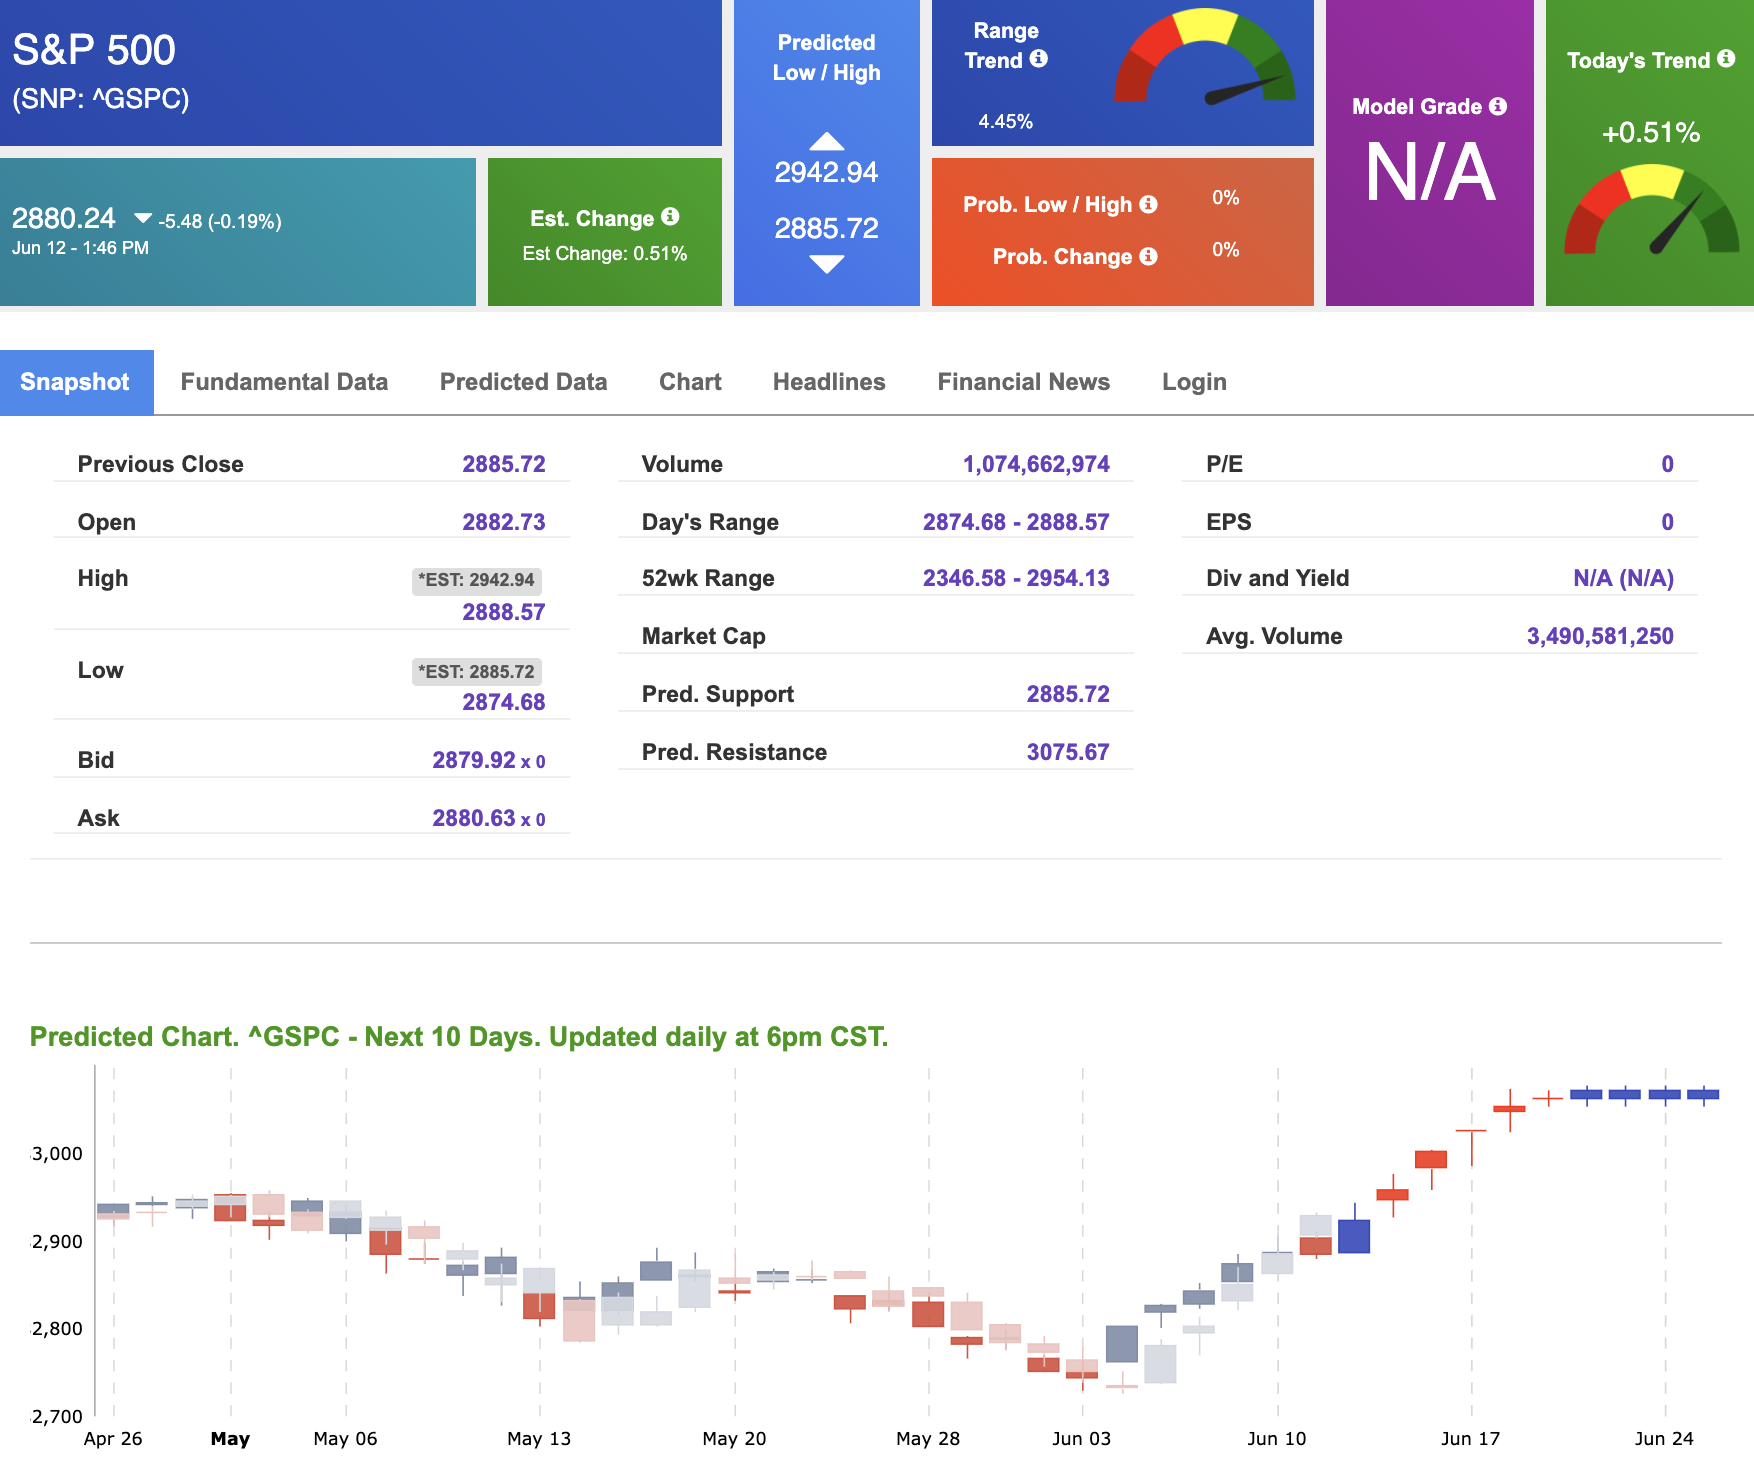
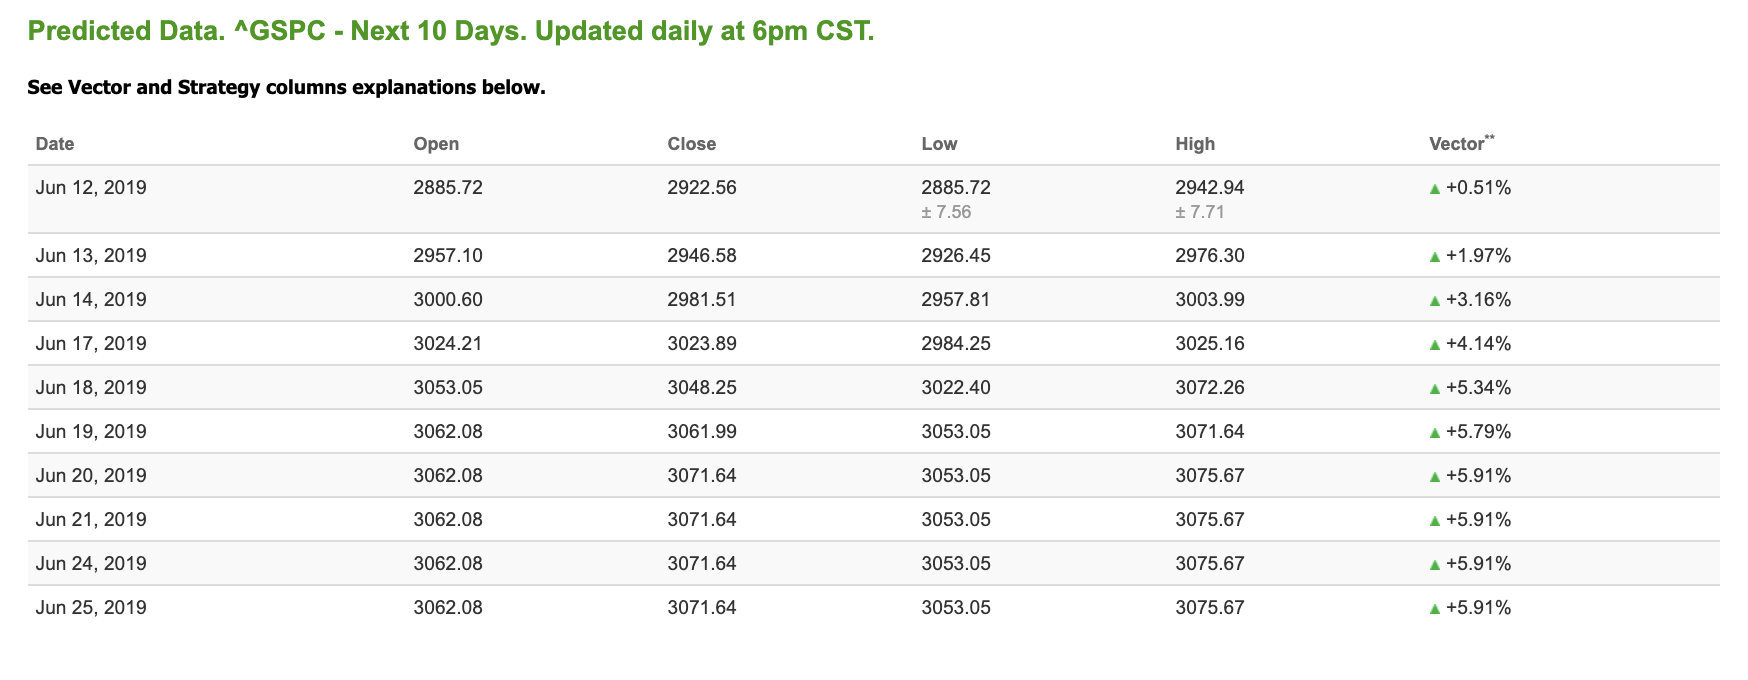
Using the “^GSPC” symbol to analyze the S&P 500, our 10-day prediction window shows positive signals. Today’s vector figure of +0.51% moves to +5.79% in five trading sessions. Prediction data is uploaded after the market close at 6pm, CST. Today’s data is based on market signals from the previous trading session.
* NEW: Vlad’s Portfolio Lifetime Membership!
DO AS I DO… AS I DO IT WATCH LIVE AS I WORK THE MARKETS AND DO IT RISK-FREE!
Click Here to Sign Up
HIGHLIGHT OF A RECENT WINNING TRADE
On June 5th, our ActiveTrader service produced a bullish recommendation for Under Armour Inc (UAA). ActiveTrader is included in all paid Tradespoon membership plans and is designed for day trading.
Trade Breakdown
UAA entered its forecasted Strategy B Entry 1 price range $24.70 (± 0.16) in its first hour of trading and passed through its Target price $24.95 in the second hour of trading that day. The Stop Loss price was set at $24.45.

THURSDAY MORNING FEATURED SYMBOL
*Please note: At the time of publication we do not own the featured symbol, PEP. Our featured symbol is part of your free subscription service. It is not included in any paid Tradespoon subscription service. Vlad Karpel only trades his own personal money in paid subscription services. If you are a paid subscriber, please review your Premium Member Picks, ActiveTrader or MonthlyTrader recommendations. If you are interested in receiving Vlad’s personal picks, please click here.
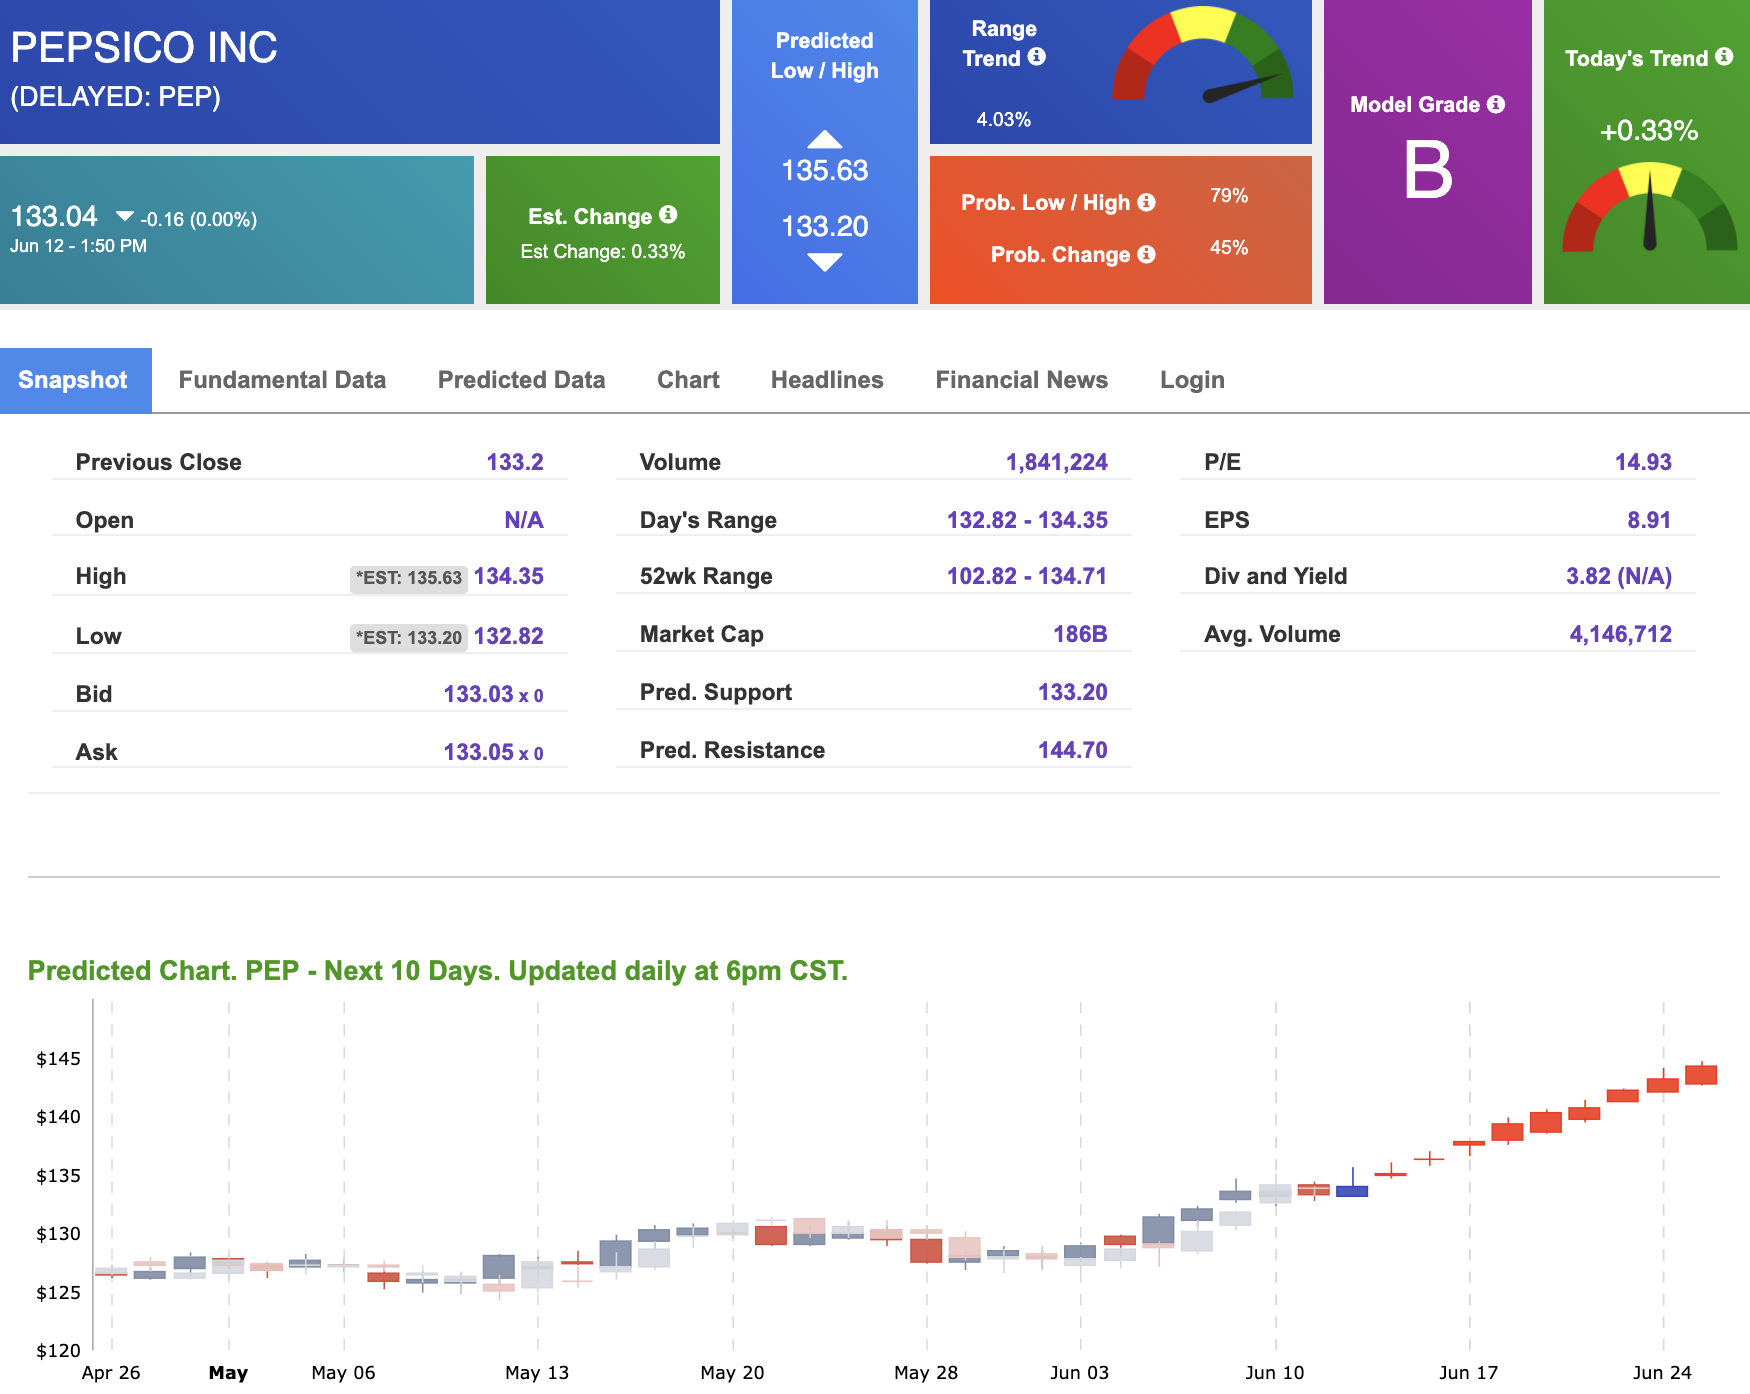
Our featured symbol for Thursday is PepsiCo Inc. (PEP). PEP is showing a confident vector trend in our Stock Forecast Toolbox’s 10-day forecast. This stock is assigned a Model Grade of (B) indicating it ranks in the top 25th percentile for accuracy for predicted support and resistance, relative to our entire data universe.
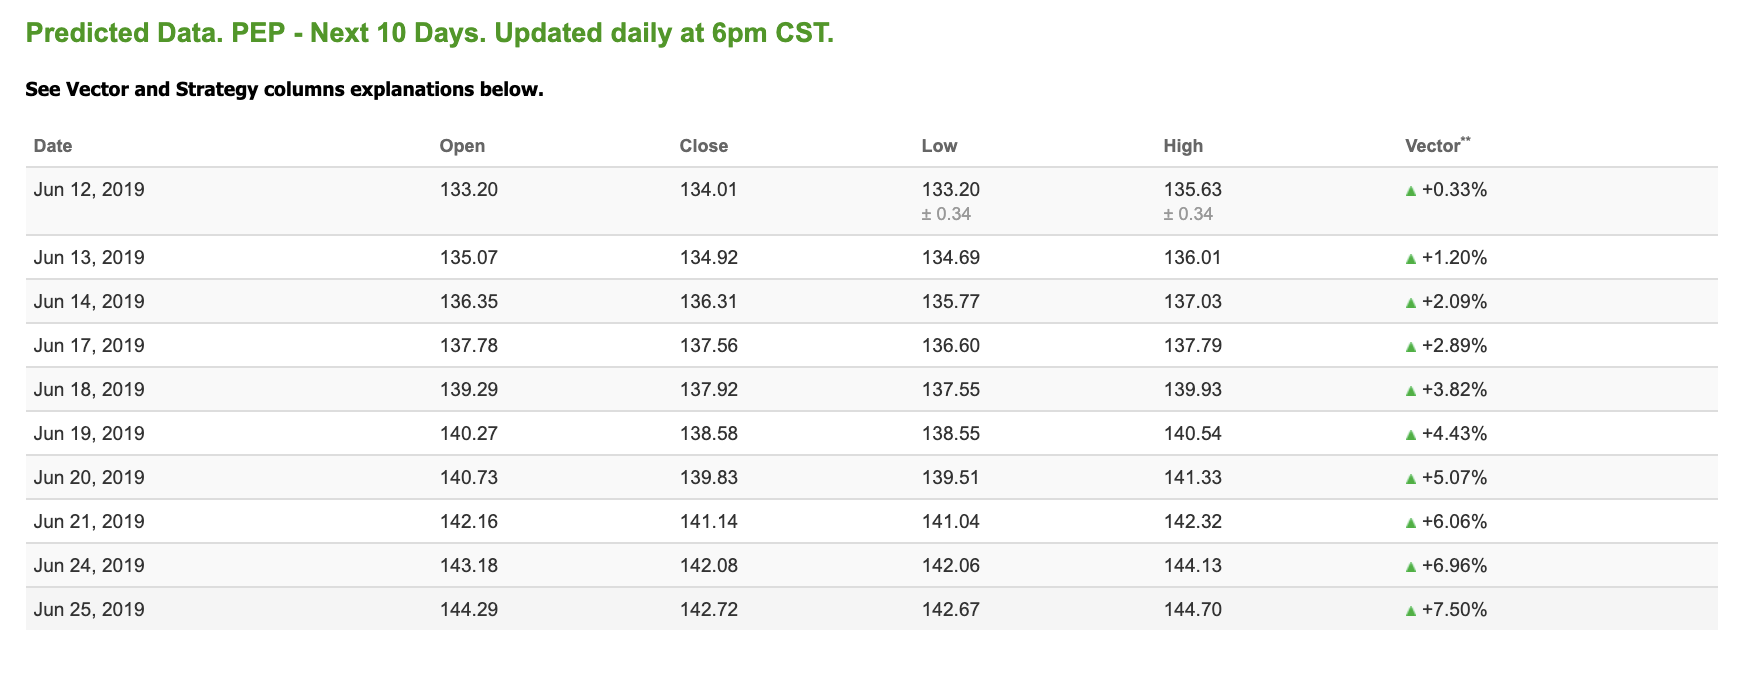
The stock is trading at $133.04 at the time of publication, with a +0.33% vector figure.
Prediction data is uploaded after market close at 6 p.m., CST. Today’s data is based on market signals from the previous trading session.
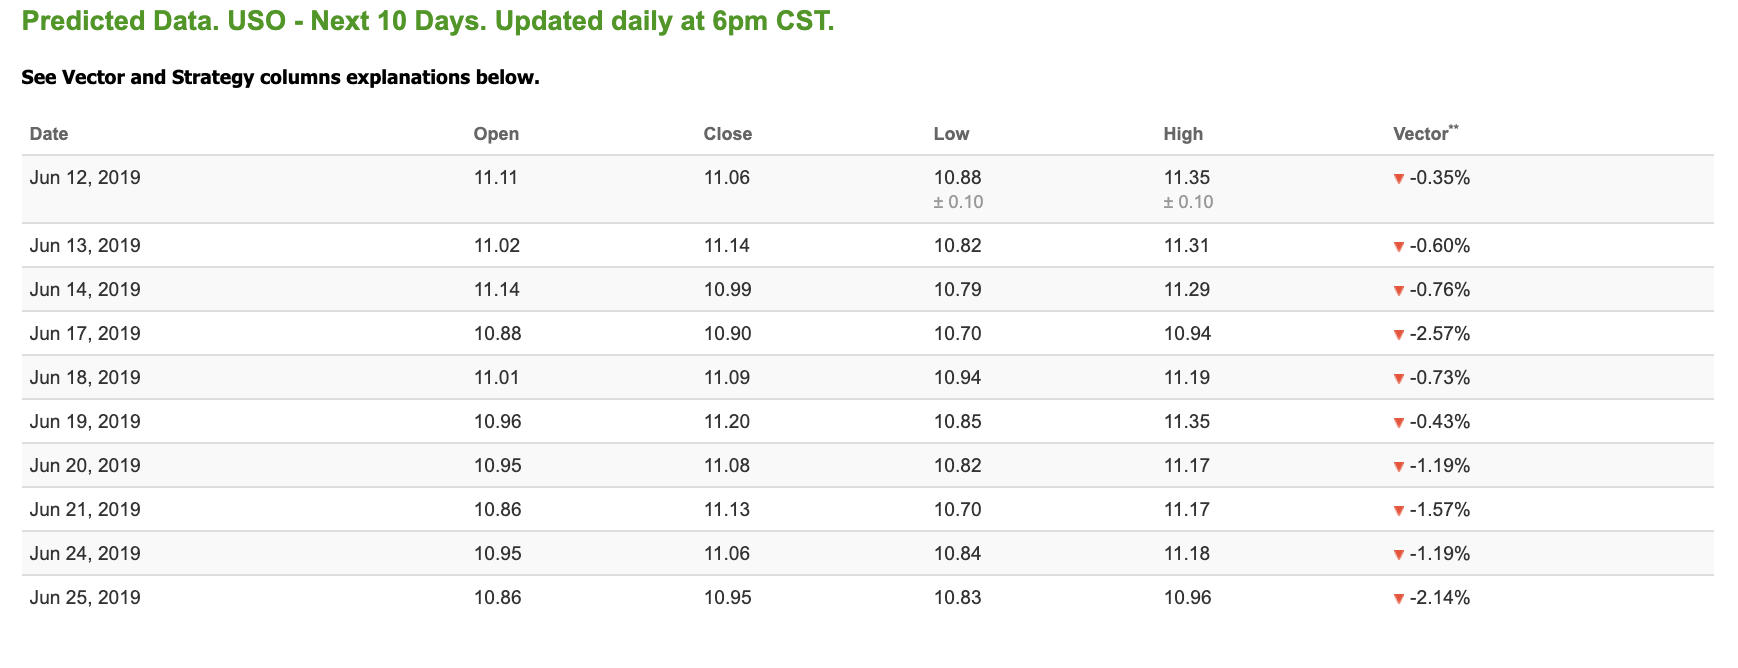
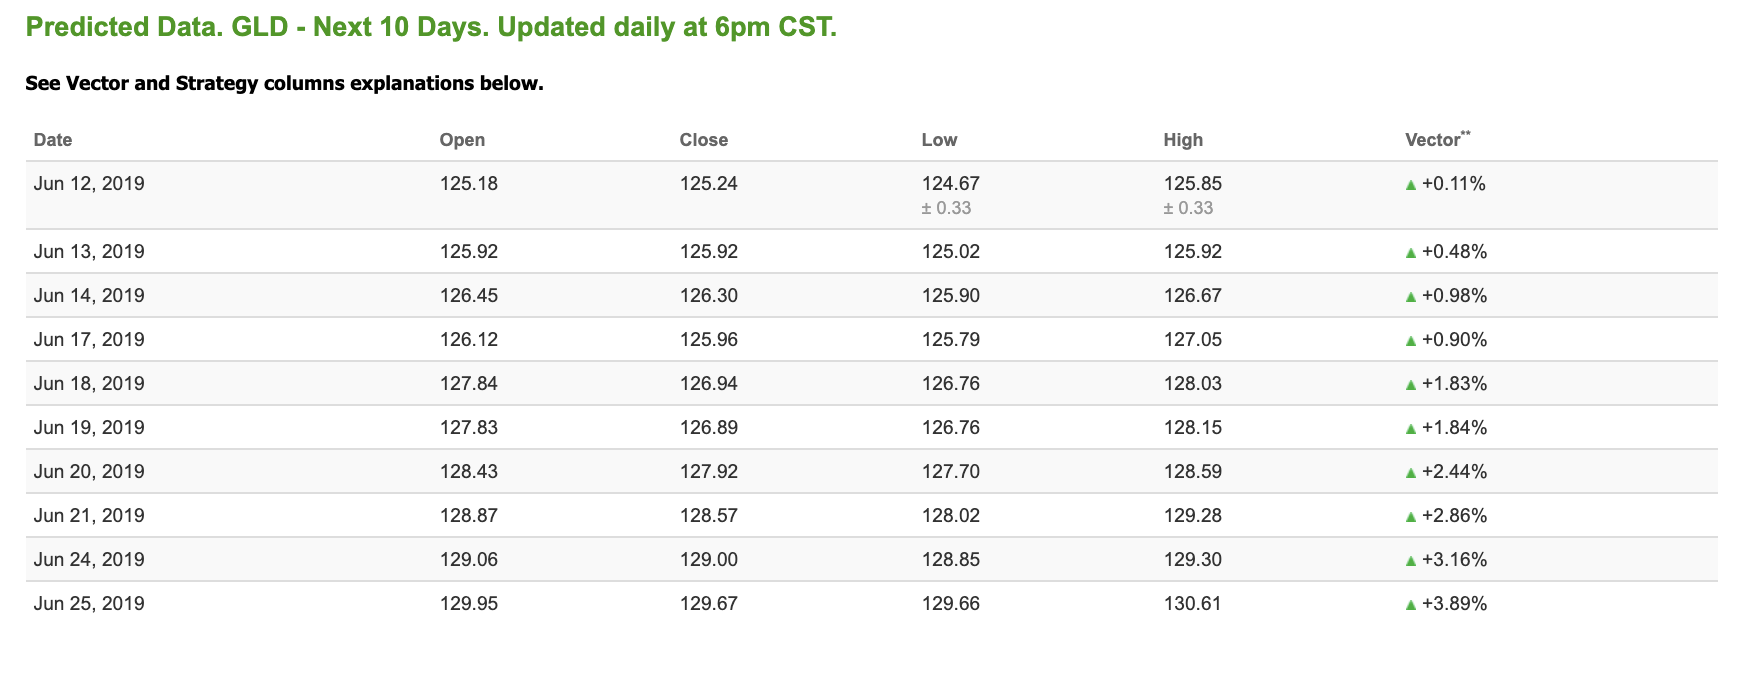
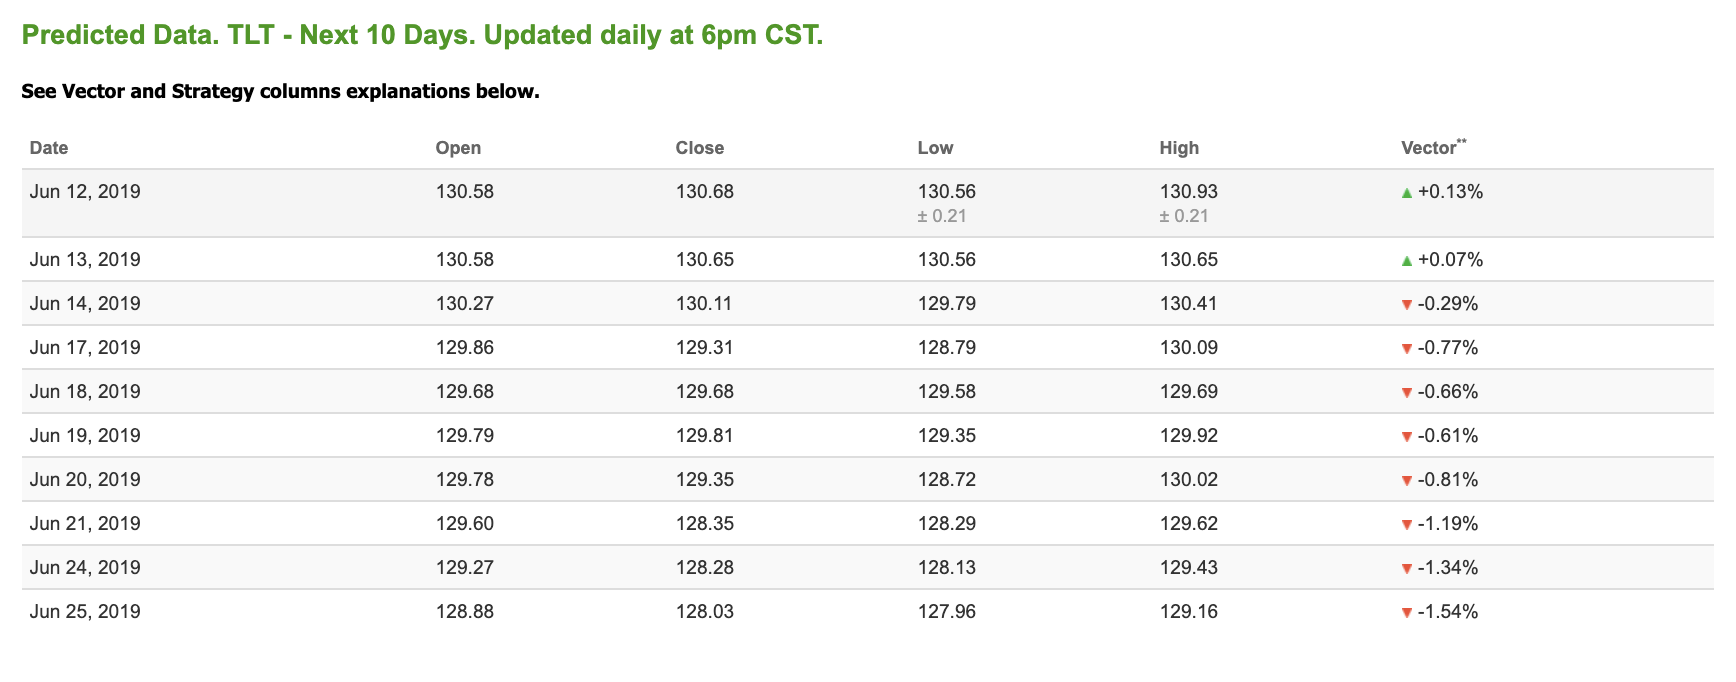
Note: The Vector column calculates the change of the Forecasted Average Price for the next trading session relative to the average of actual prices for the last trading session. The column shows expected average price movement “Up or Down”, in percent. Trend traders should trade along the predicted direction of the Vector. The higher the value of the Vector the higher its momentum.
OIL
West Texas Intermediate for Crude Oil delivery (CL.1) is priced at $51.04 per barrel, down 4.17% from the open, at the time of publication.
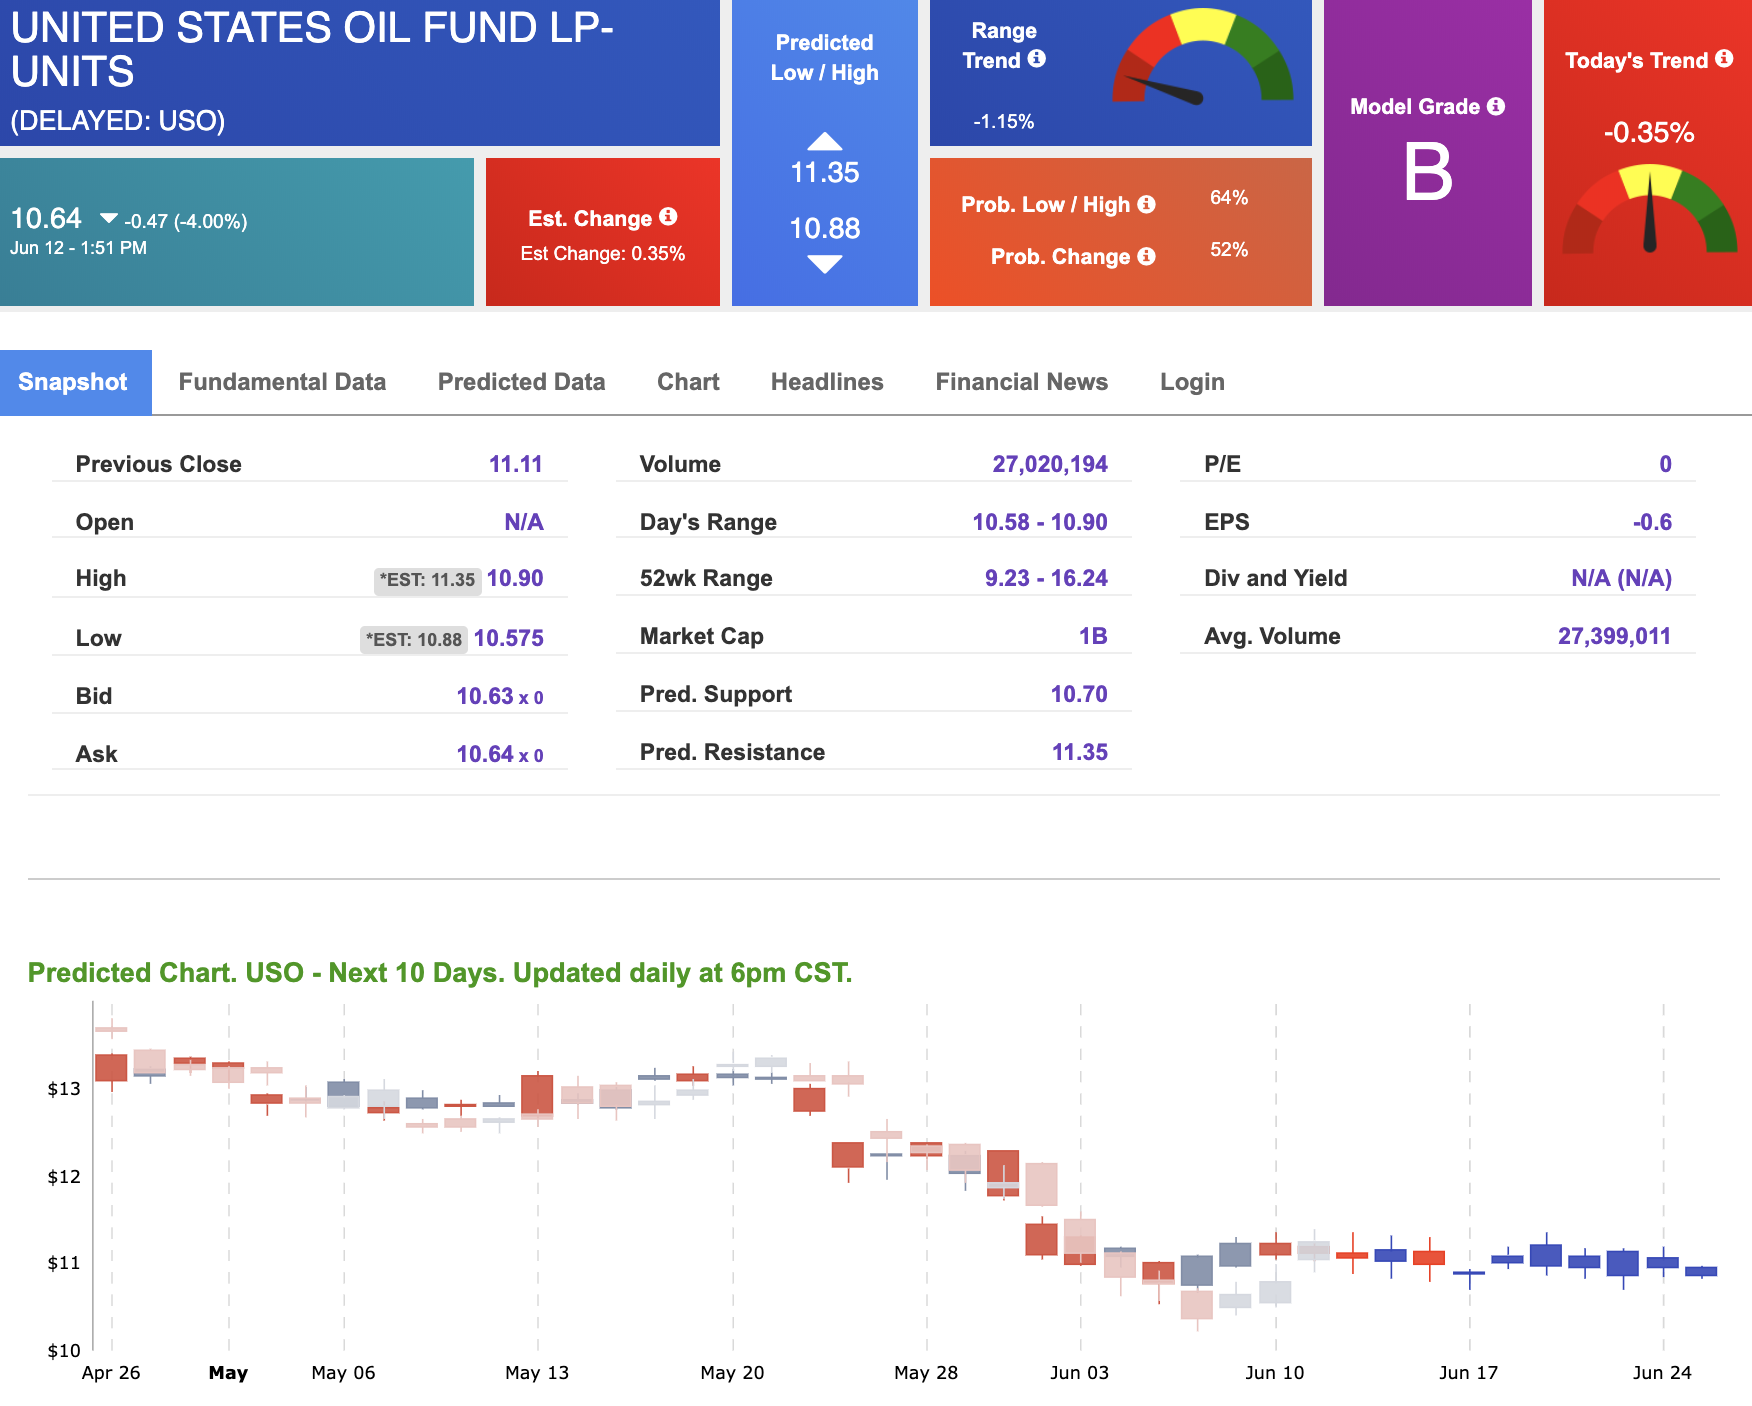
Looking at USO, a crude oil tracker, our 10-day prediction model shows negative signals. The fund is trading at $10.64 at the time of publication, down 4.00% from the open. Vector figures show -0.35% today, which turns -0.43% in five trading sessions. Prediction data is uploaded after market close at 6 p.m., CST. Today’s data is based on market signals from the previous trading session.
GOLD
The price for the Gold Continuous Contract (GC00) is up 0.40% at $1,336.50 at the time of publication.
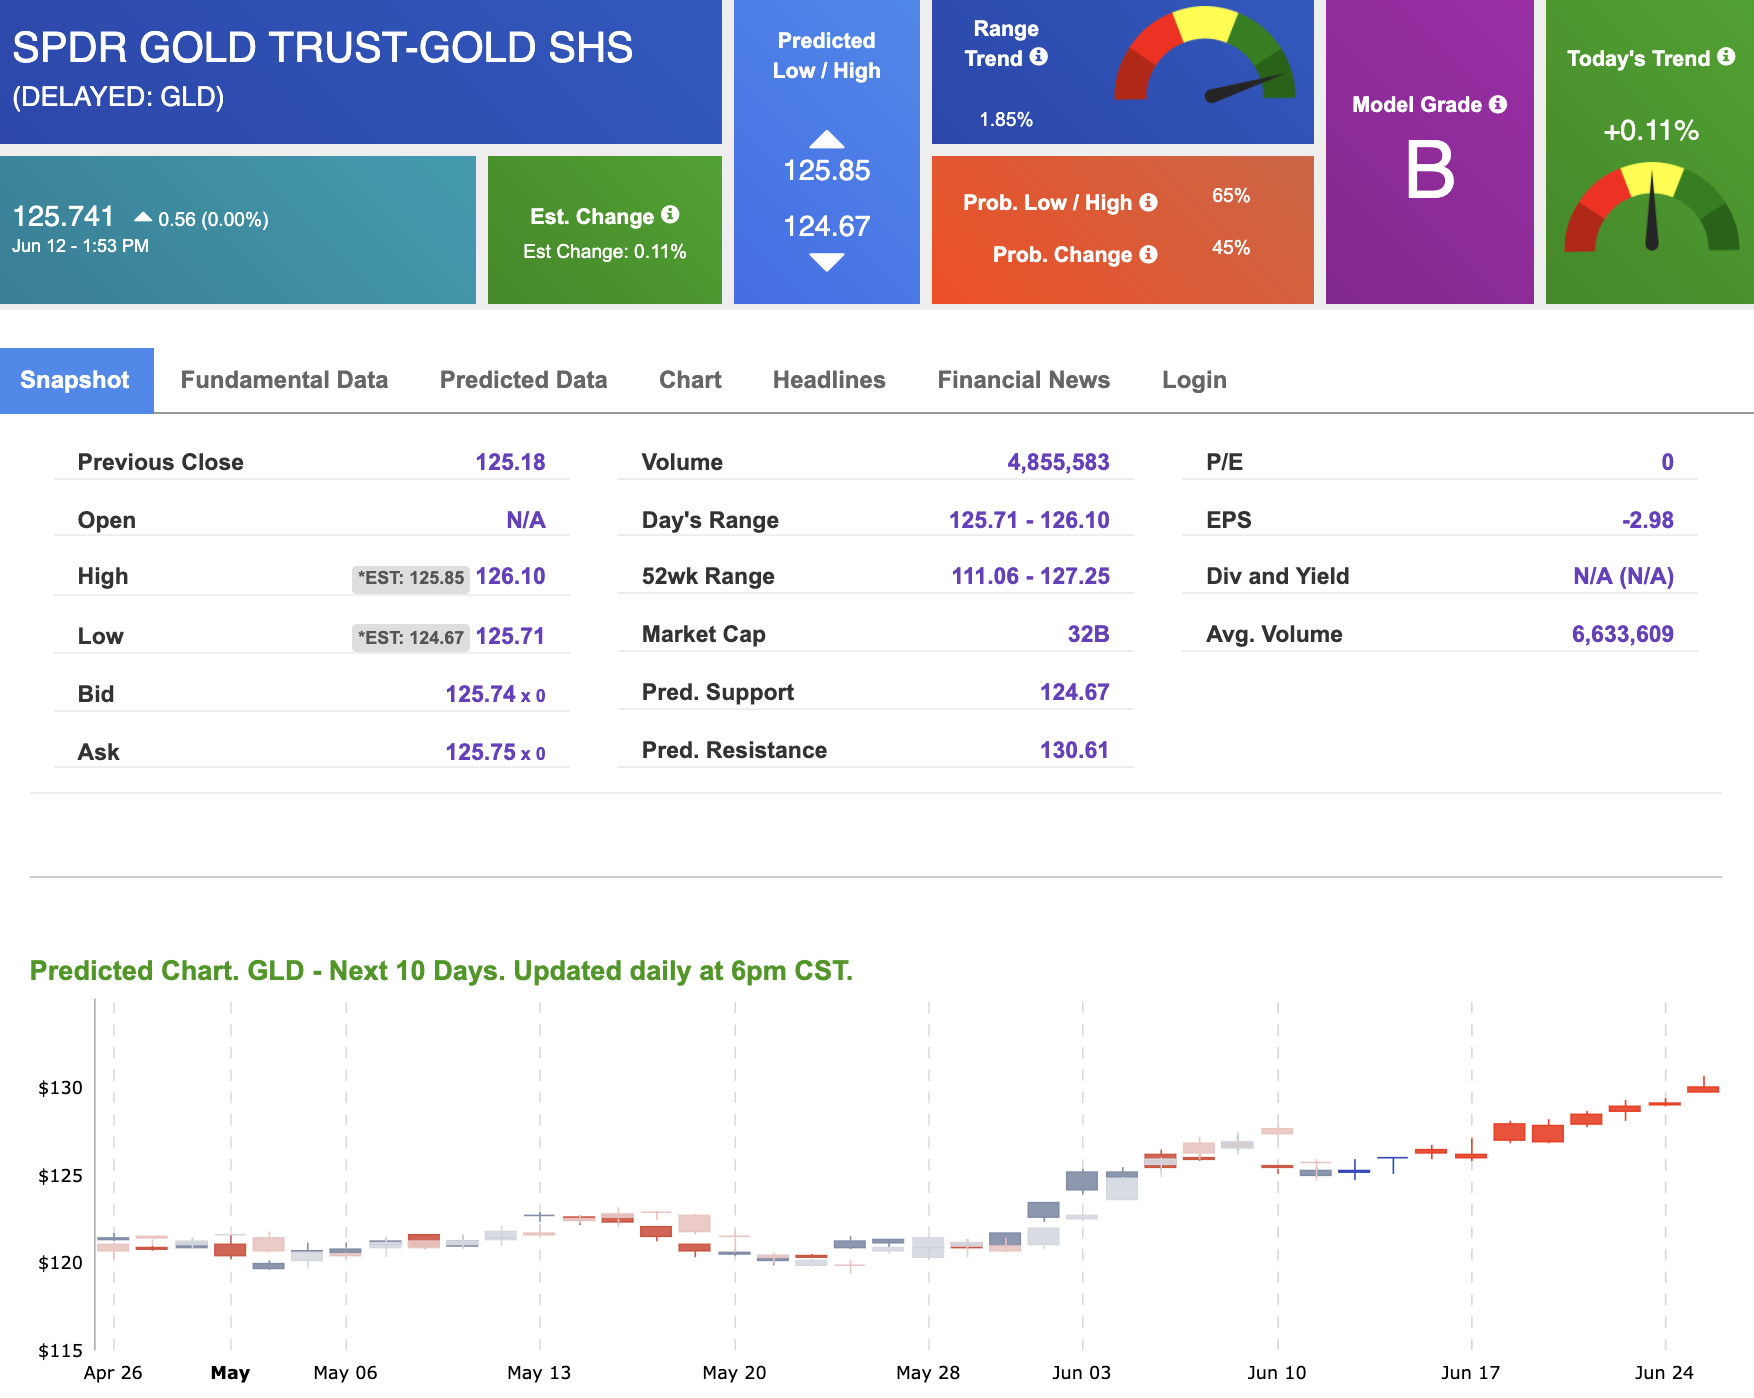
Using SPDR GOLD TRUST (GLD) as a tracker in our Stock Forecast Tool, the 10-day prediction window shows positive signals. The gold proxy is trading at $125.74 at the time of publication. Vector signals show +0.11% for today. Prediction data is uploaded after market close at 6 p.m., CST. Today’s data is based on market signals from the previous trading session.
(Want free training resources? Check our our training section for videos and tips!)
TREASURIES
The yield on the 10-year Treasury note is down 0.65% at 2.13% at the time of publication. The yield on the 30-year Treasury note is up 0.41% at 2.62% at the time of publication.
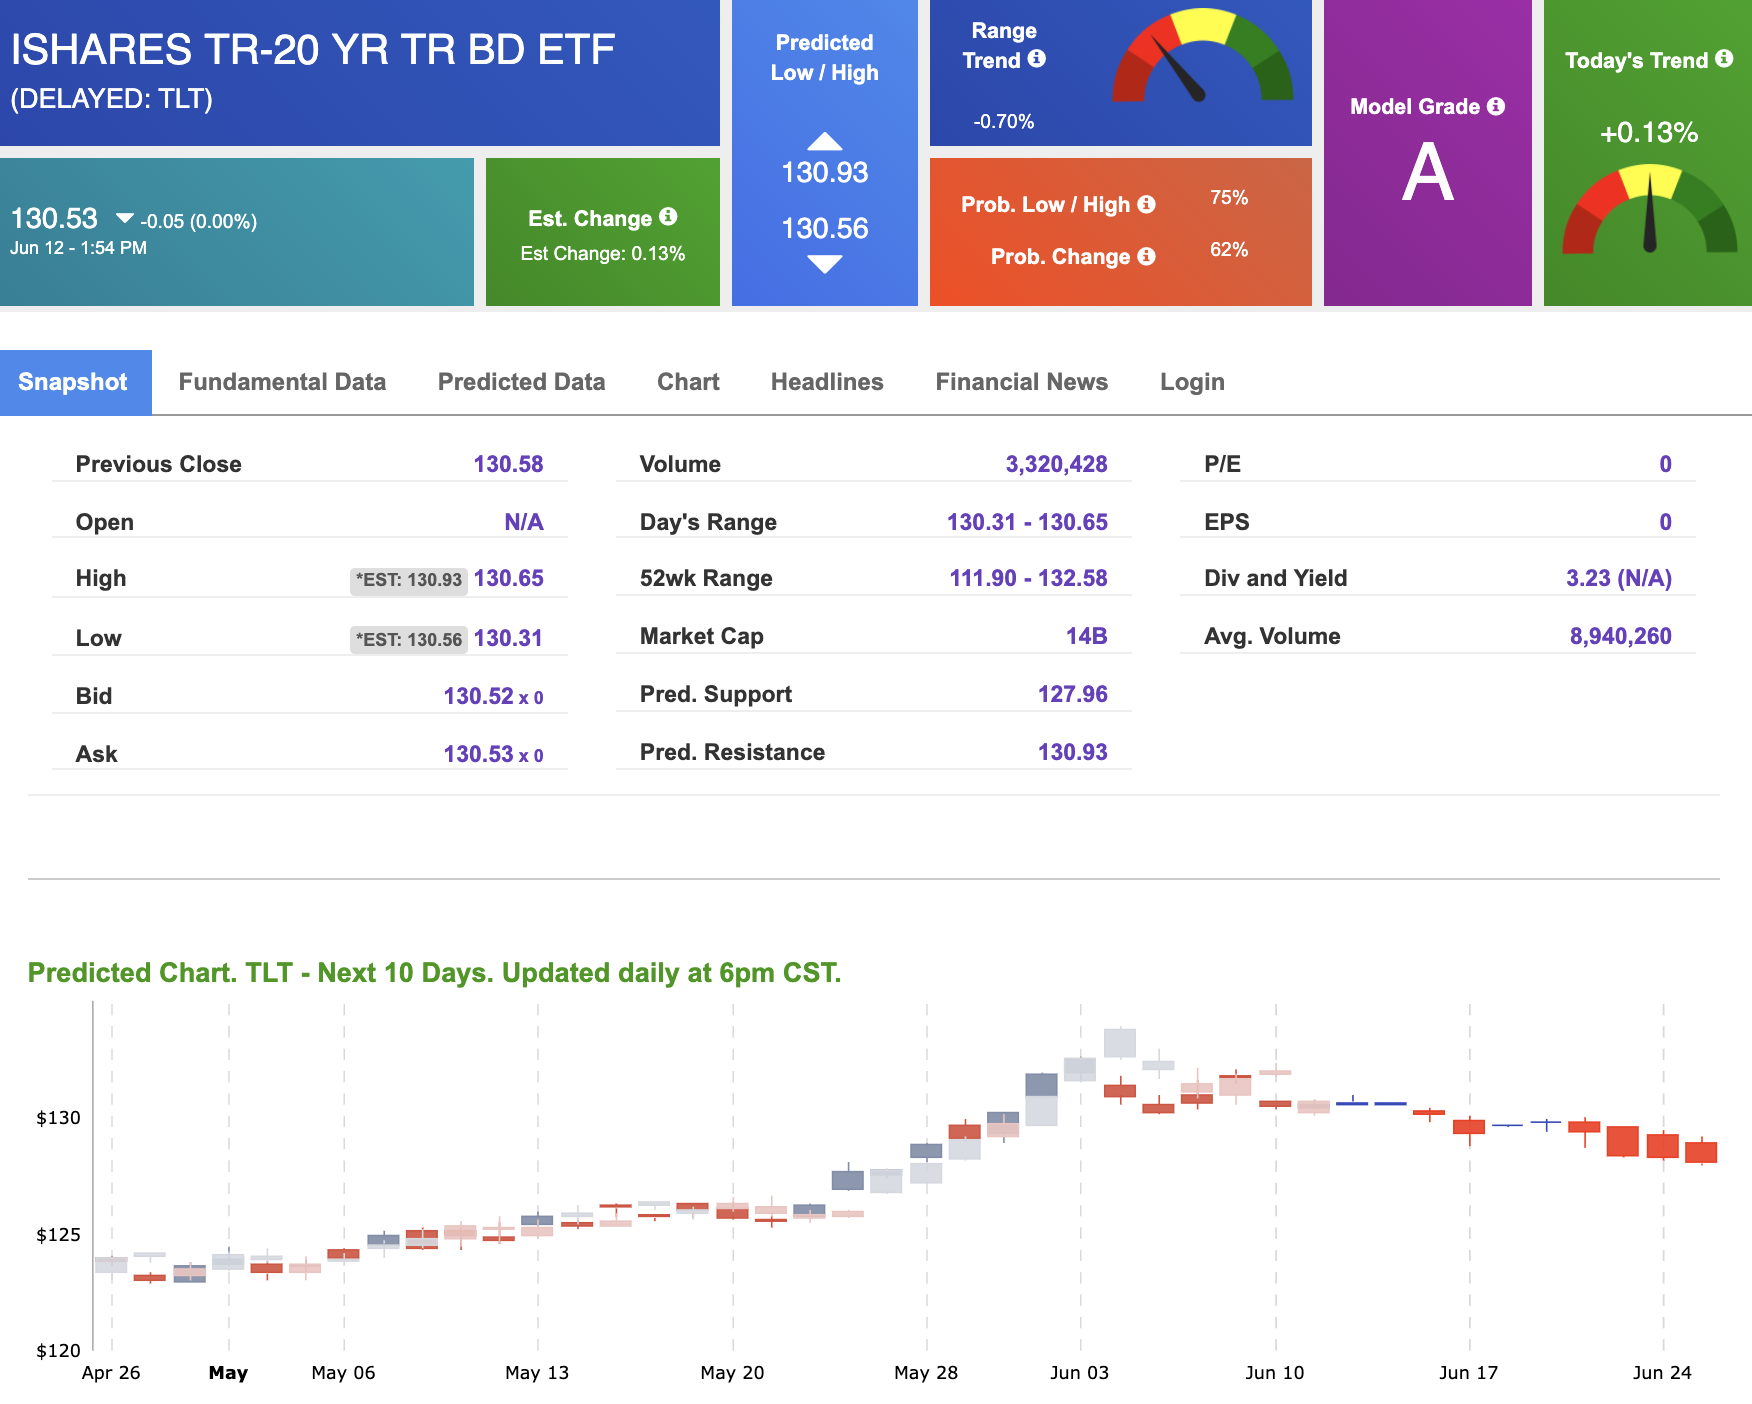
Using the iShares 20+ Year Treasury Bond ETF (TLT) as a proxy for bond prices in our Stock Forecast Tool, we see mixed signals in our 10-day prediction window. Today’s vector of +0.13% moves to -0.77% in three sessions. Prediction data is uploaded after market close at 6 p.m., CST. Today’s data is based on market signals from the previous trading session.
(Want free training resources? Check our our training section for videos and tips!)
VOLATILITY
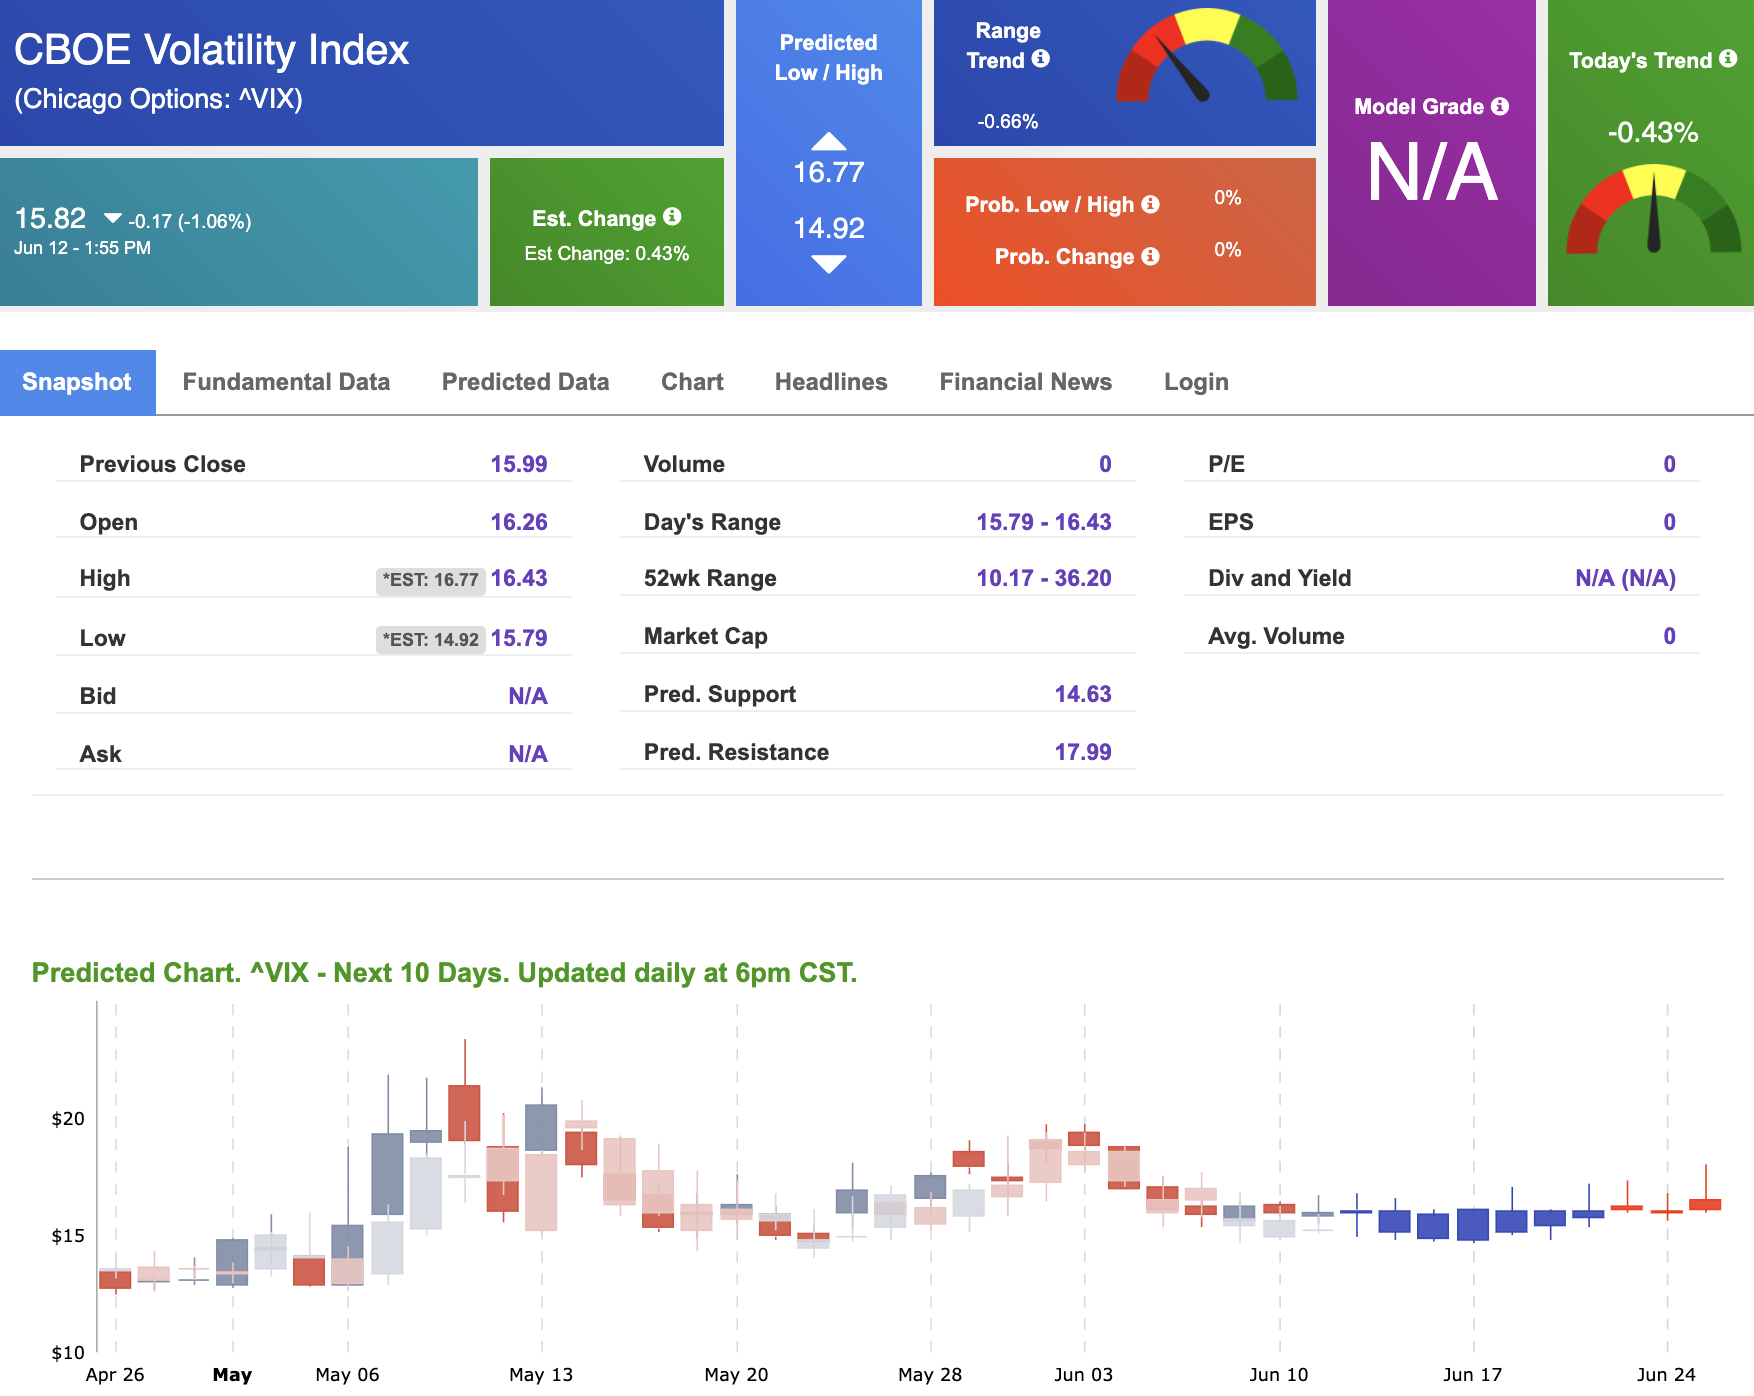
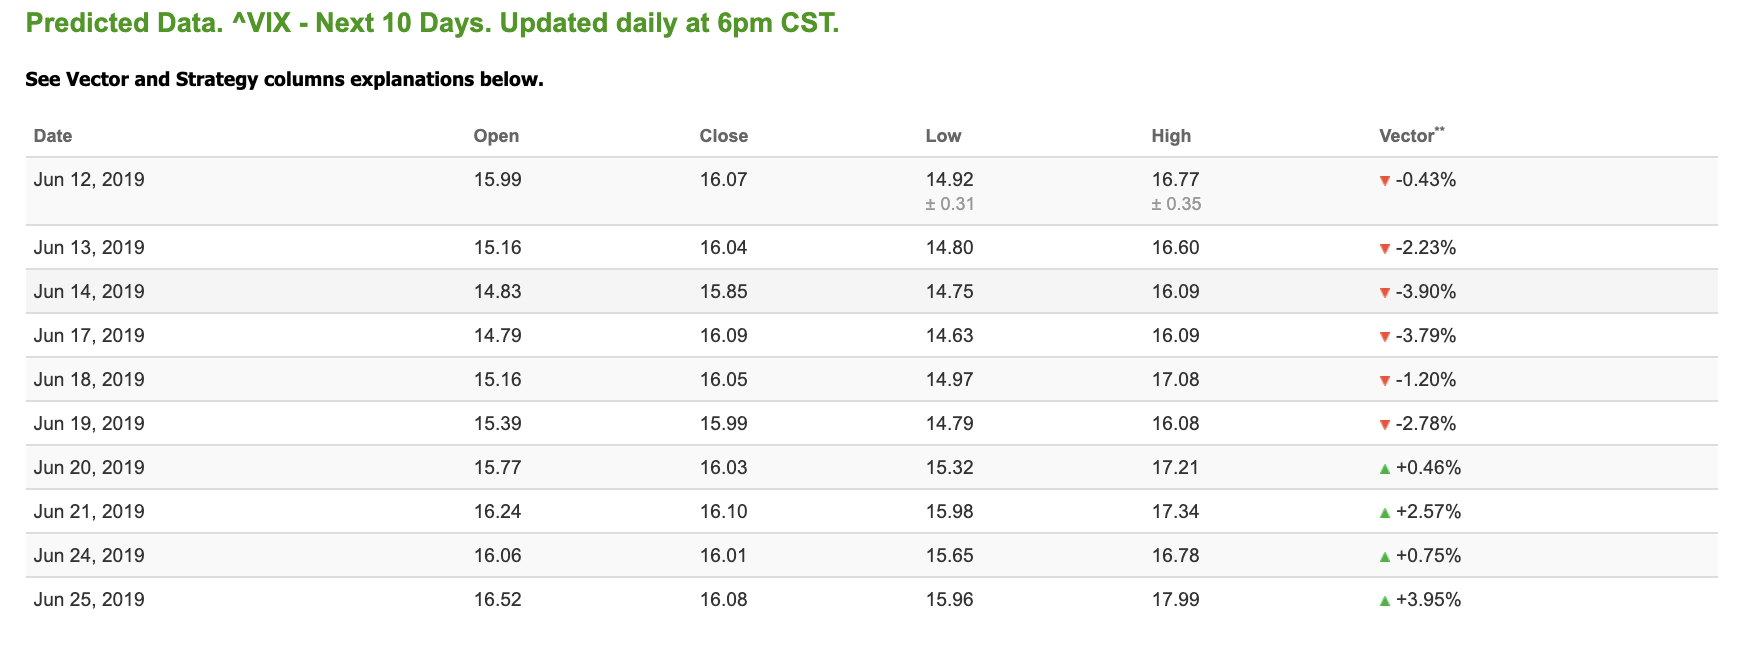
The CBOE Volatility Index (^VIX) is down 1.06% at $15.82 at the time of publication, and our 10-day prediction window shows mixed signals. The predicted close for tomorrow is $16.04 with a vector of -2.23%. Prediction data is uploaded after market close at 6 p.m., CST. Today’s data is based on market signals from the previous trading session.
