Markets Revisit Trade Tensions and Look To Data for Stability
Underwhelming data on U.S. manufacturing activity
Market anxieties around trade, global growth and the deepening of the yield-curve inversion are revisited after investors see underwhelming data on U.S. manufacturing activity.
Tariffs on Mexican imports
In the newest development in U.S. trade relations with other nations- President Trump made a surprise announcement last week to install escalating tariffs on Mexican imports until he and his administration believe that Mexico has addressed the flow of migrants into the U.S.
Trade issues make impact on markets
Mexico has indicated willingness to participate in negotiations with the U.S. on trade issues, although the impact is still weighing on markets.
Rhetorical draw down on U.S./China situation
News from the U.S./China situation is seeing a rhetorical draw down with Chinese Vice Commerce Secretary Wang Shouwen saying on Sunday that China is “… willing to adopt a cooperative approach to find a solution,” –reported by The Wall Street Journal.
A white paper released from the Chinese government
A white paper was simultaneously released from the Chinese government, which doubled down on demands that additional tariffs be lifted before new talks can begin.
Inversion of the yield curve leads to recession
Investors are worried about the inversion of the yield curve- that is the measure of the difference between long-dated and short-dated bond yields- because it has historically preceded recessions save for two false-positives in 1966 and 1998.
European and German bond-yields drive down in negative territory
The ripple effect has extended to European bonds as well as German bonds- both seeing yields drive down in negative territory as investors abroad choose flight to safe-haven assets like government paper.
(Want free training resources? Check our our training section for videos and tips!)
Manufacturing PMI shows 52.1% lower than expected 52.6%
In economic news- the manufacturing PMI reading from the Institute for Supply Management was released, showing 52.1% for May, compared to an April reading of 52.8%. The May reading came in under an expected 52.6% figure.
Construction-spending fall 1.7% in March
Commerce Department readings from Thursday saw construction-spending fall 1.7% in March.
Google shares 6.15% down on possible DOJ investigation
In focus today is Alphabet Inc. (GOOG), trading considerably lower today after reports broke that the Justice Department may investigate the Google parent-company for violations of antirust law. The stock is down 6.15% at the time of publication.
Amazon.com Inc , Netflix and Facebook Inc. in the antirust theme
Extending the antirust theme- Amazon.com Inc. (AMZN), Netflix (NFLX) and Facebook Inc. (FB)seem to be trading lower today around speculation that these companies may see the same scrutiny as Alphabet as part of a broader probe into major tech companies.
(Want free training resources? Check our our training section for videos and tips!)
El Paso Electric Co. shares up 14.30% on acquisition news
In M&A news- Utilities stock El Paso Electric Co. (EE)leaped 14.30% today on the announcement that JPMorgan’s Infrastructure Investments Fundwill be acquiring it in a $4.3 billion deal. Cypress Semiconductor Corp. (CY)rocketed 24.61% following news that Infineon Technologies AG (IFX)will acquire it in a $10.1 billion deal.
President Trump’s U.K visit in focus
Going forward, investors will again be more sensitive to headlines and parsing commentary coming from President Trump’s U.K. visit, and will continue monitoring investment activity abroad to gauge the scale of fear around trade and global slowdowns in growth.
Employment figures for the U.S. jobs market are upcoming
Employment figures for the U.S. jobs market are upcoming, as well as another batch of economic data. A strong jobs report can work to offset market turbulence but may be overshadowed in the public eye if trade tensions with China and Mexico are still inflamed.
(Want free training resources? Check our our training section for videos and tips!)
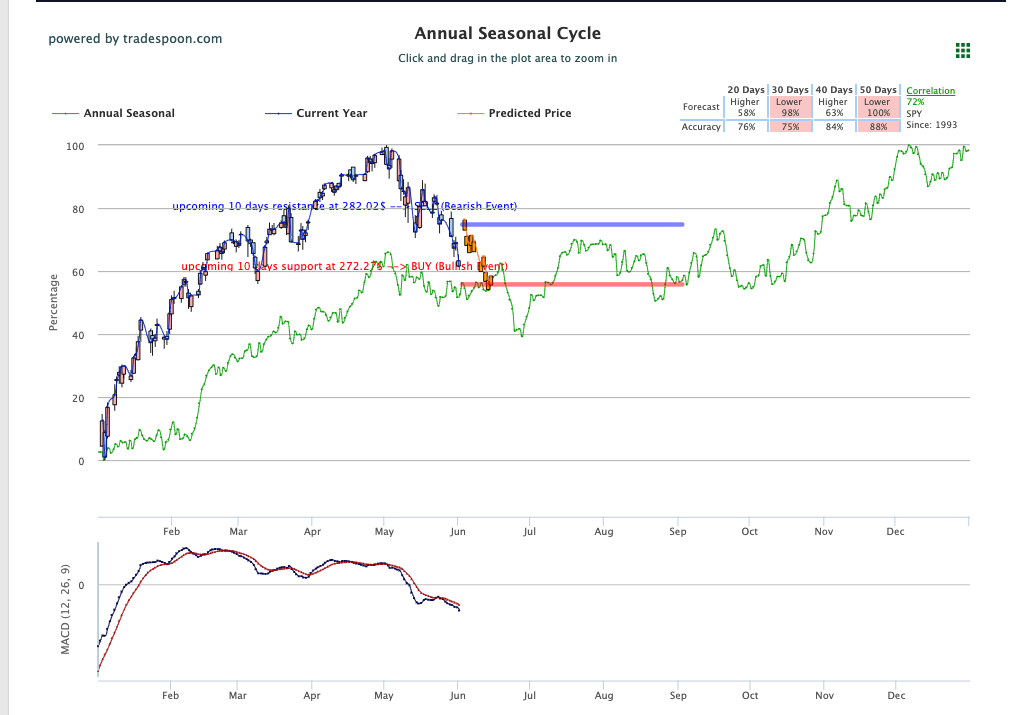
SPY Seasonal Chart
The market- gauged by the SPY- broke the 200 days MA at $276 and we can expect more volatility as long as the market trades below $280. For reference, the SPY Seasonal Chart is shown below:
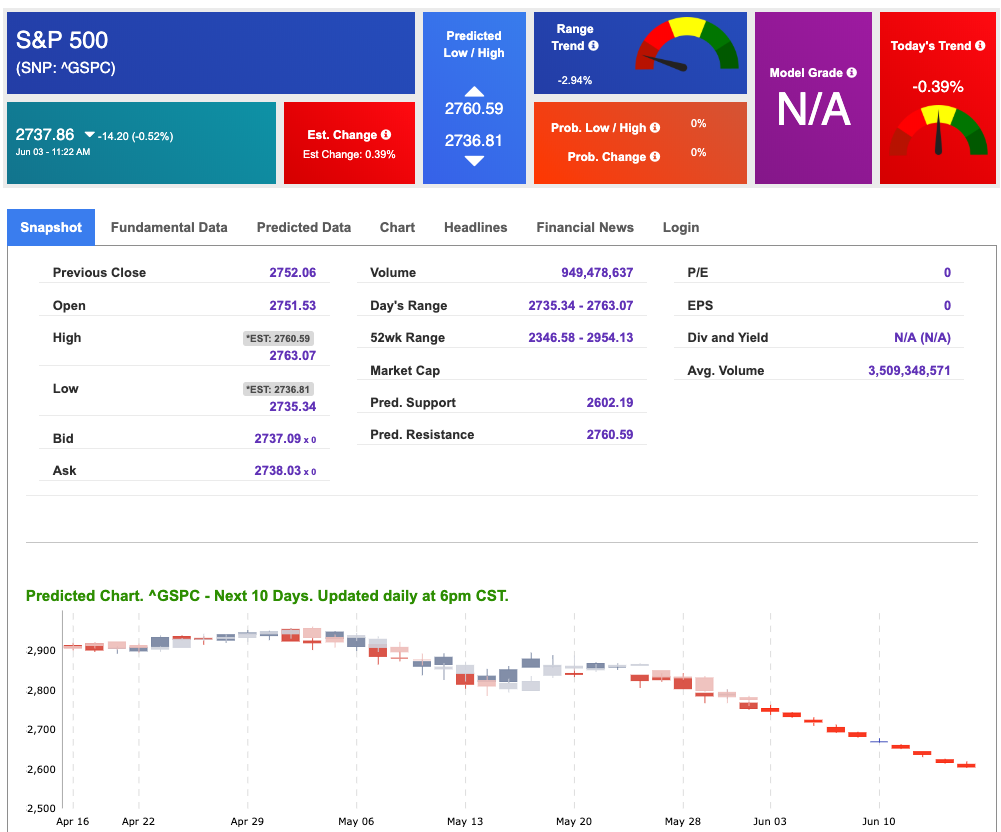
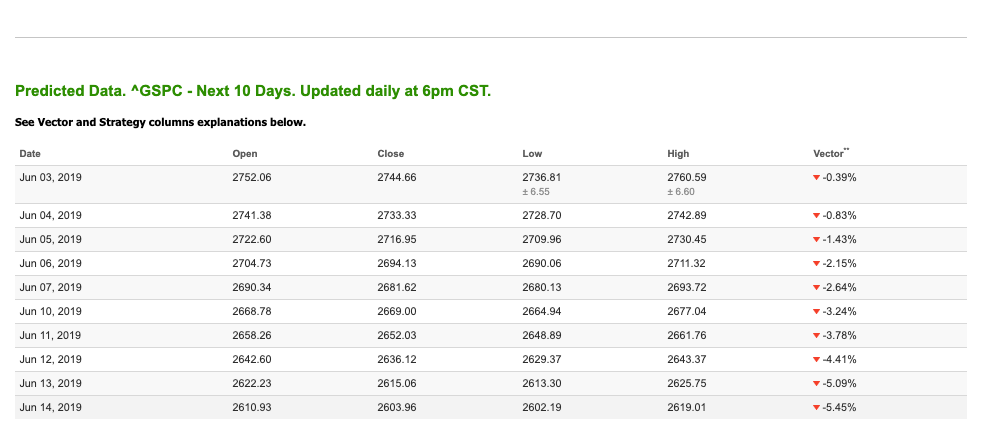
10-day prediction window shows near-term negative signals
Using the “^GSPC” symbol to analyze the S&P 500, our 10-day prediction window shows near-term negative signals. Today’s vector figure of +0.39% registers as neutral/negative. The average vector weighting for the 10-day forecast is to the downside. At the time of publication, the index is trading just above today’s predicted low of 2,736.81 at 2737.86. Prediction data is uploaded after the market close at 6pm, CST. Today’s data is based on market signals from the previous trading session.
(Want free training resources? Check our our training section for videos and tips!)
74.7% Success Rate!
Actual Returns… 1244.2%!
Even in this wild market, you can do it too.
This no-risk trial will empower you with the same incredible volatility tested “tools” I use to trade my own money!
Click Here to Learn More
Highlight of a Recent Winning Trade
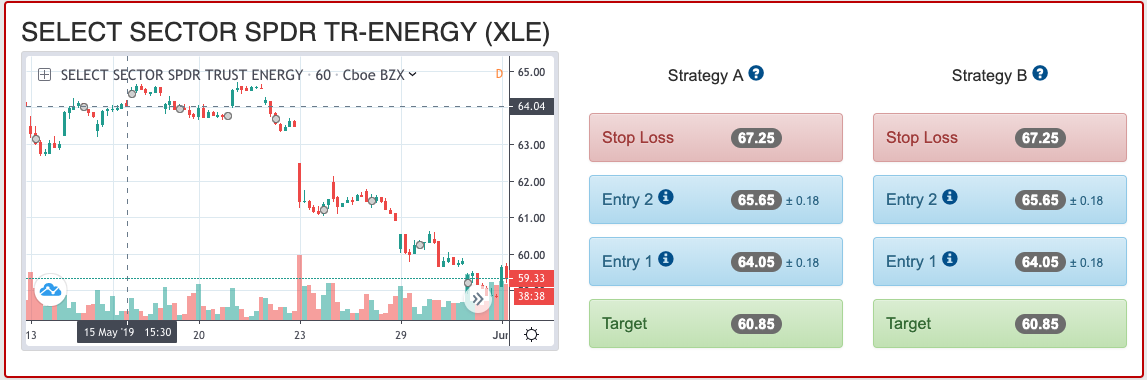
On May 13th, our MonthlyTrader service produced a bearish recommendation for the Energy Select Sector SPDR ETF (XLE). MonthlyTrader is available as a standalone subscription service or included in Tradespoon’s Tools, Premium and Elite Trading Circle membership plans. MonthlyTrader is designed for 5-20 day positions for stocks and single options.
Trade Breakdown
XLE entered its forecasted Strategy B Entry 1 price range of $64.05 (± 0.18)on Wednesday, 5/15 and hit its Target price of $60.85in premarket trading Wednesday, 5/29. The Stop Loss price was set at $67.25.
Tuesday Morning Featured Symbol
*Please note: Our featured stock is part of your free subscription service. It is not included in any paid Tradespoon subscription service. Vlad Karpel only trades his own personal money in paid subscription services. If you are a paid subscriber, please review your Premium Member Picks, ActiveTrader or MonthlyTrader recommendations. If you are interested in receiving Vlad’s personal picks,please click here.
(Want free training resources? Check our our training section for videos and tips!)
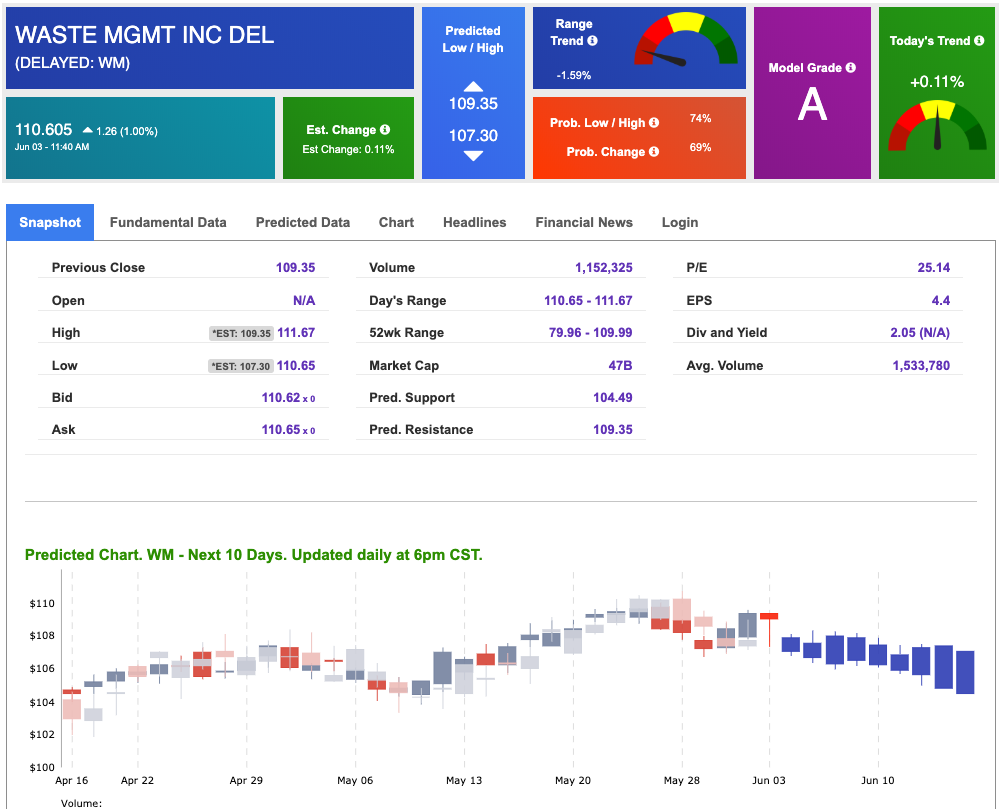

WM is showing positive outlook in our Stock Forecast Toolbox’s current-day prediction
Our featured symbol for Tuesday is Waste Management Inc. (WM).WM is showing positive outlook in our Stock Forecast Toolbox’s current-day prediction. This stock is assigned a Model Grade of (A)indicating it ranks in the top 10th percentile for accuracyfor current-day predicted support and resistance, relative to our entire data universe.
The stock has broken its predicted current-day resistance
The stock has broken its predicted current-day resistance, and has out-performed the market with a 1% gain at the time of publication. The 10-day prediction was created Friday after market close, and will update tonight with revised figures for the near-term. Stay tuned for more direction in our next Market Commentary issue as this symbol will be sensitive to changing news and developments.
The stock is trading at $29.14 at the time of publication, down 2.00% from the open with a -0.71% vector figure.
(Want free training resources? Check our our training section for videos and tips!)
Prediction data is uploaded after market close at 6 p.m., CST. Today’s data is based on market signals from the previous trading session.
Note: The Vector column calculates the change of the Forecasted Average Price for the next trading session relative to the average of actual prices for the last trading session. The column shows expected average price movement “Up or Down”, in percent. Trend traders should trade along the predicted direction of the Vector. The higher the value of the Vector the higher its momentum.
(Want free training resources? Check our our training section for videos and tips!)
Oil
Oil futures saw positive trading today in an effort to stabilize after hitting their lowest points since February last Friday. Downside pressure is coming from mounting concerns around the state of the global economy and tariff disputes which can negatively impact the global demand for oil. An additional downside factor may come from stronger U.S. output. Upside momentum may come from OPEC production cut news, heightened geopolitical tension and sanctions.
West Texas Intermediate for July delivery (CLN19) is priced at $53.72 per barrel, down 0.07% from the open, at the time of publication.
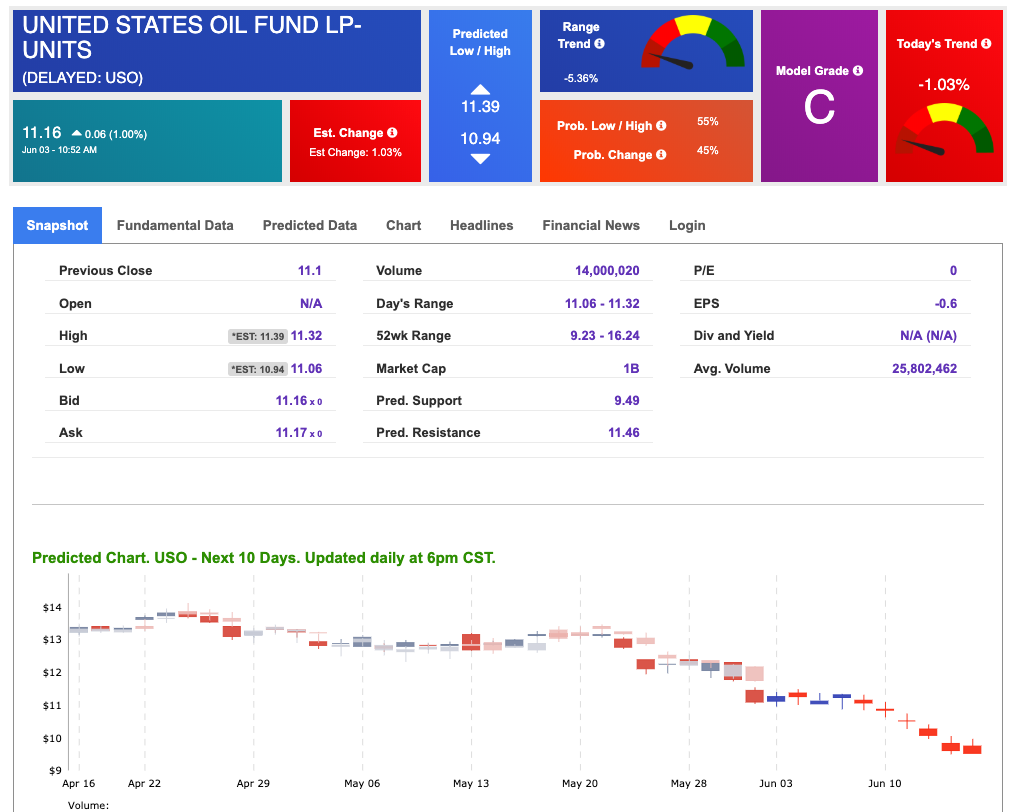
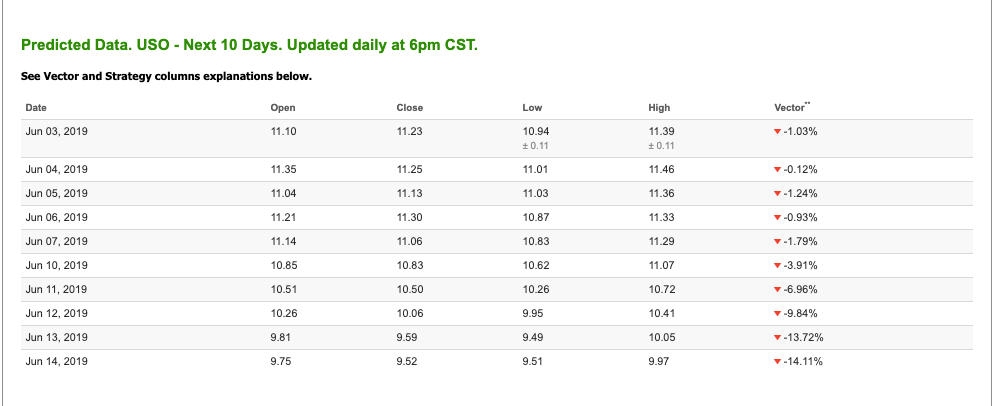
10-day prediction model shows a near-term bearish outlook
Looking at USO, a crude oil tracker, our 10-day prediction model shows a near-term bearish outlook. The fund is trading at $11.10 at the time of publication, down 0.04% from the open. Vector figures show -1.03% today and continue a negative momentum trend in the near-term. Prediction data is uploaded after market close at 6 p.m., CST. Today’s data is based on market signals from the previous trading session.
(Want free training resources? Check our our training section for videos and tips!)
Gold
Gold futures are seeing a rally today with continued flight to safe-haven assets after another injection of risk-off sentiments following developments in global trade disputes which now include Mexico. A weakened U.S. dollar has also contributed to the gold rally. Also recent U.S. manufacturing data which showed May growth at its slowest pace in 2 ½ years. The most-active contract climbed 2.1% last week and was up 2% for the month.
The price for August gold (GCM19) is up 1.07% at $1,317.80 at the time of publication.
(Want free training resources? Check our our training section for videos and tips!)
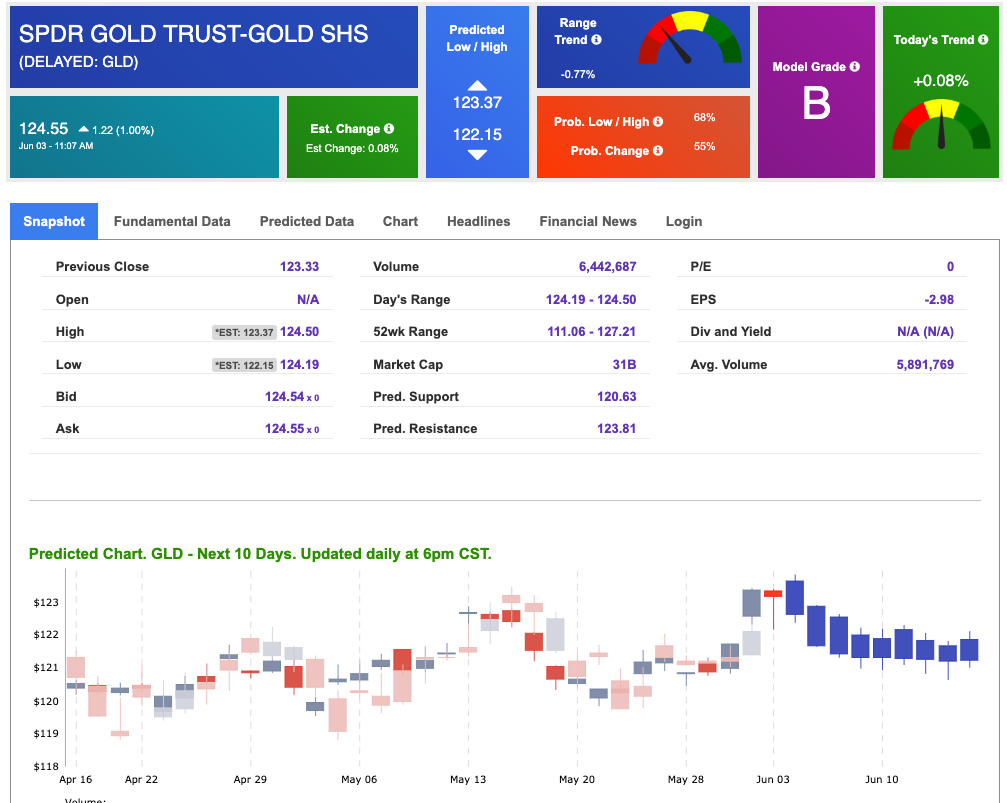
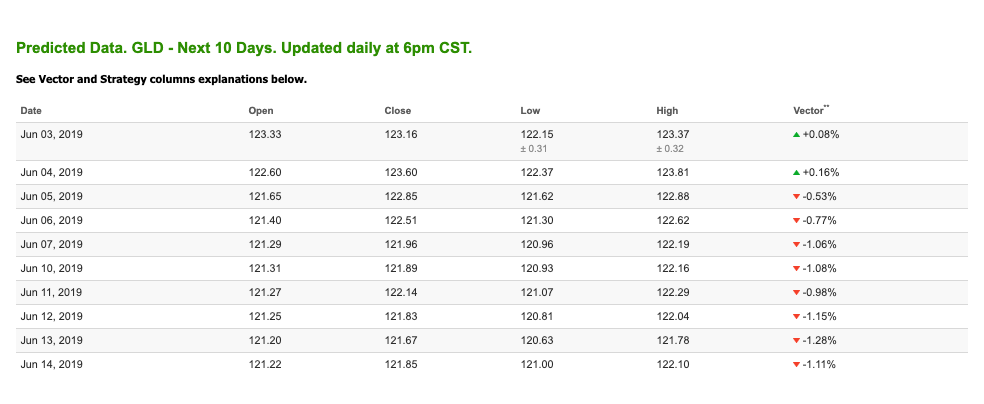
10-day prediction window shows slightly bearish vector signals
Using SPDR GOLD TRUST (GLD) as a tracker in our Stock Forecast Tool, the 10-day prediction window shows slightly bearish vector signals- reflected by the Range Trend meter. The gold proxy is trading at $124.55, up 1.00% at the time of publication. Vector signals show +0.08% for today- which registers as a neutral signal.
The ETF has broken its predicted resistance today
The ETF has broken its predicted resistance today, which is an influence indicator of recent news developments. Prediction data is uploaded after market close at 6 p.m., CST. Today’s data is based on market signals from the previous trading session.
(Want free training resources? Check our our training section for videos and tips!)
Treasuries
Yields are pushing lower today as investors take into account the U.S. administration’s positioning with its global trade partners. China and Mexico are the target of tariffs, there were reports that tariffs on Australian aluminum imports were considered but discarded,. Also the U.S. has also removed India’s status as a developing country which exposes it to tariffs on billions of imports. The yield on the 10-year Treasury note is down 0.98% at 2.11% at the time of publication. The yield on the 30-year Treasury note is down 0.38% at 2.56% at the time of publication.
(Want free training resources? Check our our training section for videos and tips!)
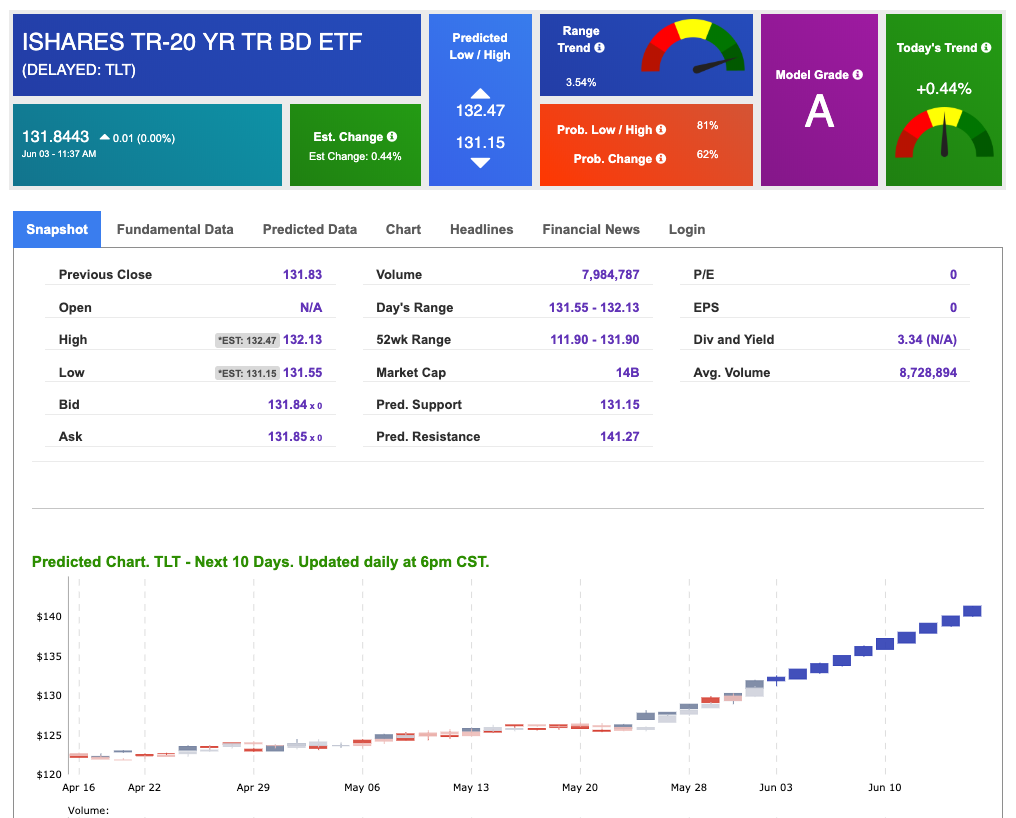
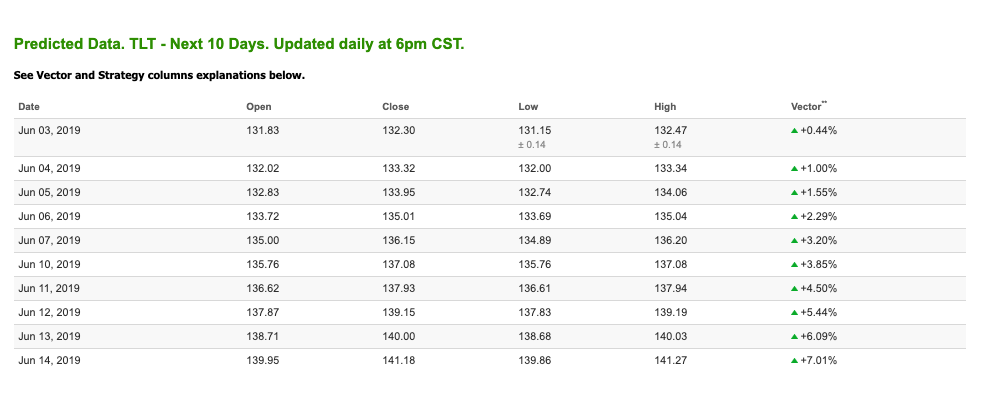
Strong positive near-term signals
Using the iShares 20+ Year Treasury Bond ETF (TLT) as a proxy for long-dated bond prices in our Stock Forecast Tool, we see strong positive near-term signals. Today’s vector of +0.44% registers as neutral/positive and incrementally grows each day in the forecast- which is a strong bull signal. Investors should keep tabs on headlines and changes in bond buying and selling activity as new economic data is released. Prediction data is uploaded after market close at 6 p.m., CST. Today’s data is based on market signals from the previous trading session.
(Want free training resources? Check our our training section for videos and tips!)
Volatility
Volatility is increasing today amid headlines, economic data and technical indicators.
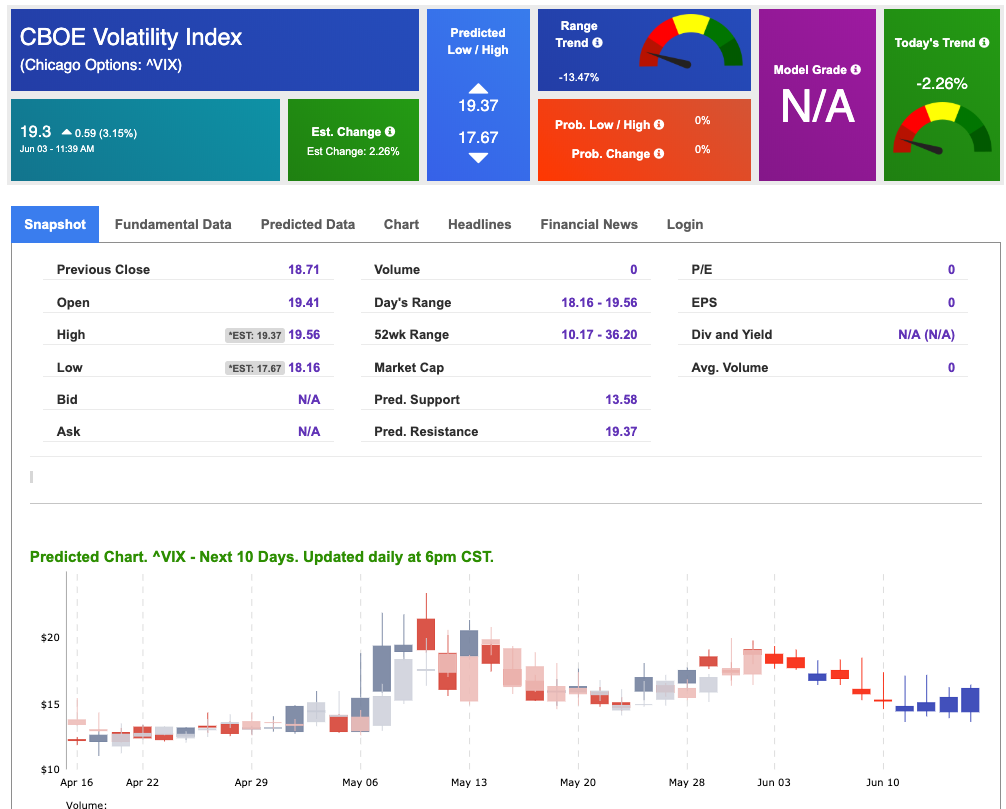
10-day prediction window shows a negative near-term outlook
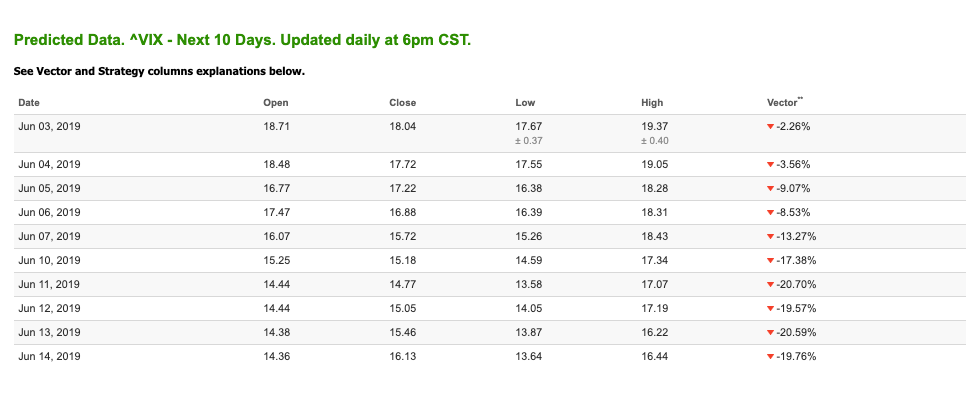
The CBOE Volatility Index (^VIX) is up 3.15% at $19.30 at the time of publication, and our 10-day prediction window shows a negative near-term outlook. The predicted low/high for today is 17.67 and 19.37 with a vector of -2.26%. Prediction data is uploaded after market close at 6 p.m., CST. Today’s data is based on market signals from the previous trading session.
(Want free training resources? Check our our training section for videos and tips!)