
Markets Ride Highs After Pfizer Announces 90% Effectiveness, Q3 Earnings Season Continues
Pfizer vaccine 90 percent effective
Markets briefly traded above all-time high levels but sold off at the end of today’s session as promising news regarding a COVID vaccine, as well as election clarity, supported stocks. Pfizer unveiled details regarding their latest vaccine trials, stating more than 90 percent effectiveness in preventing infection among volunteers, which boosted shares market-wide as futures, gold, and two of three major U.S. indices traded higher.
COVID cases topped 50 million
Still, COVID cases continue to increase worldwide as the global total topped 50 million. Following this weekend’s AP-projected victory, President-elect Joe Biden announced his transition team’s coronavirus task force as well as his day one priorities: COVID, economic recovery, racial equity, and climate change. Earnings are set to continue this week with McDonald’s, Aurora, and Canopy Growth announcing before the market open while Disney, Cisco, and DraftKings are still due this week. On Wednesday, bond markets will close in observance of Veterans’ Day while major exchanges will remain open.
SPY trade between the $340-$360 levels
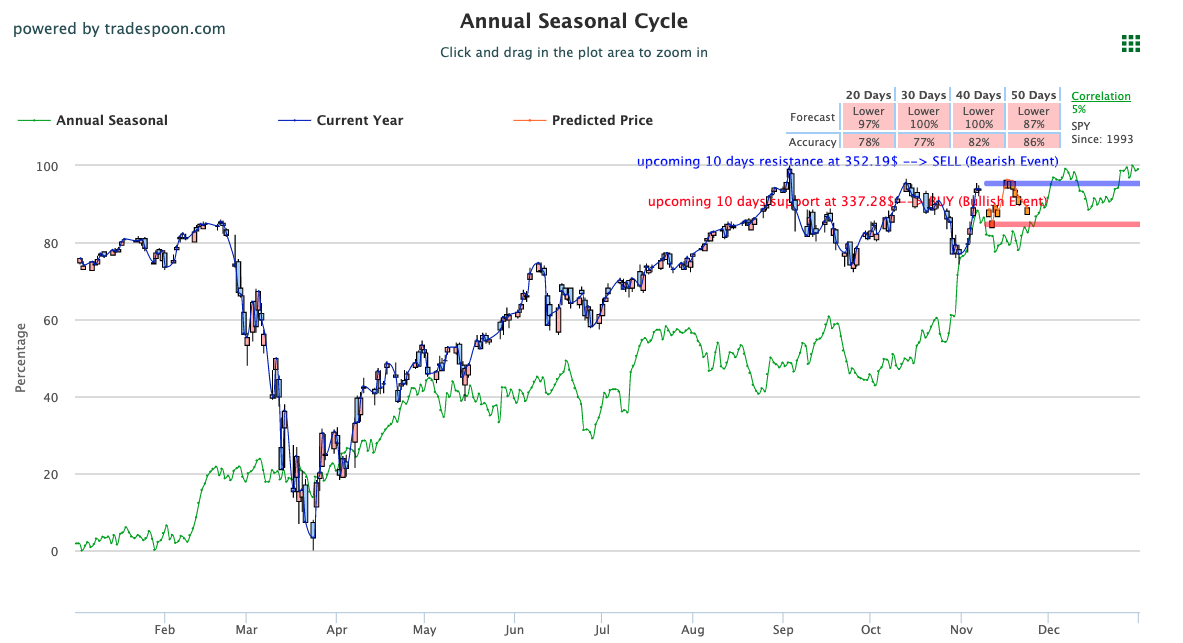
Our latest models are projecting the SPY to trade between the $340-$360 levels until an additional breakout is confirmed. We are seeing strong rotation from growth to value stocks and believe the SPY is on its way to retest its recent highs before the end of November. With the market prone to further corrections, the next level of support is set at $354.
Volatility to persist
We expect volatility to persist as uncertainty around the elections continues and we will continue monitoring VIX levels, as the market can overshoot support and resistance levels when VIX is trading near the $40 level. Likewise, we encourage all market commentary readers to maintain clearly defined stop-levels for all positions. For reference, the SPY Seasonal Chart is shown below:

Key U.S. Economic Reports/Events This Week
- Job Openings (September) – Tuesday
- Veterans’ Day – Wednesday
- Weekly Jobless Claims (11/7) – Thursday
- Consumer Price Index (October) – Thursday
- Core CPI (October) – Thursday
- Federal Budget (October) – Thursday
- Producer Price Index (October) – Friday
- Consumer Sentiment Index (November) – Friday
Upcoming Earnings
- CGC – Canopy Growth – Monday
- MCD – McDonald’s – Monday
- NCLH – Norwegian Crusie Line Holdings – Monday
- TLRY – Tilray – Monday
- AAP – Advance Auto Parts – Tuesday
- DHI – D.R. Horton – Tuesday
- LYFT – Lyft – Tuesday
- AMAT – Applied Materials – Thursday
- CSCO – Cisco Systems – Thursday
- DIS – Walt Disney – Thursday
- DKNG – DraftKings – Friday
(Want free training resources? Check our our training section for videos and tips!)
For reference, the S&P 10-Day Forecast is shown below:
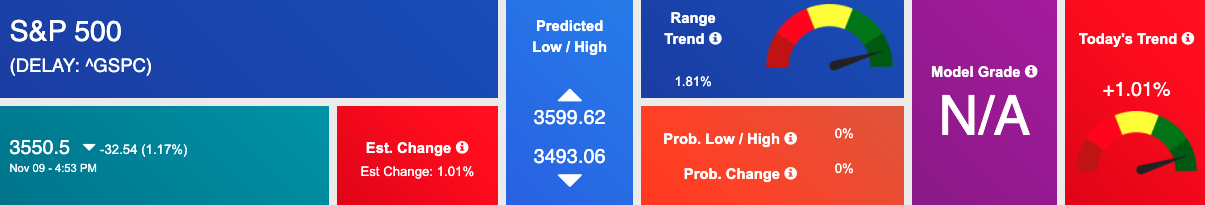
Using the “^GSPC” symbol to analyze the S&P 500 our 10-day prediction window shows a near-term mixed outlook. Prediction data is uploaded after the market closes at 6 p.m. CST. Today’s data is based on market signals from the previous trading session.
(Want free training resources? Check our our training section for videos and tips!)

ROBOINVESTOR SPECIAL:
Breakthrough, high-tech Artificial Intelligence platform available to Tradespoon’s individual investors:
Click Here – To See Where AI Places My Money
Tuesday Morning Featured Symbol
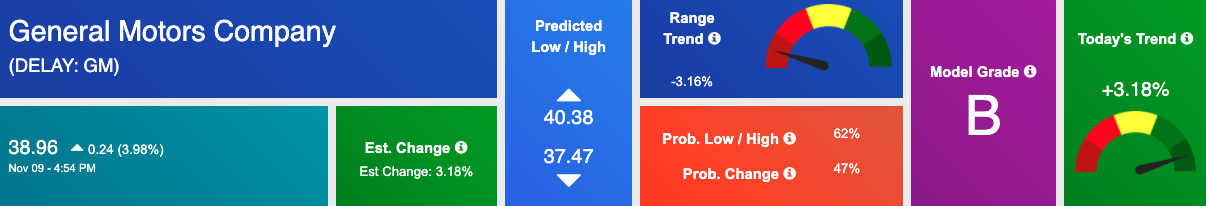
Our featured symbol for Tuesday is General Motors Company (GM). GM is showing a steady vector in our Stock Forecast Toolbox’s 10-day forecast.
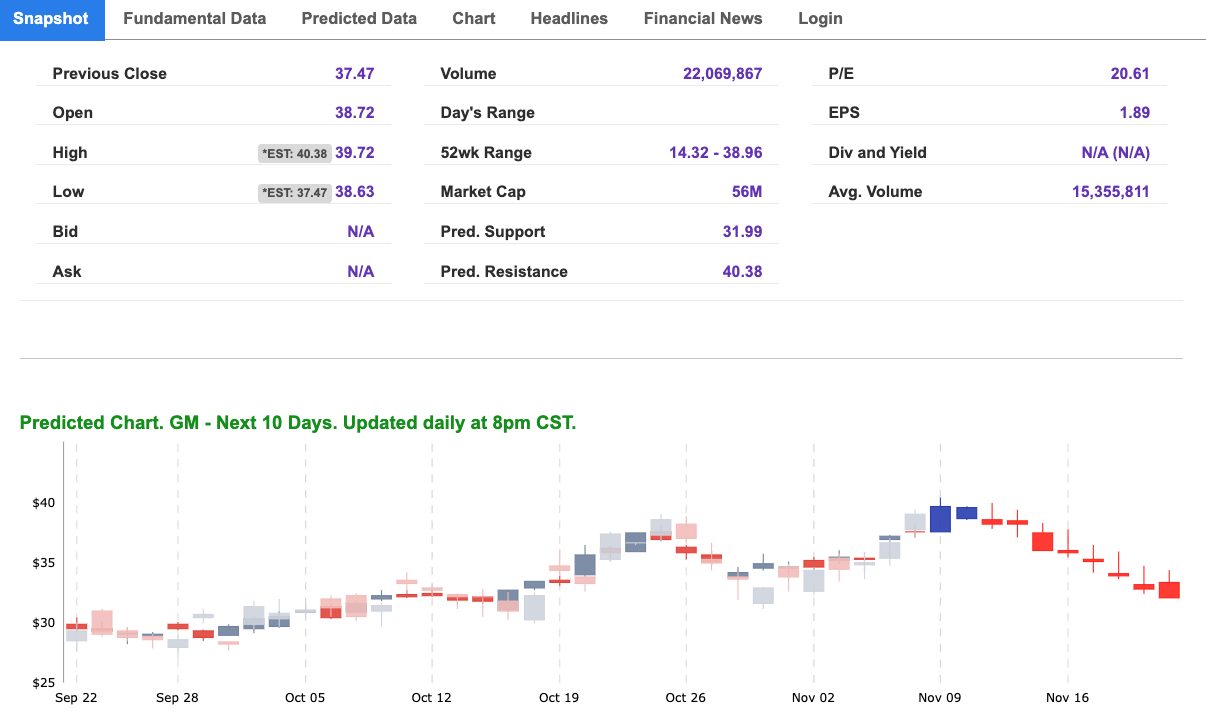
The stock is trading at $38.96 with a vector of +3.18% at the time of publication.
(Want free training resources? Check our our training section for videos and tips!)
10-Day Prediction data is uploaded after the market close at 6 p.m., CST. Today’s data is based on market signals from the previous trading session.
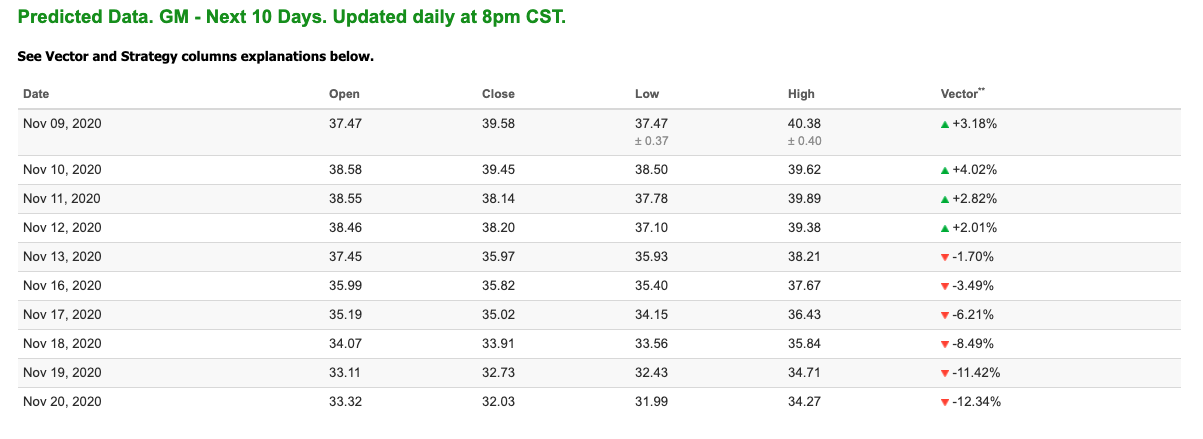
Note: The Vector column calculates the change of the Forecasted Average Price for the next trading session relative to the average of actual prices for the last trading session. The column shows the expected average price movement “Up or Down”, in percent. Trend traders should trade along the predicted direction of the Vector. The higher the value of the Vector the higher its momentum.
*Please note: At the time of publication Vlad Karpel does have a position in the featured symbol, GM. Our featured symbol is part of your free subscription service. It is not included in any paid Tradespoon subscription service. Vlad Karpel only trades his money in paid subscription services. If you are a paid subscriber, please review your Premium Member Picks, ActiveTrader, or MonthlyTrader recommendations. If you are interested in receiving Vlad’s picks, please click here.
Oil
West Texas Intermediate for Crude Oil delivery (CL.1) is priced at $39.92 per barrel, down 0.94% at the time of publication.
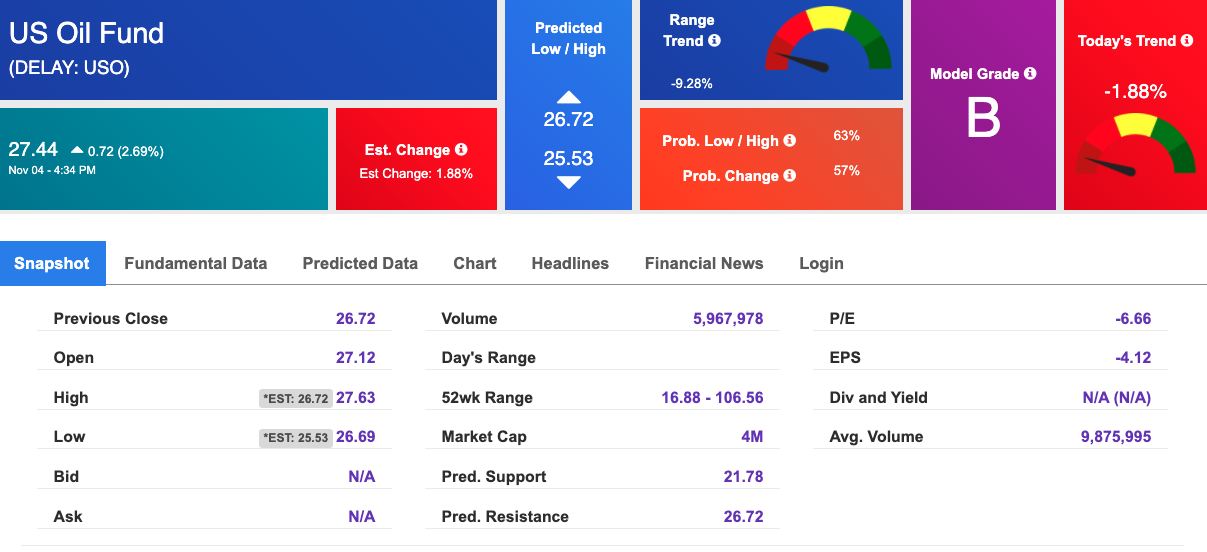
Looking at USO, a crude oil tracker, our 10-day prediction model shows positive signals. The fund is trading at $27.44 at the time of publication. Prediction data is uploaded after the market close at 6 p.m., CST. Today’s data is based on market signals from the previous trading session.
(Want free training resources? Check our our training section for videos and tips!)
Gold
The price for the Gold Continuous Contract (GC00) is up 0.37% at $1860.90 at the time of publication.
Using SPDR GOLD TRUST (GLD) as a tracker in our Stock Forecast Tool, the 10-day prediction window shows mixed signals. The gold proxy is trading at $178.82, at the time of publication. Vector signals show -0.52% for today. Prediction data is uploaded after the market close at 6 p.m., CST. Today’s data is based on market signals from the previous trading session.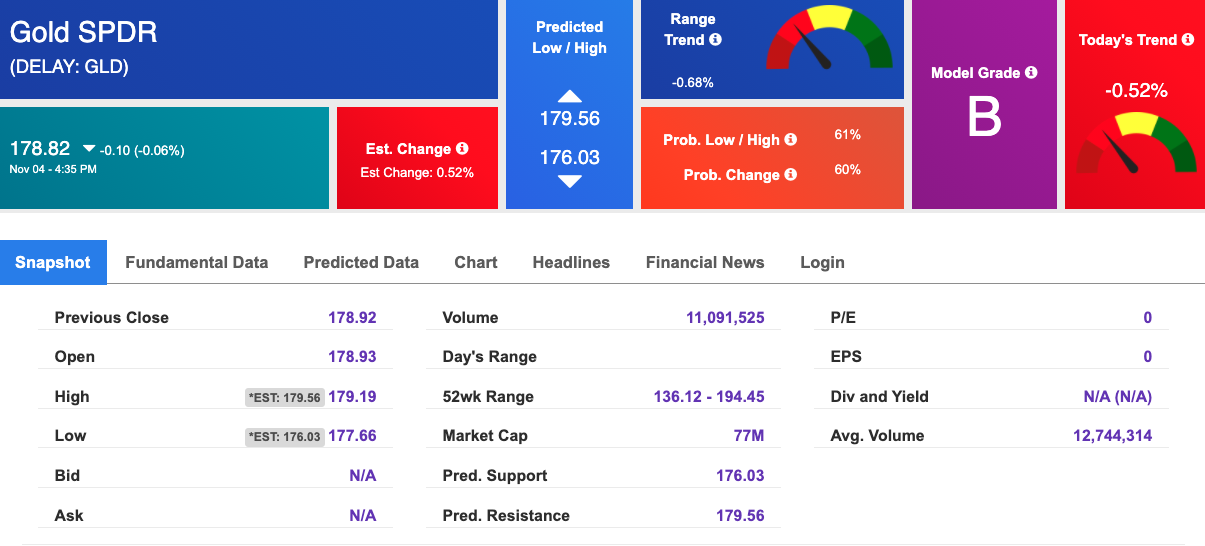
Treasuries
The yield on the 10-year Treasury note is up, at 0.935% at the time of publication.
The yield on the 30-year Treasury note is up, at 1.717% at the time of publication.
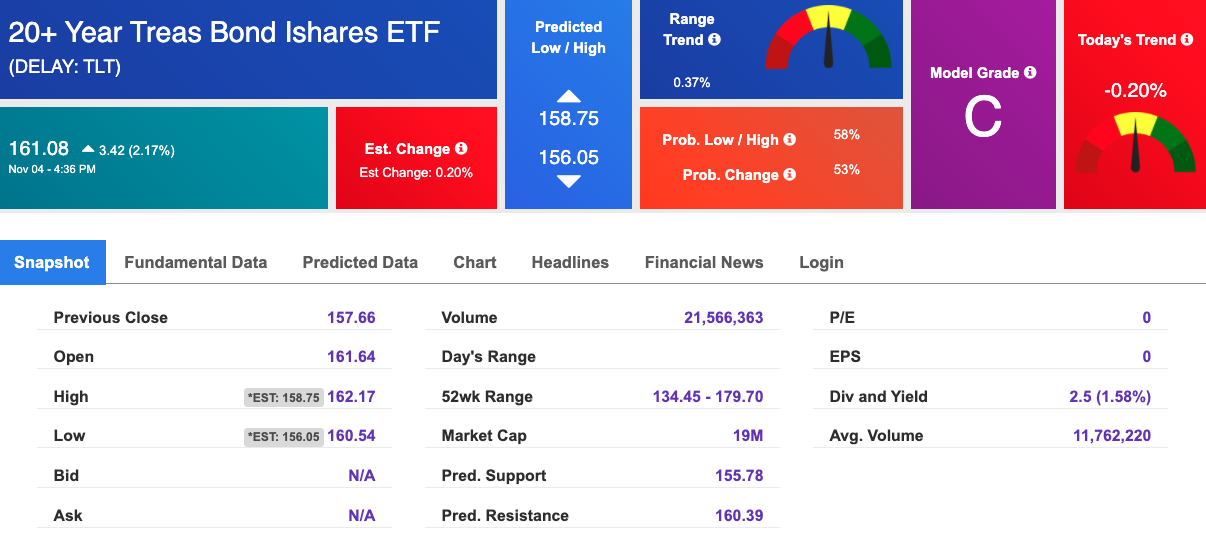
Using the iShares 20+ Year Treasury Bond ETF (TLT) as a proxy for bond prices in our Stock Forecast Tool, we see mixed signals in our 10-day prediction window. Prediction data is uploaded after the market close at 6 p.m., CST. Today’s data is based on market signals from the previous trading session.
(Want free training resources? Check our our training section for videos and tips!)
Volatility
The CBOE Volatility Index (^VIX) is $25.75 at the time of publication, and our 10-day prediction window shows mixed signals. Prediction data is uploaded after the market close at 6 p.m., CST. Today’s data is based on market signals from the previous trading session.
(Want free training resources? Check our our training section for videos and tips!)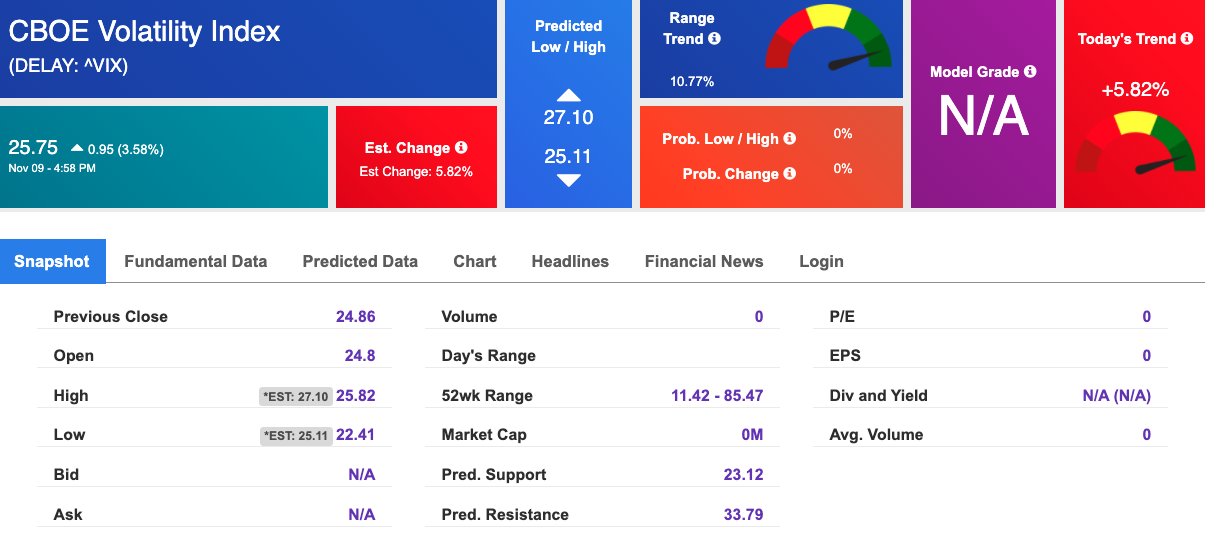
ROBOINVESTOR SPECIAL:
Breakthrough, high-tech Artificial Intelligence platform available to Tradespoon’s individual investors:
Click Here – To See Where AI Places My Money
(Want free training resources? Check our our training section for videos and tips!)