Middle East Analysis: How to Trade Oil
Markets remain muted after last Friday’s selloff, triggered by unrest in the Middle East, which caused major U.S. indices the worst trading session in over a month. To start the day, all three major U.S. indices traded lower only to rebound in the afternoon, on track to close in with slight gains.
HEIGHTENED U.S.-IRAN TENSIONS MAKE IMPACT OF THE OIL PRICE
Heightened U.S.-Iran tensions have impacted oil as well as global markets, with both Asian and European markets closing in the red. Key economic reports this week include Constellation Brands and Walgreens earnings as well as the final labor reports of 2019. Next week, Chinese officials are due in D.C. for a four-day meeting to sign the partial “phase one” trade deal which will rollback several tariffs.
(Want free training resources? Check our our training section for videos and tips!)
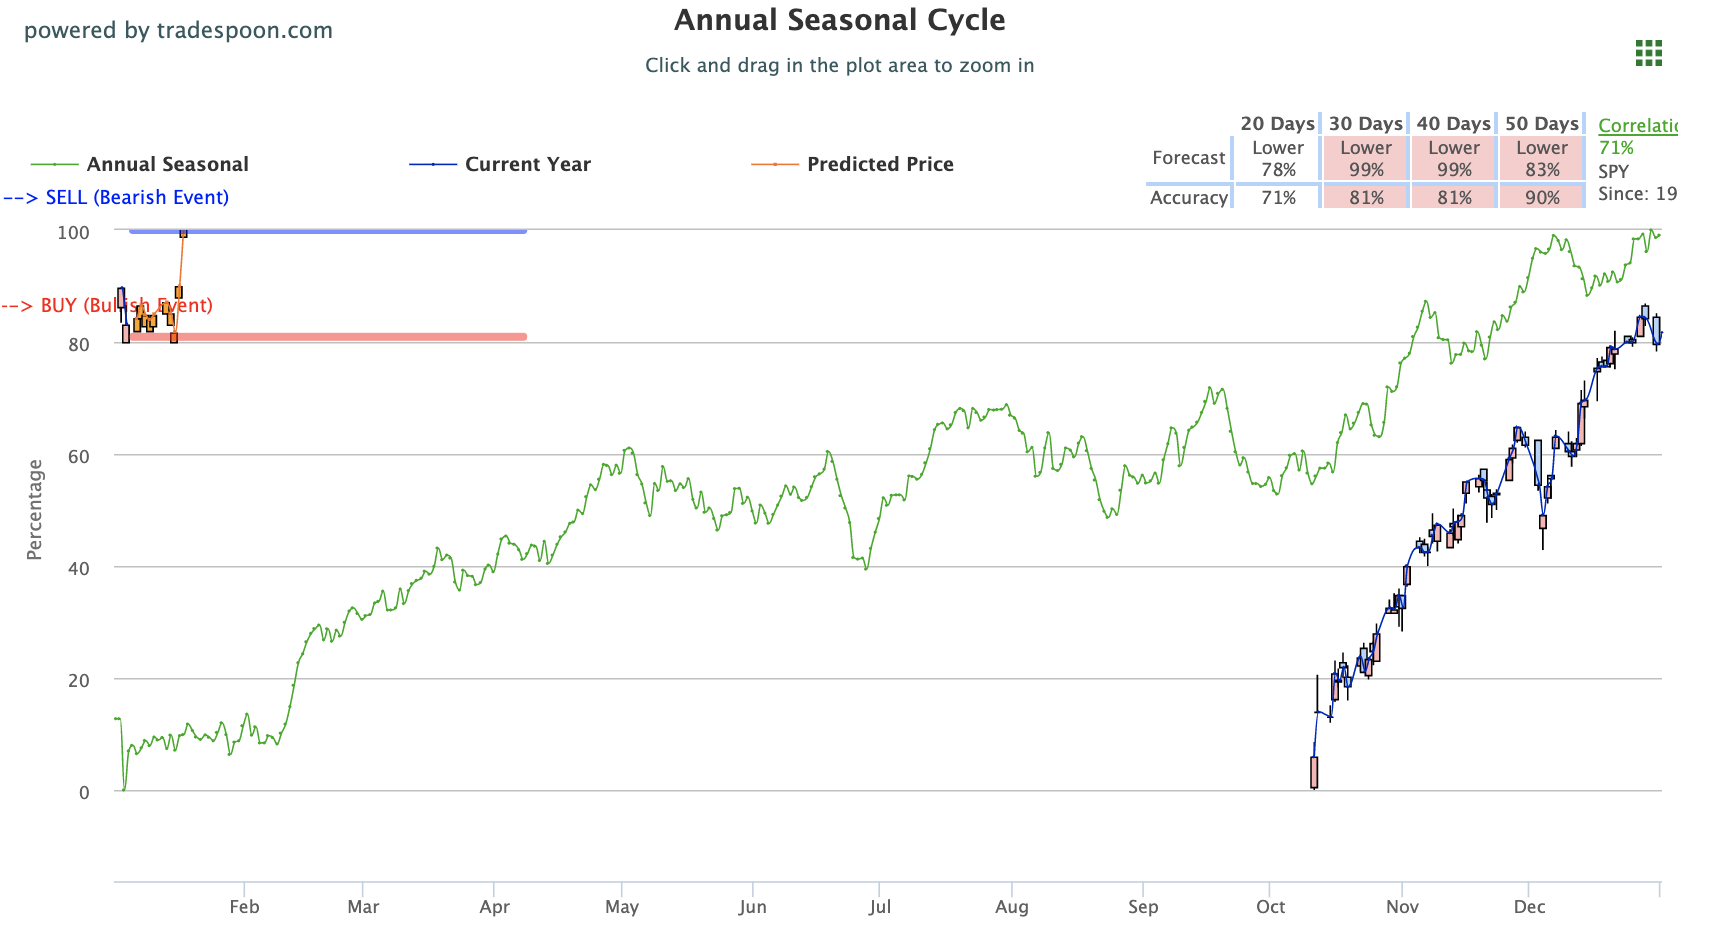
Currently, we will look to buy when SPY is near $315 level, with the latest short-term support and resistance levels at $315-$325. We are bullish on the market in the short-term and expect shallow pullbacks going into the next earnings season. Some further volatility could be expected and we encourage readers to retain clearly defined stop-levels for all positions. For reference, the SPY Seasonal Chart is shown below:
LAST FRIDAY THE WORST TRADING SESSION SINCE EARLY DECEMBER
Tension in the Middle East continues to contribute to market-wide pressure, causing both U.S. and global markets to lower dramatically, and triggering the worst trading session since early December last Friday. While oil remains under pressure from the conflict it appears major U.S. indices were able to slightly rebound today. The Dow, Nasdaq, and S&P were able to record slight gains today after starting off the day trading lower. As additional developments continue to unfold in the Middle East, the other major global development keeping the market’s attention remains U.S.-China relations. Next week, Chinese officials are due in D.C. to sign the partial trade agreement. With the four-day meeting beginning on January 13th, look for the “phase one” deal to rollback several tariffs as well as possibly establish additional dates for negotiation.
Economic reports remain light this week with two notable earnings and no major economic reports. The final 2019 labor data will release this week along with trade deficit, consumer credit, and fact0ry orders reports. Earnings season will pick up seriously in the next two weeks but this week we will see earnings data from Constellation Brands and Walgreens. Look for the Federal Budget and Beige Book to release next week.
(Want free training resources? Check our our training section for videos and tips!)
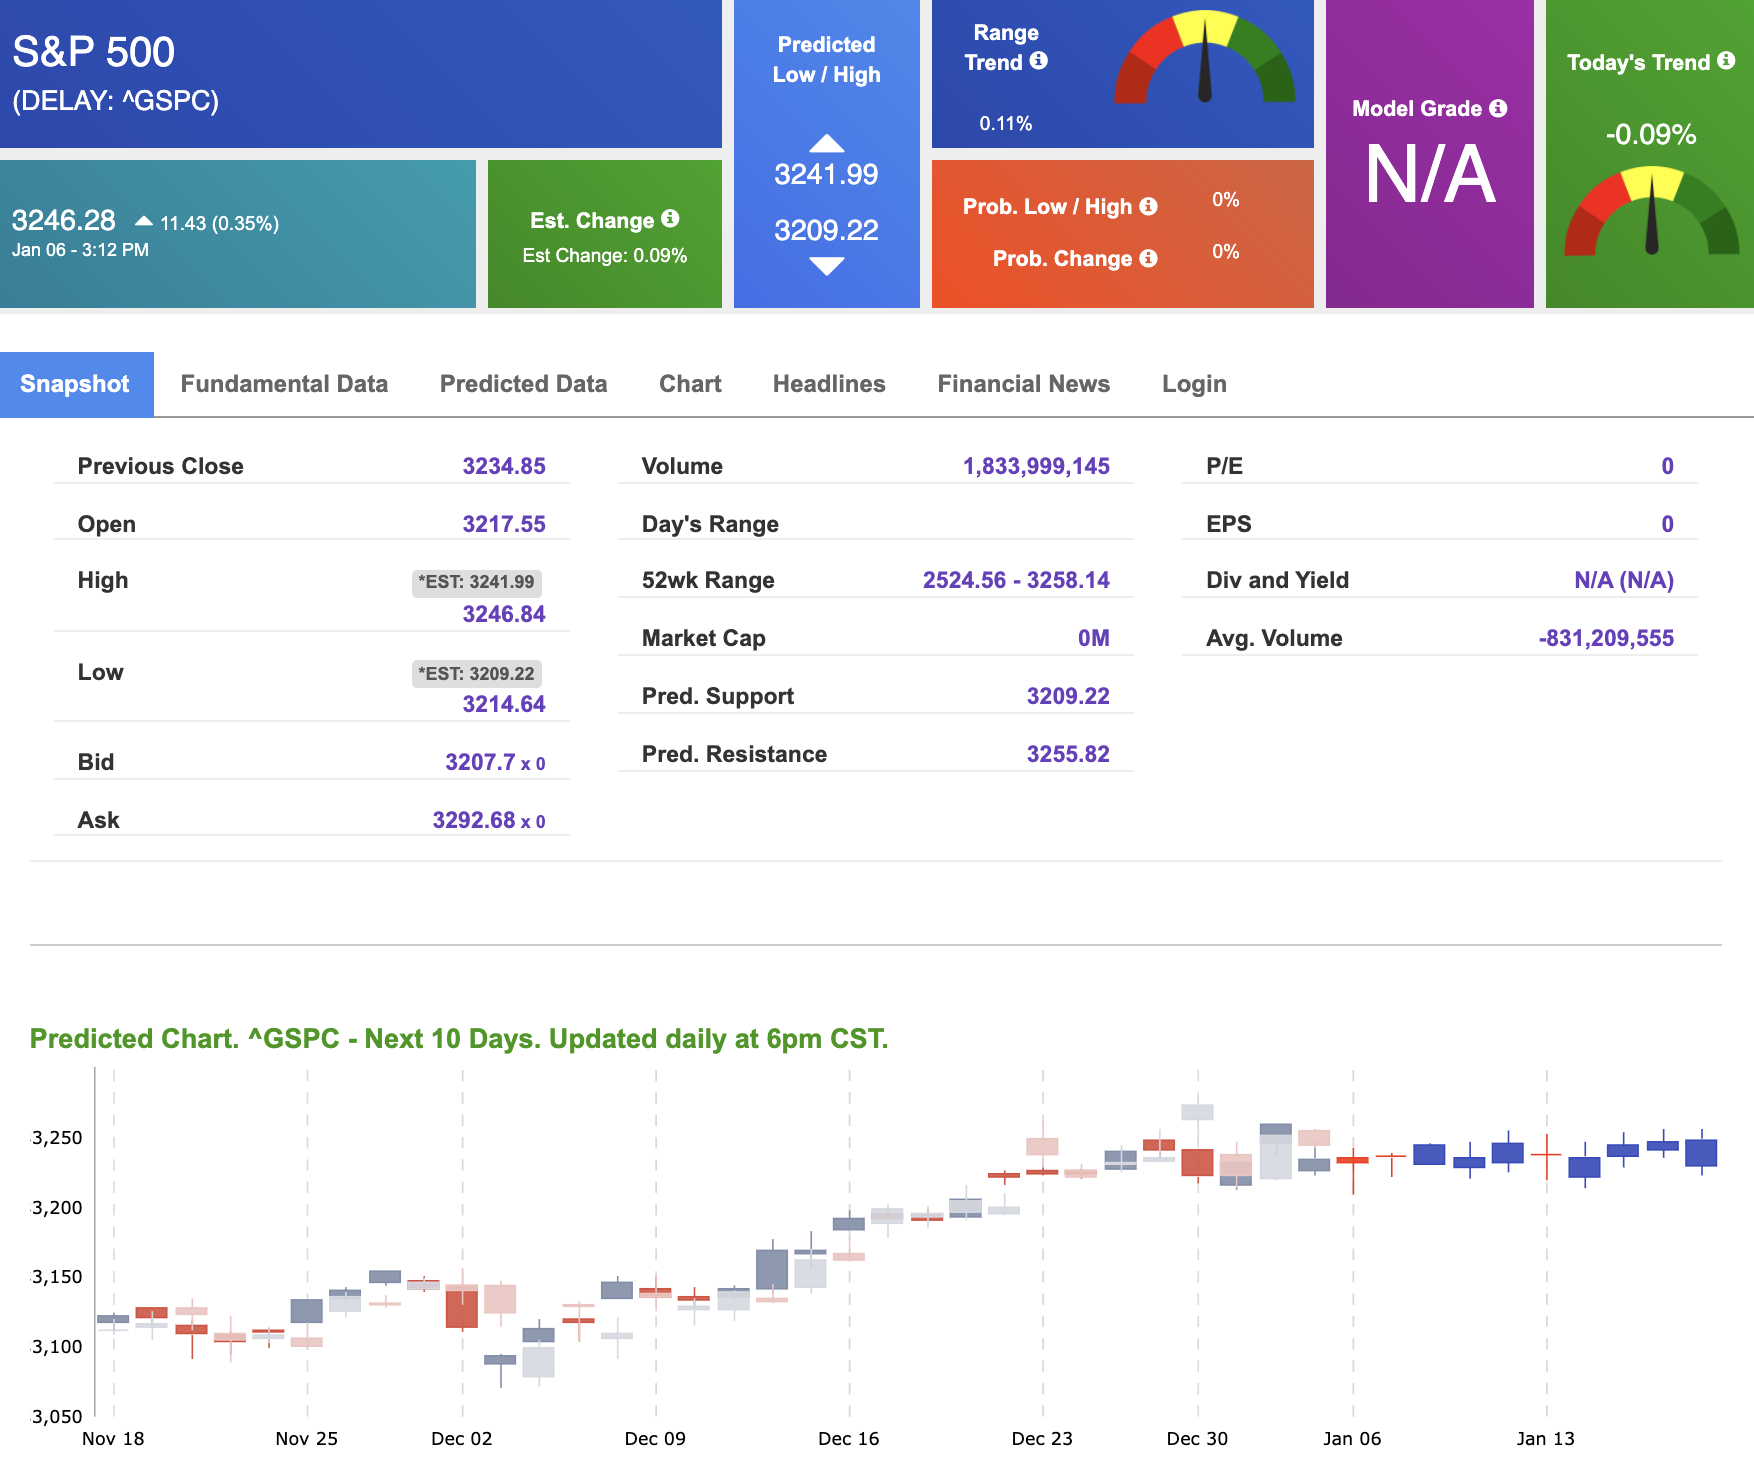
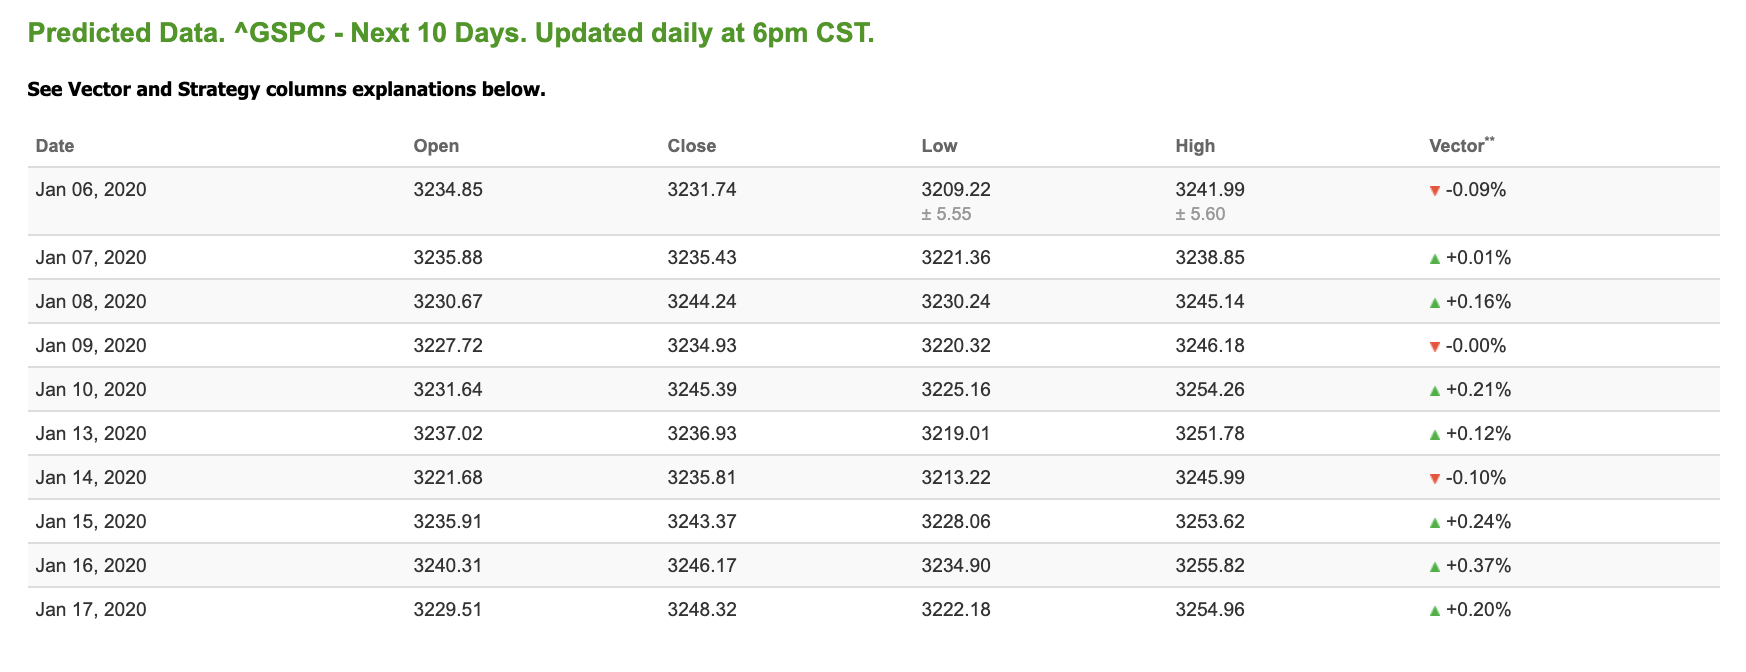
Using the “^GSPC” symbol to analyze the S&P 500 our 10-day prediction window shows a near-term mixed outlook. Today’s vector figure of -0.09% moves to +0.21% in four trading sessions. Prediction data is uploaded after the market closes at 6 p.m. CST. Today’s data is based on market signals from the previous trading session.
I put my money where my mouth is!
LISTEN, I’VE BEEN AROUND LONG ENOUGH TO HAVE BEEN EXPOSED TO EVERY “EARTH-CHANGING” INVESTMENT STRATEGY WALL STREET HAS EVER DREAMED UP.
I’M TELLING YOU ARTIFICIAL INTELLIGENCE IS NOT JUST ANOTHER GIMMICK FOR WALL STREET TO MARKET ITSELF.
I DON’T LIKE THE WAY WALL STREET’S ROBO ADVISORS CUT YOU OUT OF THE DECISION PROCESS, BUT I AM PERSONALLY RELYING UPON THE VERY LATEST, CUTTING-EDGE AI TO IDENTIFY MONEY-MAKING OPPORTUNITIES.
YES! I’M INVESTING MY OWN MONEY IN EACH AND EVERY STOCK AS MY AI PLATFORM IDENTIFIES.
I RACKED UP HUGE GAINS ON MY OWN MONEY BY RELYING ON MY MIND-BOGGLING HIGH-TECH AI PLATFORM TO ACCURATELY FORECAST EVERYTHING I NEEDED TO KNOW ABOUT THE STOCKS IN MY PORTFOLIO.
AND REMEMBER WE’RE NOT TALKING ABOUT DAY-TRADING HERE. I ALREADY HAVE A 94% SUCCESS RATE AND ALMOST A 5% RETURN PER TRADE. WITH 59 WINNERS OUT OF 63 TRADES IN THE LAST 13 MONTHS, I HAVE A CUMULATIVE RETURN OF 295 %!
TWICE A MONTH, YOU’LL GET A COMPLETE RUNDOWN ON WHAT I’VE DONE WITH MY MONEY THAT WEEK, WHAT YOU SHOULD DO NOW AS WELL AS HOW OUR PAST PICKS ARE DOING AND WHEN TO SELL THEM.
CLICK HERE FOR THE $97 SUPER SALE
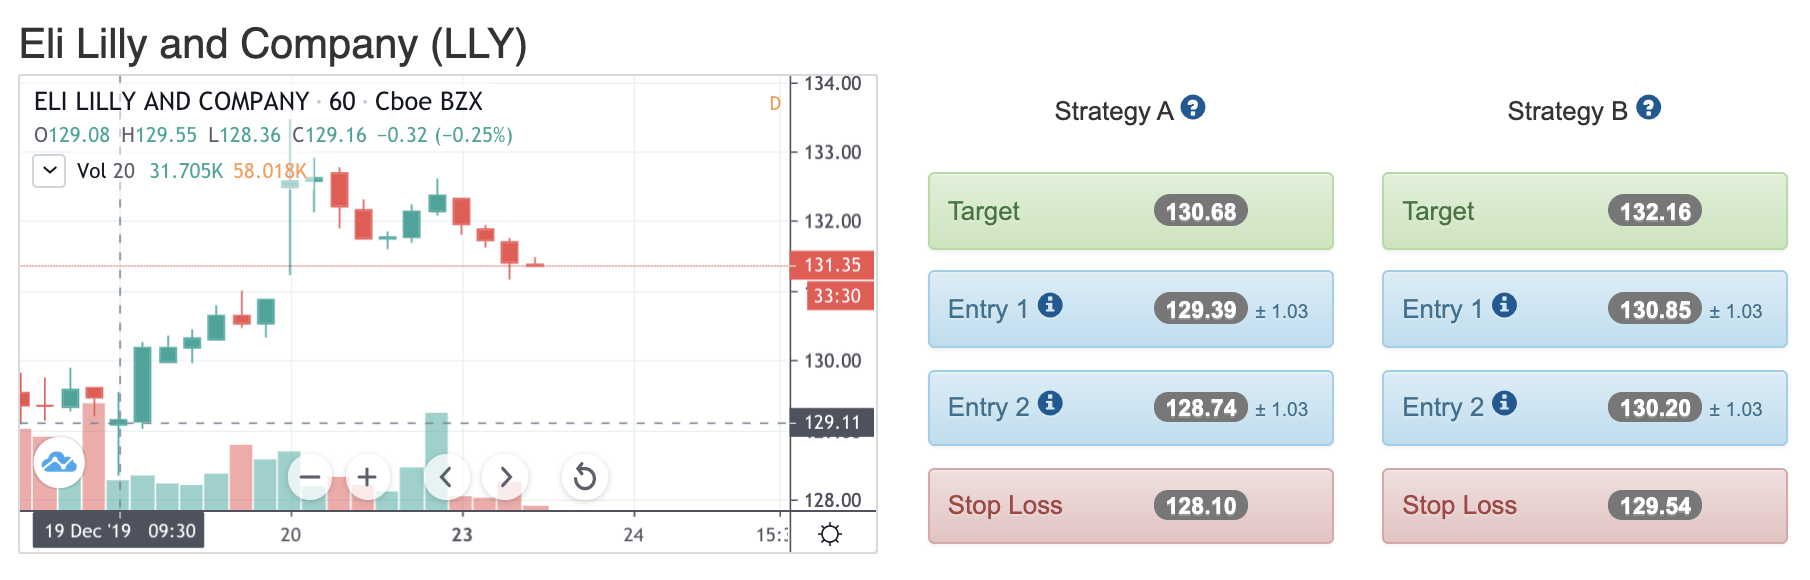
HIGHLIGHT OF A RECENT WINNING TRADE
On December 20th, our ActiveTrader service produced a bullish recommendation for Eli Lily and Company (LLY). ActiveTrader is included in all paid Tradespoon membership plans and is designed for day trading, with signals meant to last for 1-2 days.
Trade Breakdown
LLY entered its forecasted Strategy A Entry 1 price range $129.39(± 1.03) in its first hour of trading and passed through its Target price of $132.16 in the last hour of trading the following trading day in the final hour of trading. The Stop Loss price was set at $132.16.
TUESDAY MORNING FEATURED SYMBOL
*Please note: At the time of publication Vlad Karpel does have a position in the featured symbol, MSFT. Our featured symbol is part of your free subscription service. It is not included in any paid Tradespoon subscription service. Vlad Karpel only trades his own personal money in paid subscription services. If you are a paid subscriber, please review your Premium Member Picks, ActiveTrader or MonthlyTrader recommendations. If you are interested in receiving Vlad’s personal picks, please click here.
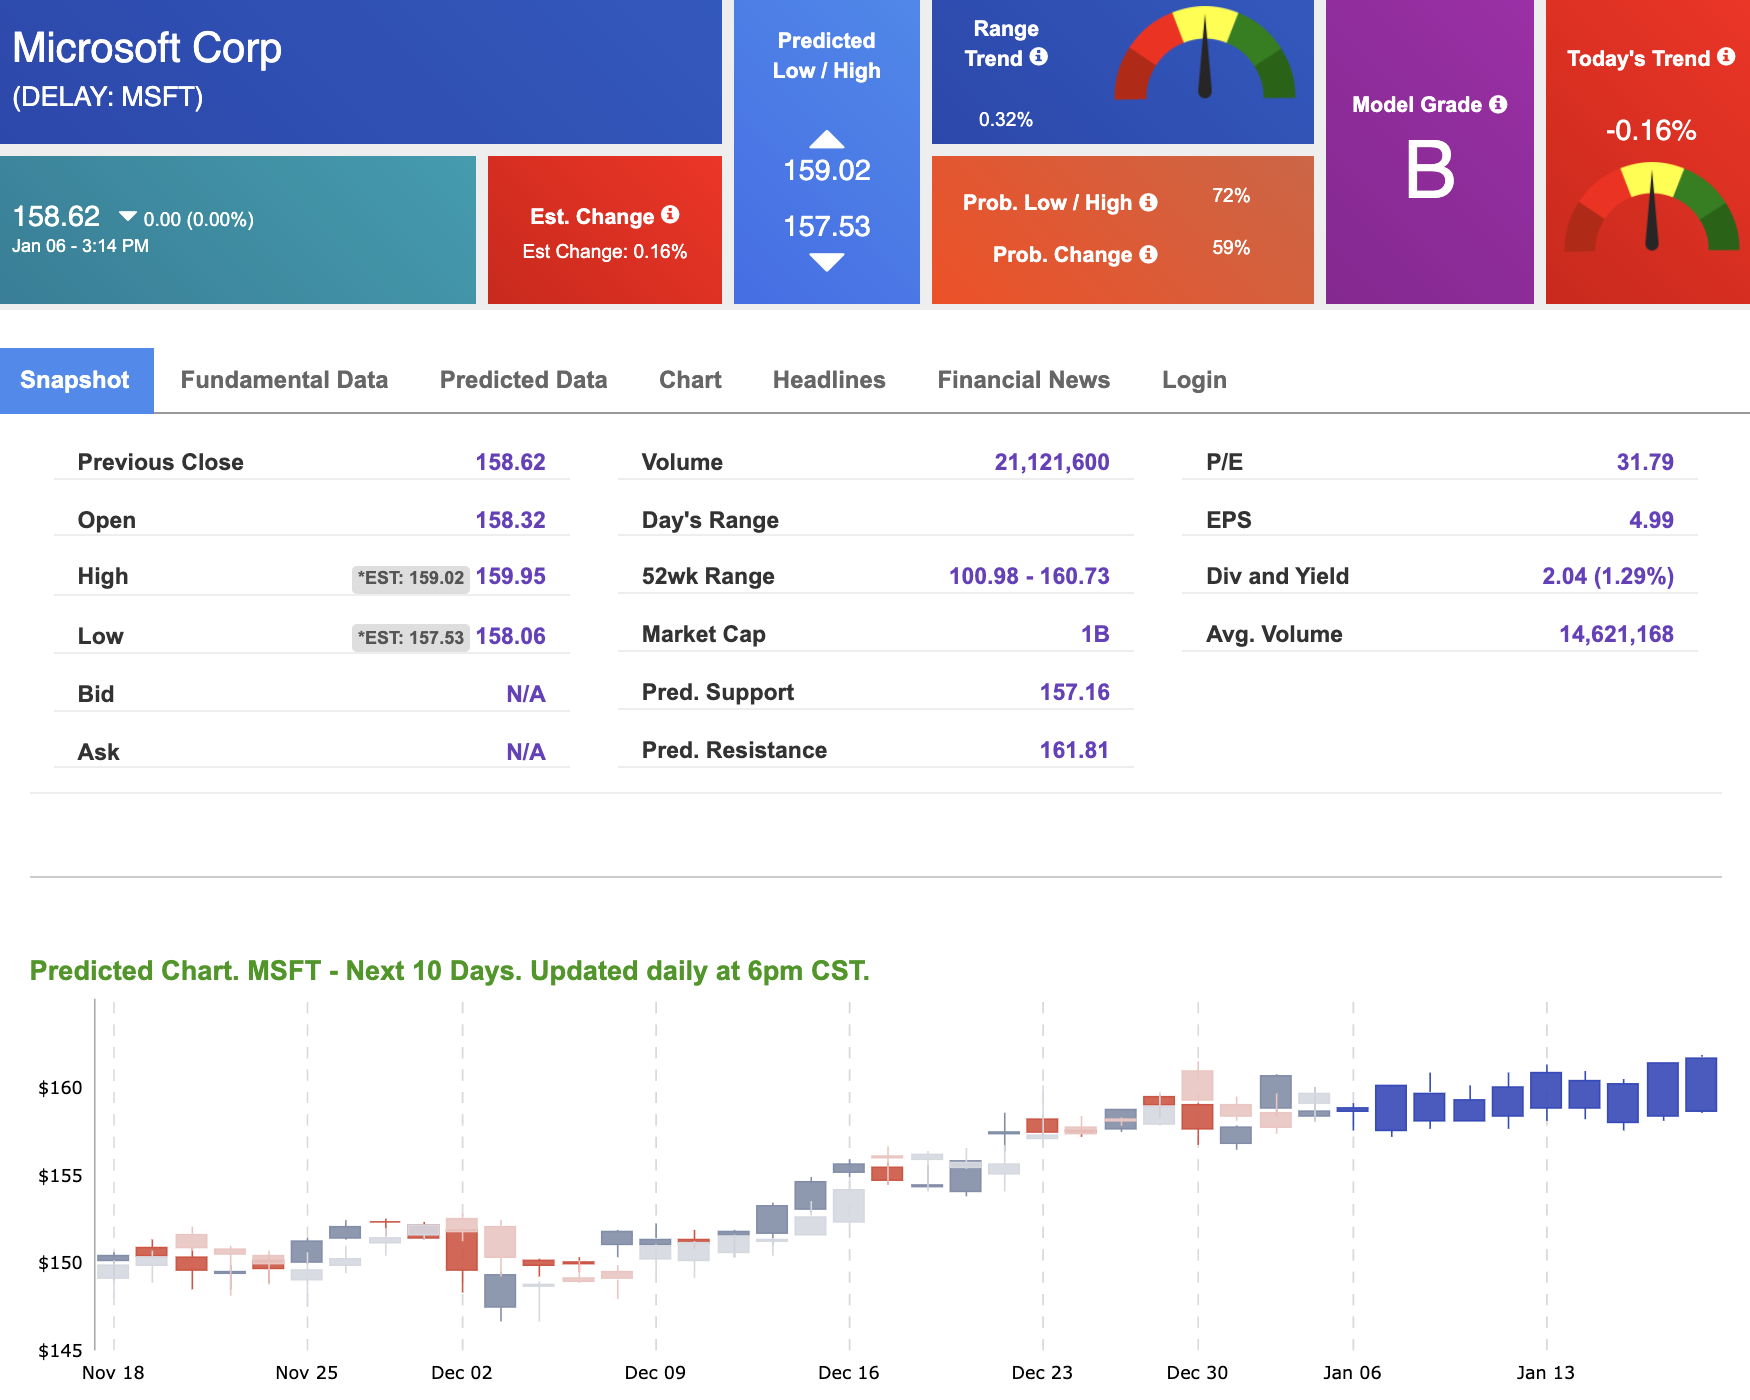
Our featured symbol for Tuesday is Microsoft (MSFT). MSFT is showing a mixed vector trend in our Stock Forecast Toolbox’s 10-day forecast. This stock is assigned a Model Grade of (B) indicating it ranks in the top 25th percentile for accuracy for current-day predicted support and resistance, relative to our entire data universe.
The stock is trading at $158.62 at the time of publication, with a -0.16% vector figure.
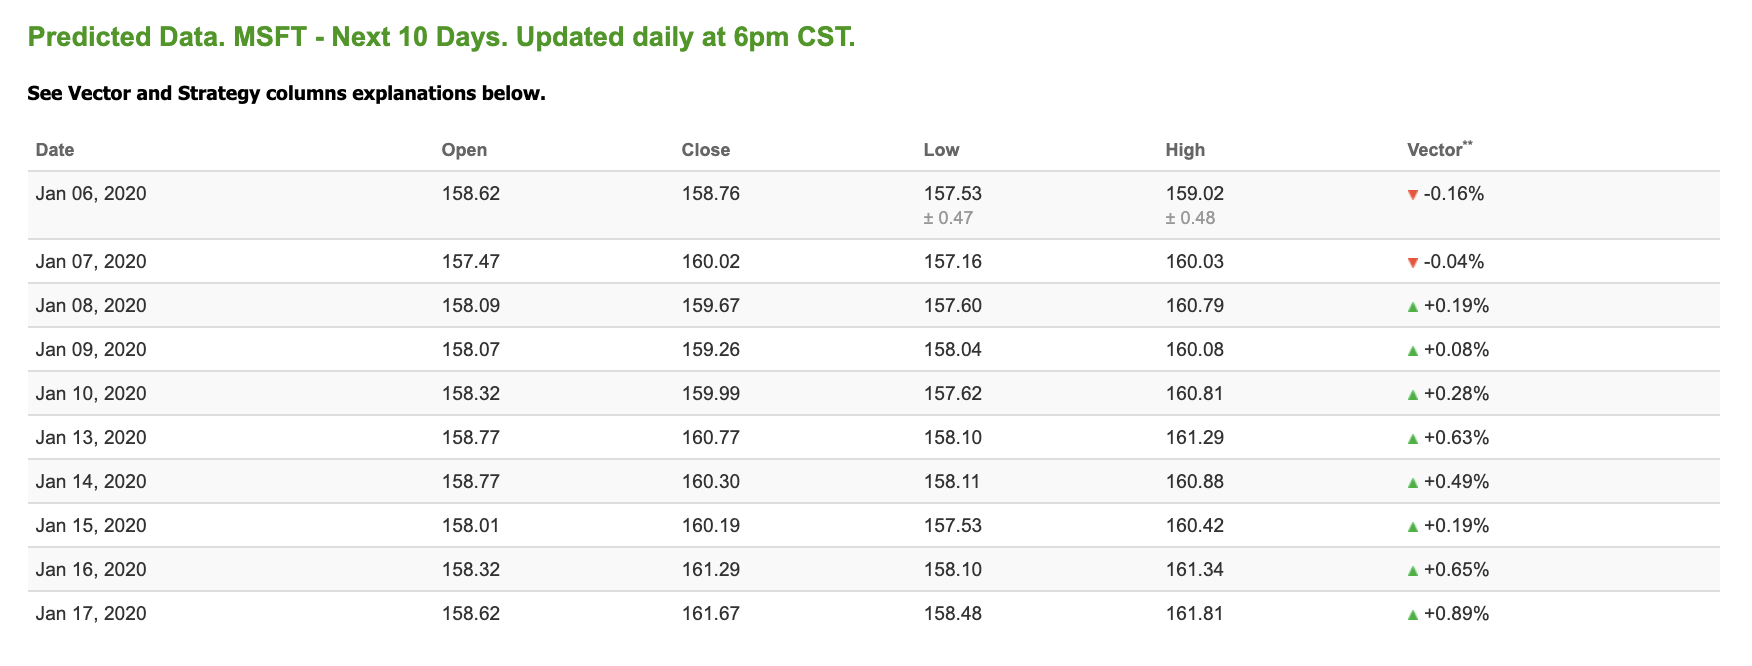
Prediction data is uploaded after the market close at 6 p.m., CST. Today’s data is based on market signals from the previous trading session.
Note: The Vector column calculates the change of the Forecasted Average Price for the next trading session relative to the average of actual prices for the last trading session. The column shows the expected average price movement “Up or Down”, in percent. Trend traders should trade along the predicted direction of the Vector. The higher the value of the Vector the higher its momentum.
OIL
West Texas Intermediate for Crude Oil delivery (CL.1) is priced at $61.66 per barrel, down 0.10% from the open, at the time of publication.
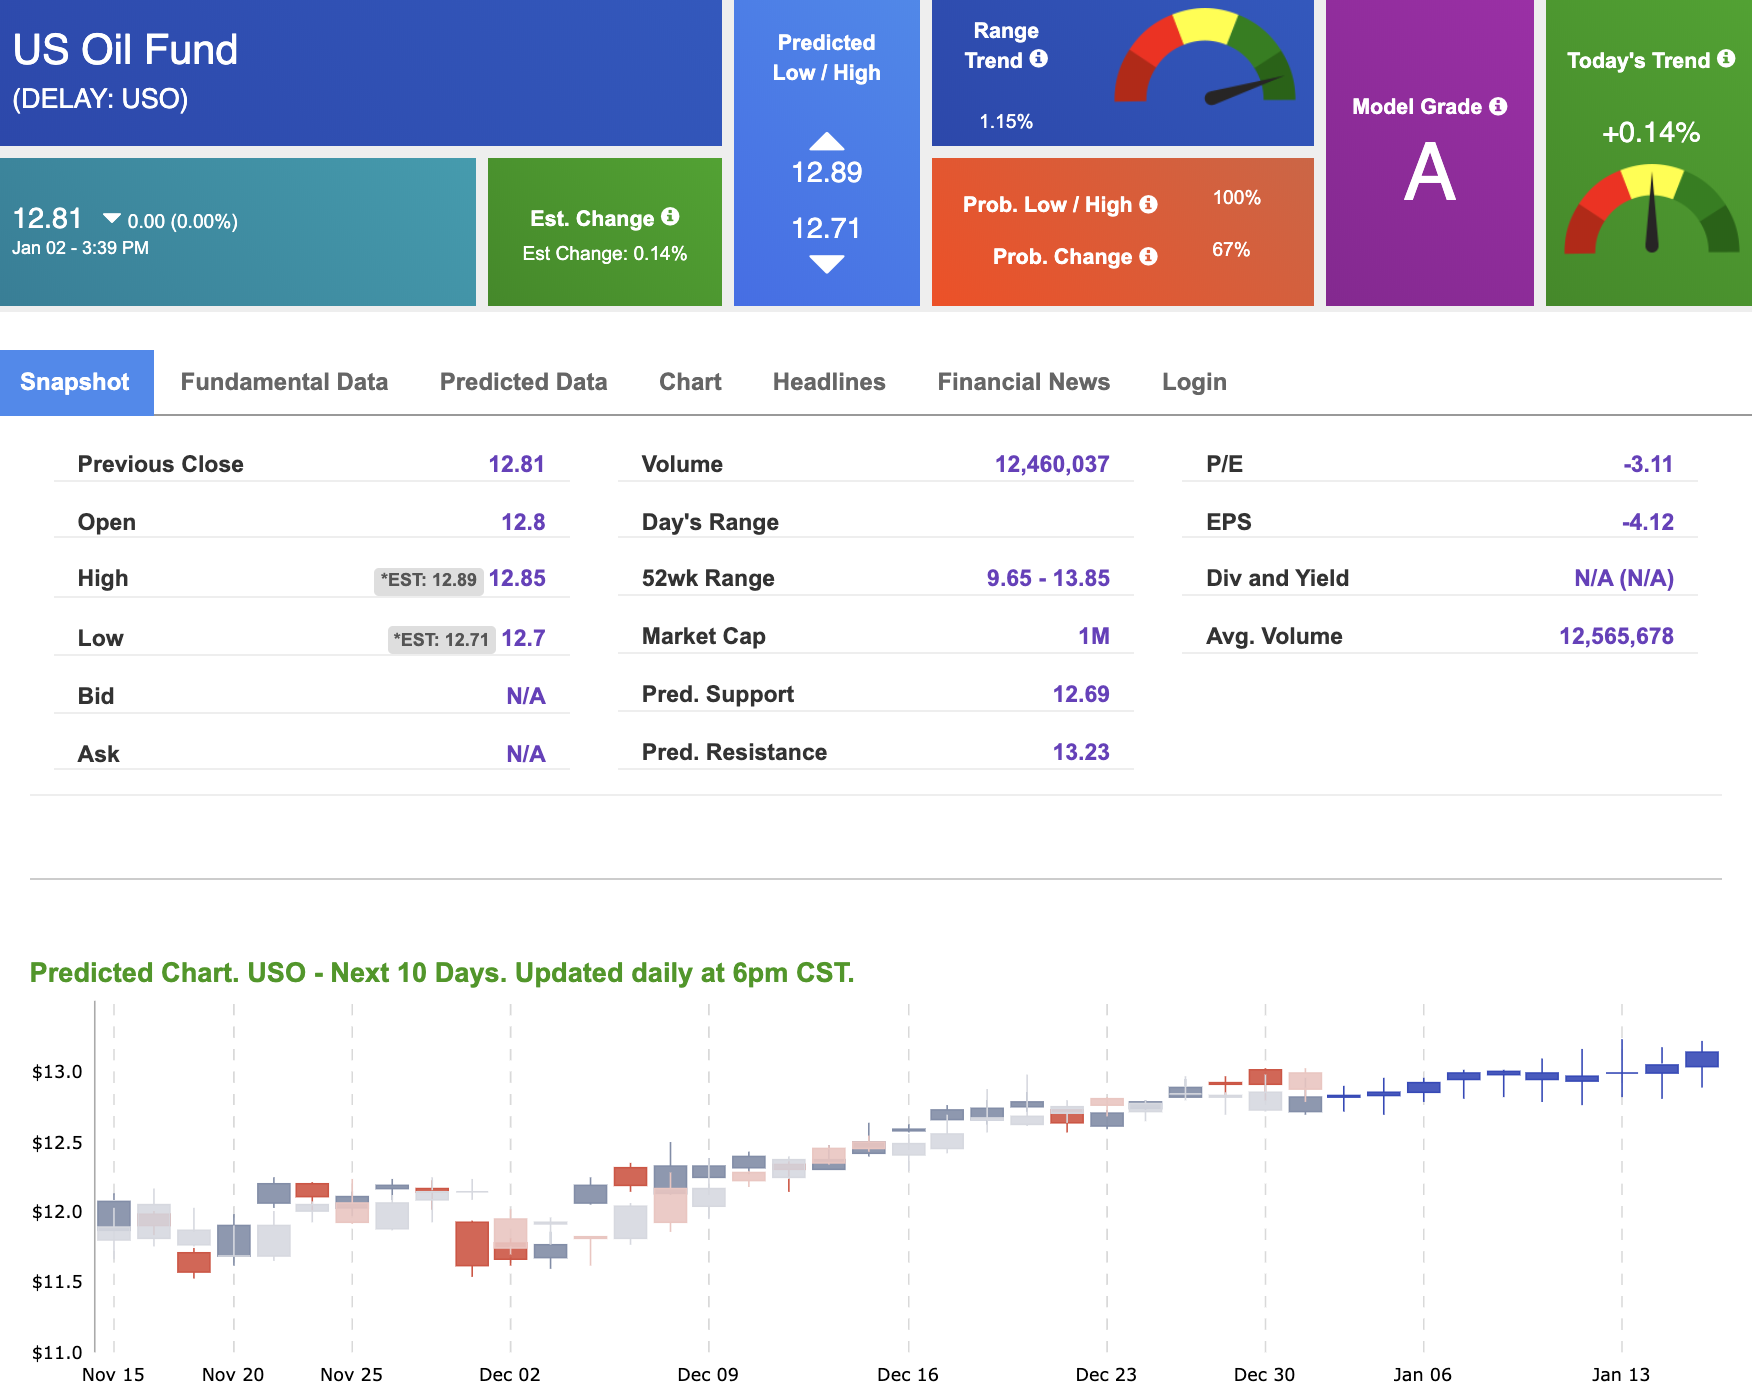
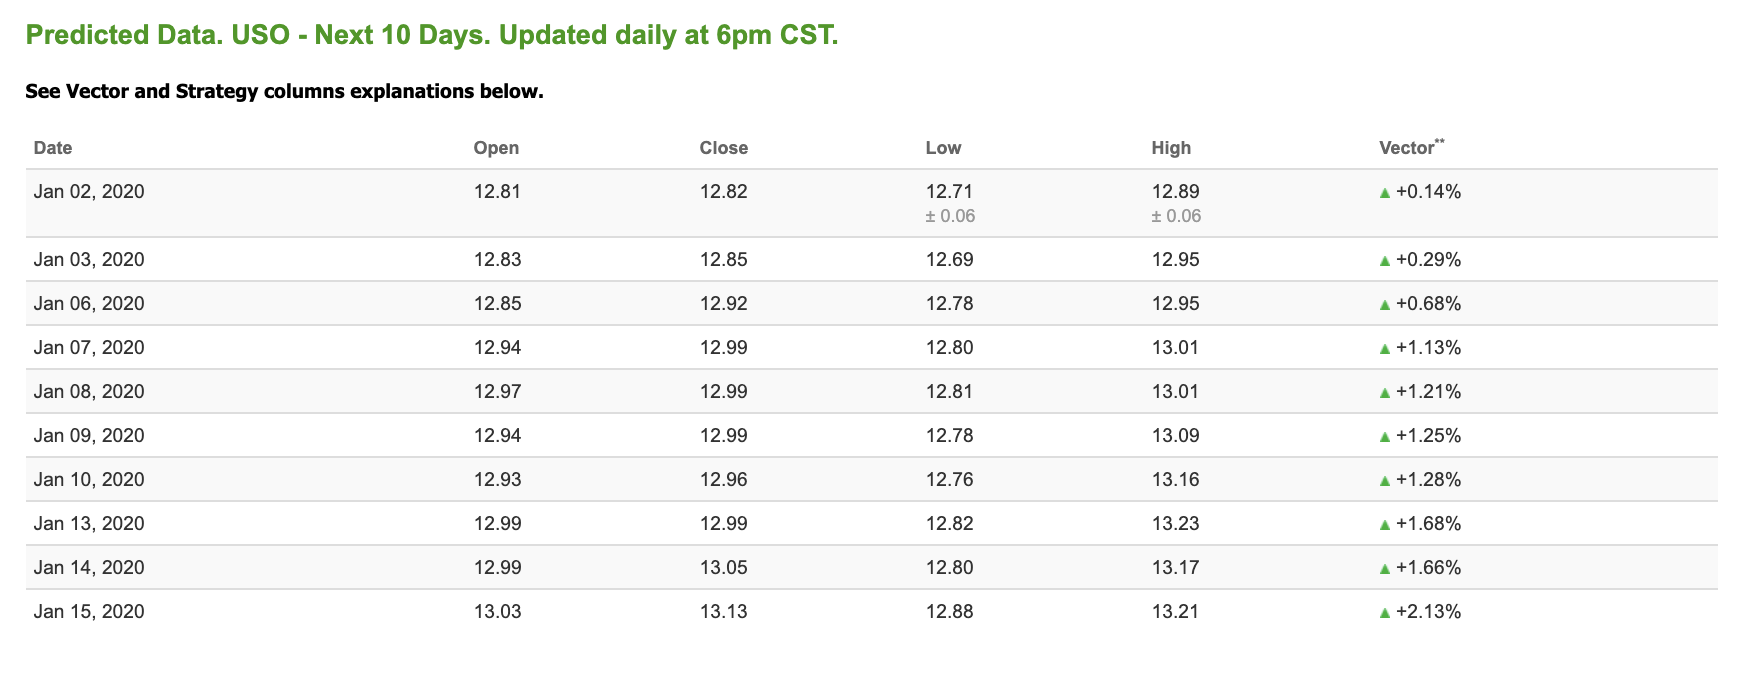
Looking at USO, a crude oil tracker, our 10-day prediction model shows positive signals. The fund is trading at $12.81 at the time of publication. Vector figures show +0.14% today, which turns to +1.13% in three trading sessions. Prediction data is uploaded after the market close at 6 p.m., CST. Today’s data is based on market signals from the previous trading session.
GOLD
The price for the Gold Continuous Contract (GC00) is flat at $1,518.810 at the time of publication.
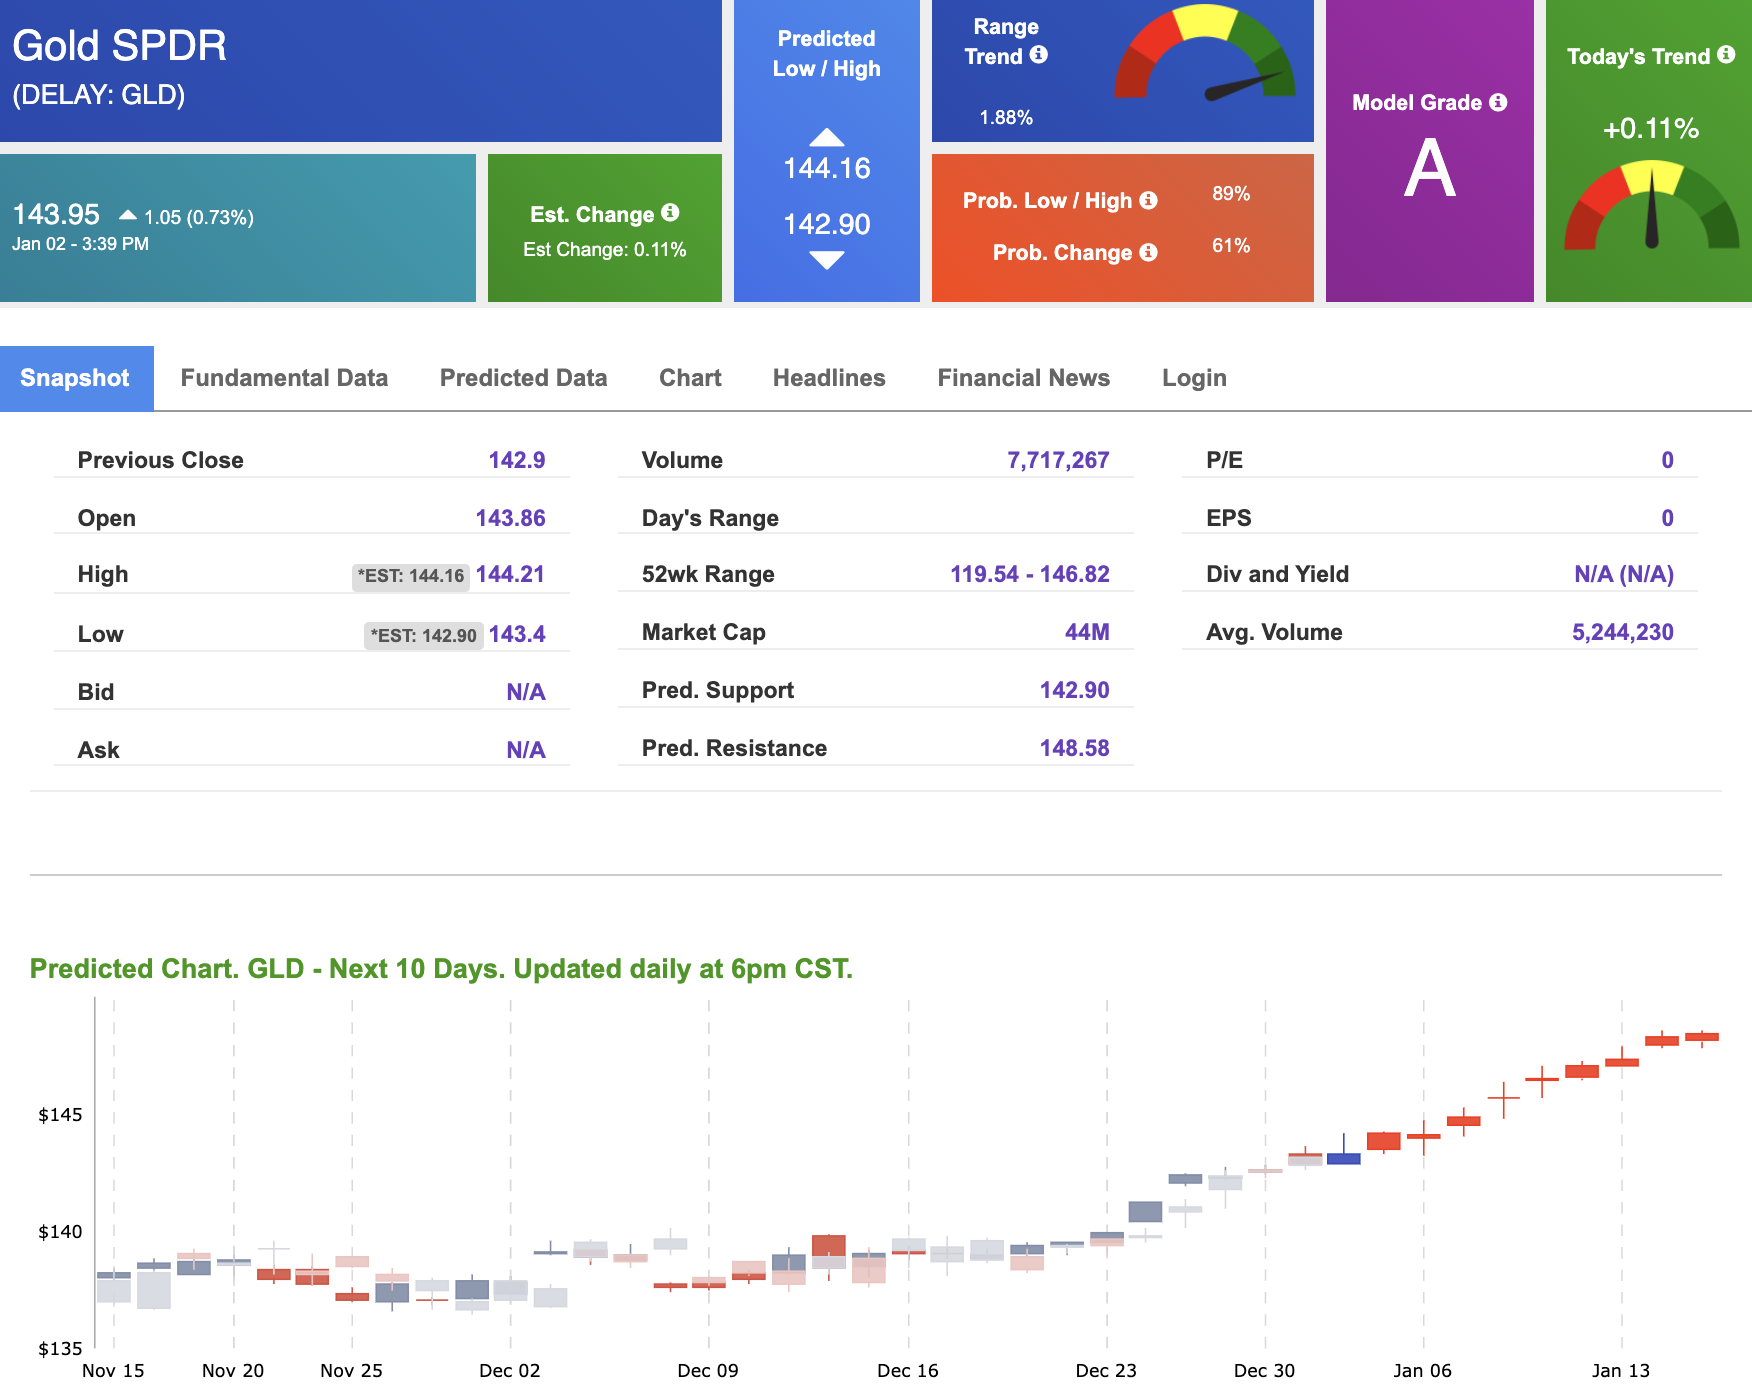
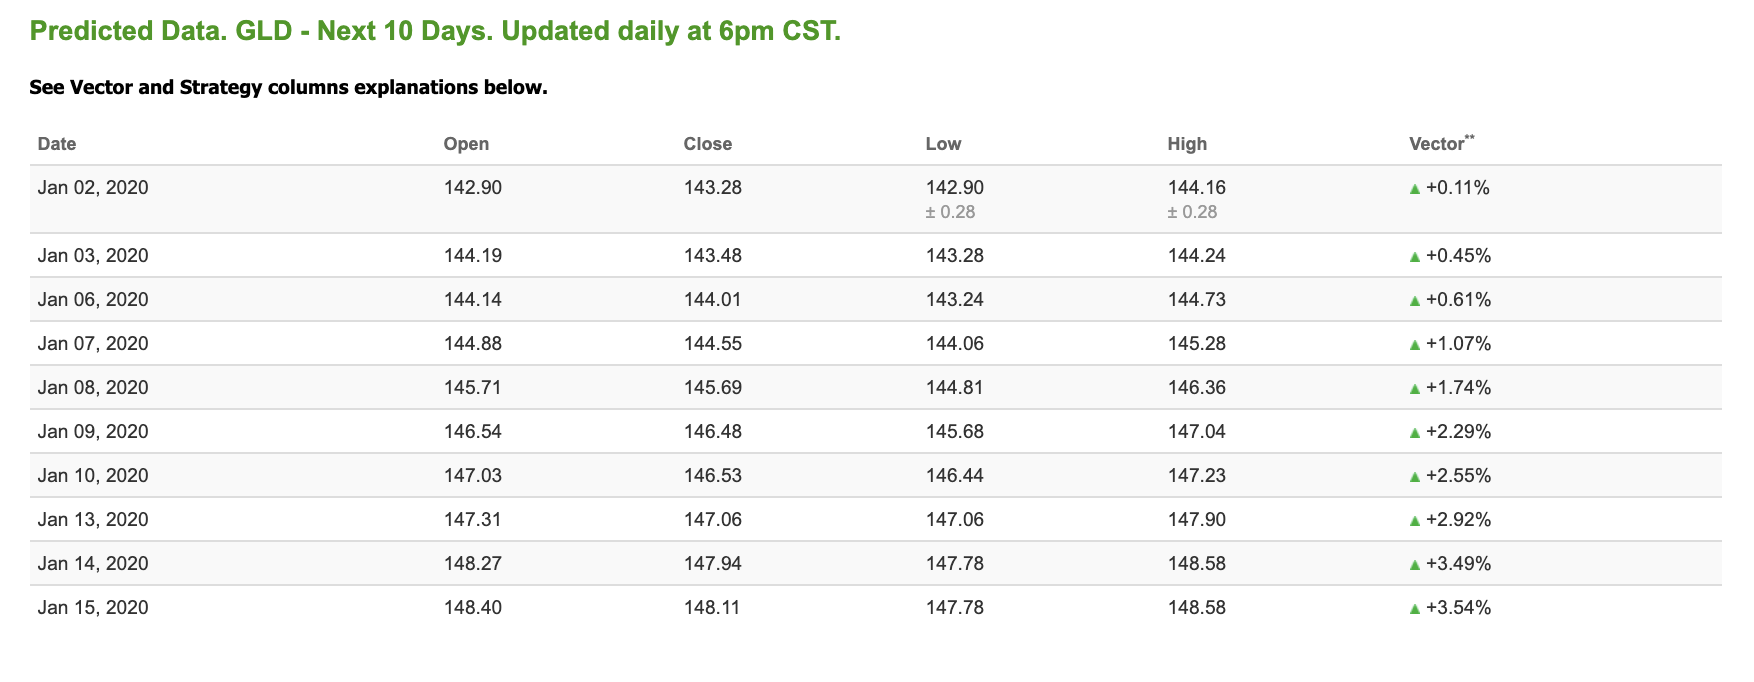
Using SPDR GOLD TRUST (GLD) as a tracker in our Stock Forecast Tool, the 10-day prediction window shows positive signals. The gold proxy is trading at $143.95, at the time of publication. Vector signals show +0.11% for today. Prediction data is uploaded after the market close at 6 p.m., CST. Today’s data is based on market signals from the previous trading session.
TREASURIES
The yield on the 10-year Treasury note is up 0.28% at 1.88% at the time of publication.
The yield on the 30-year Treasury note is up 0.61% at 2.33% at the time of publication.
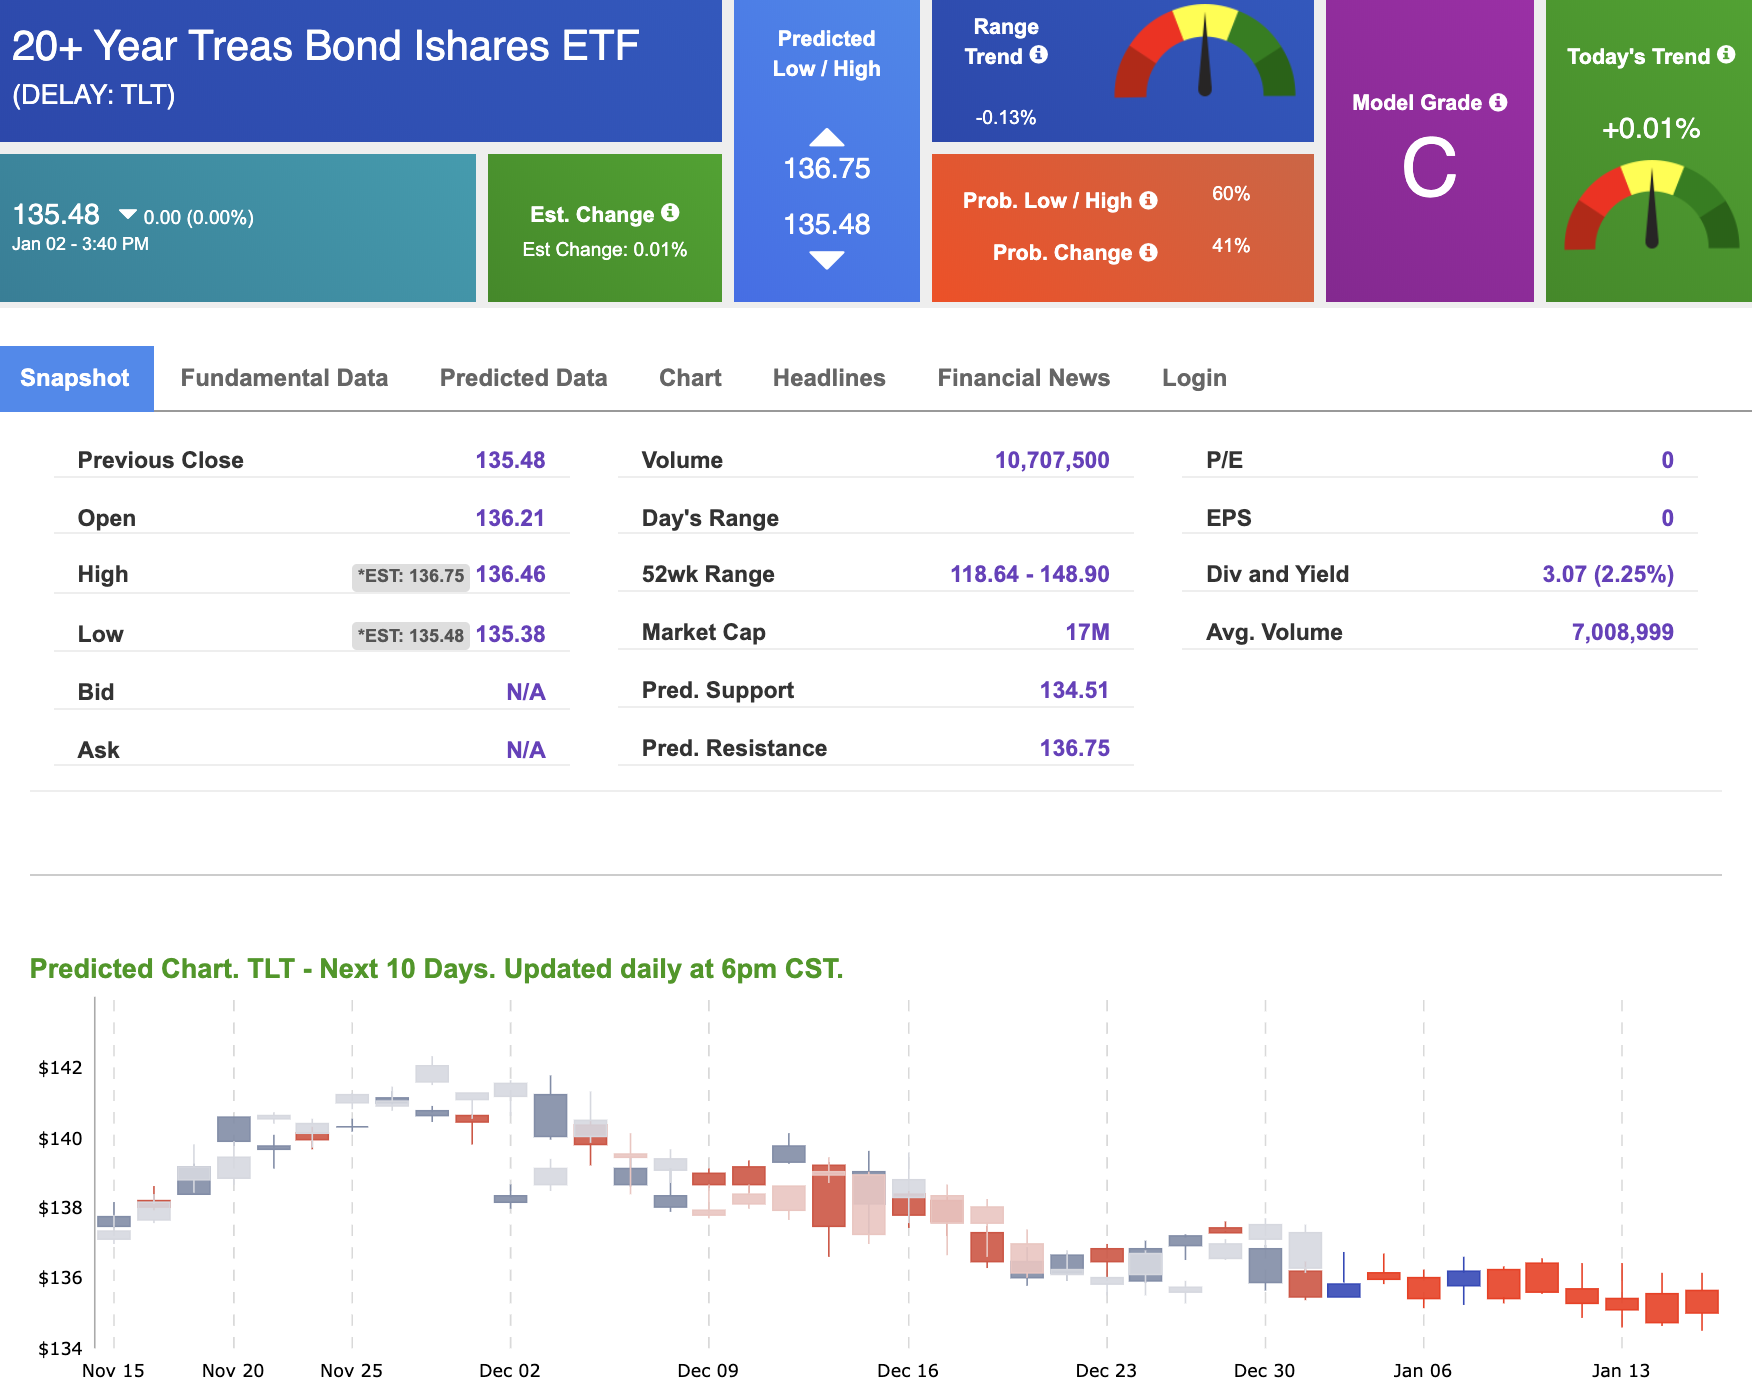
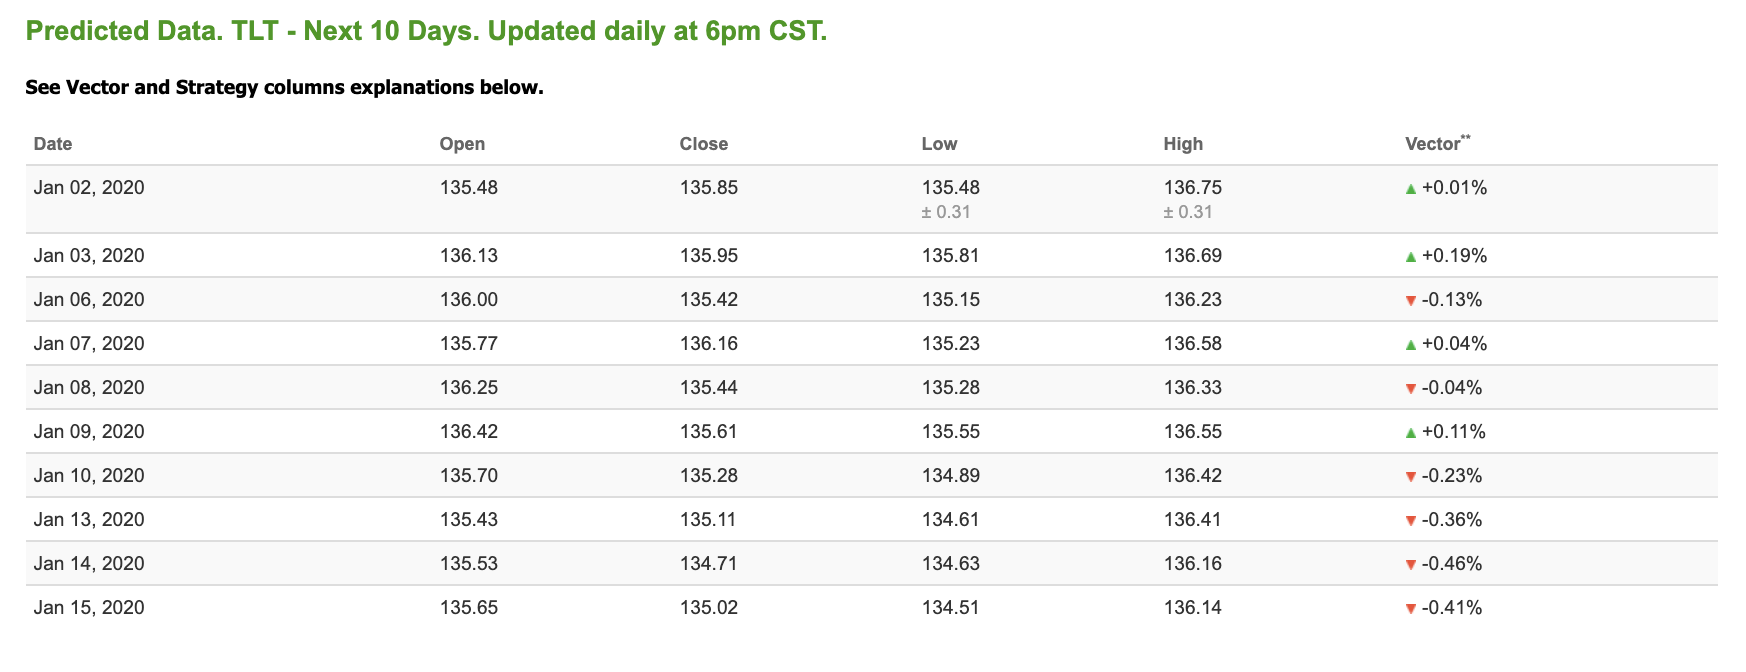
Using the iShares 20+ Year Treasury Bond ETF (TLT) as a proxy for bond prices in our Stock Forecast Tool, we see mixed signals in our 10-day prediction window. Today’s vector of +0.01% moves to-0.04% in four sessions. Prediction data is uploaded after the market close at 6 p.m., CST. Today’s data is based on market signals from the previous trading session.
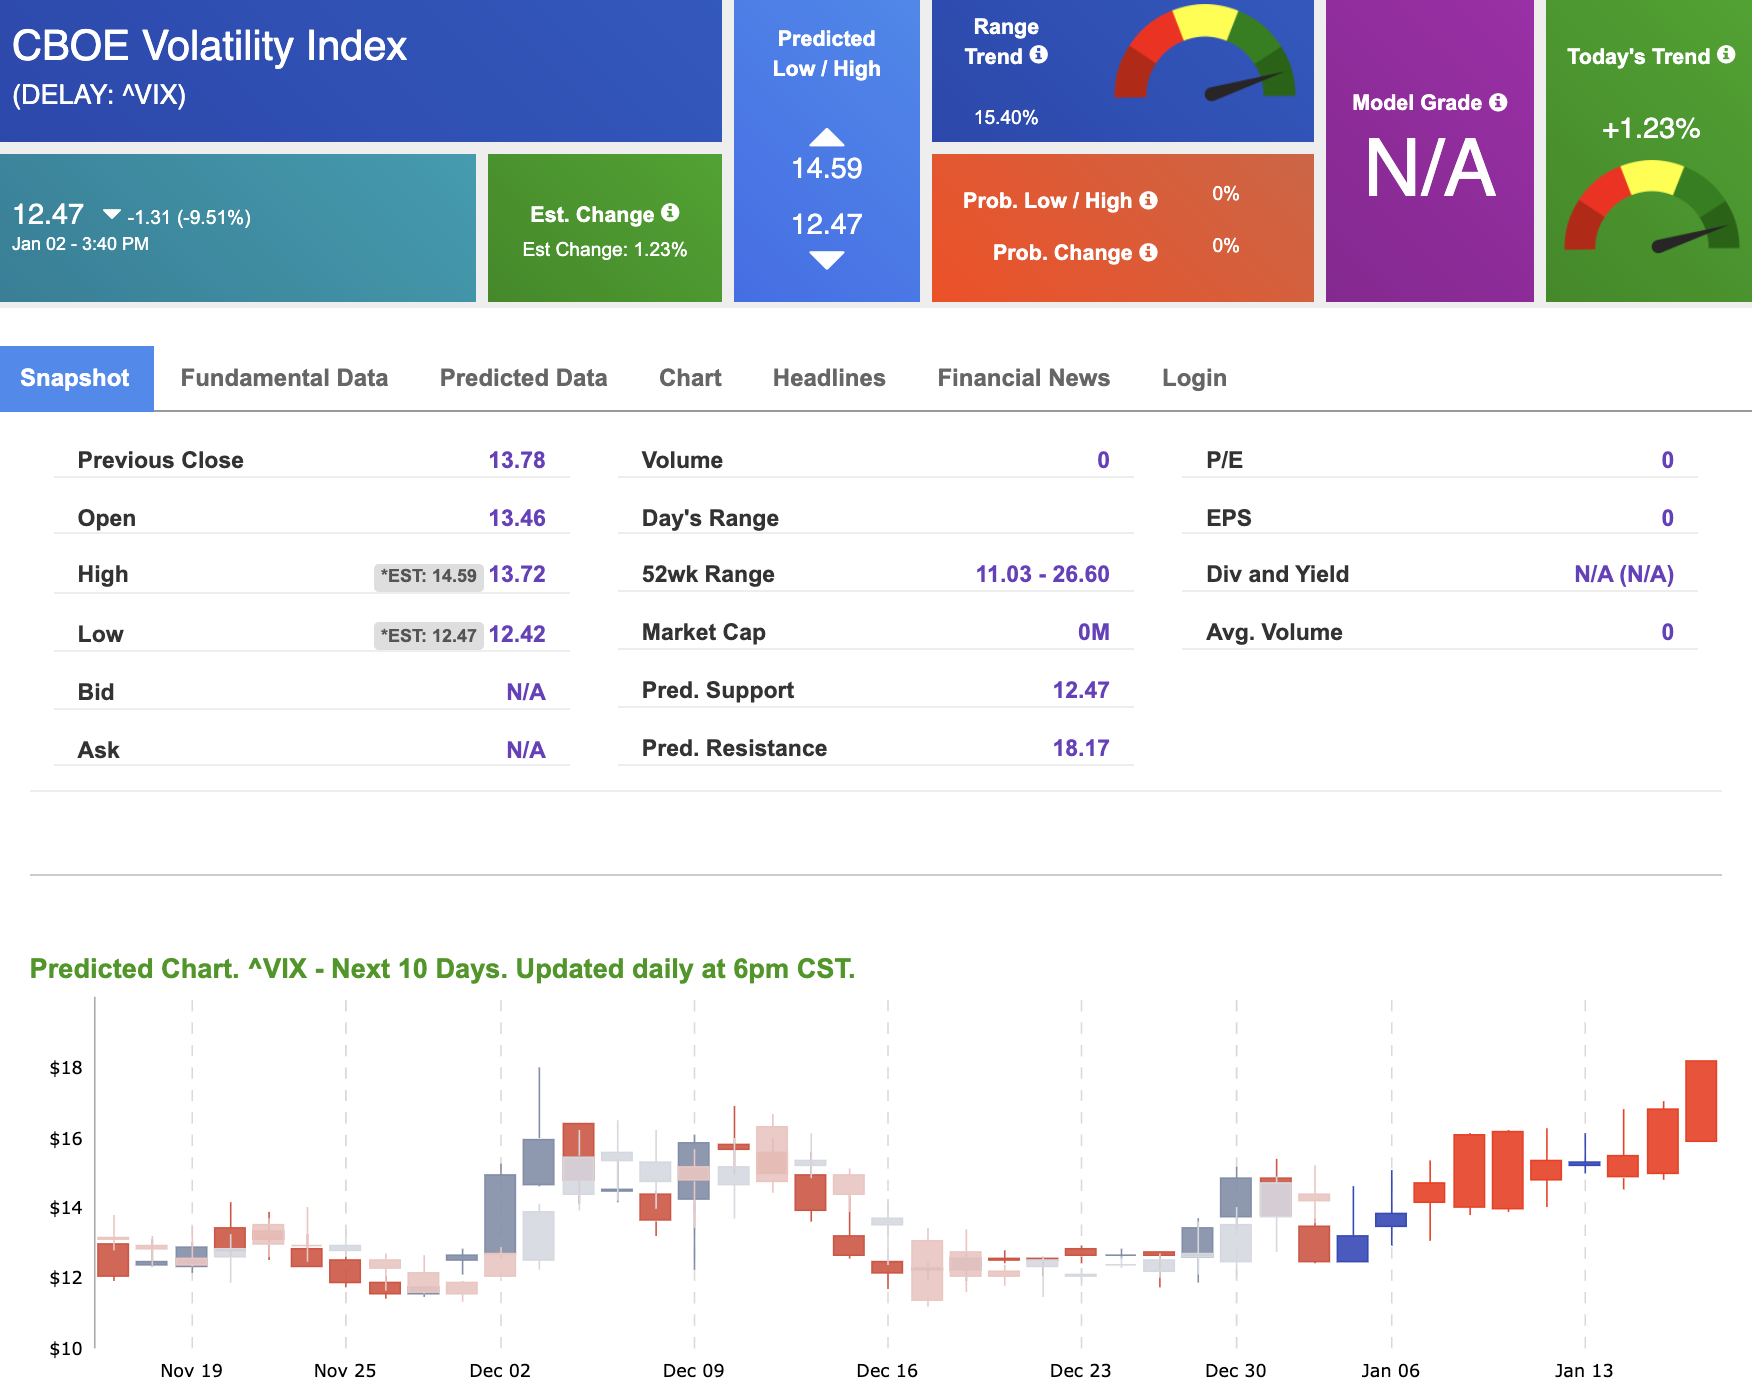
VOLATILITY
The CBOE Volatility Index (^VIX) is $12.47 at the time of publication, and our 10-day prediction window shows positive signals. Prediction data is uploaded after the market close at 6 p.m., CST. Today’s data is based on market signals from the previous trading session.