| The stock market closed higher during Friday’s shortened session after setting record highs throughout the week while taking Thursday off for the holiday. The bulls wrapped up a solid month after holding key support as volatility once again closed right at a key level of support.
The Nasdaq tagged a high of 19,245 before ending at 19,218 (+0.8%). Lower resistance at 19,250-19,400 was challenged and held. Support is at 19,000-18,850.
The S&P 500 went out at 6,032 (0.6%) with the intraday all-time peak reaching 6,044. Key resistance at 6,000 was reclaimed. Support is at 5,950-5,900.
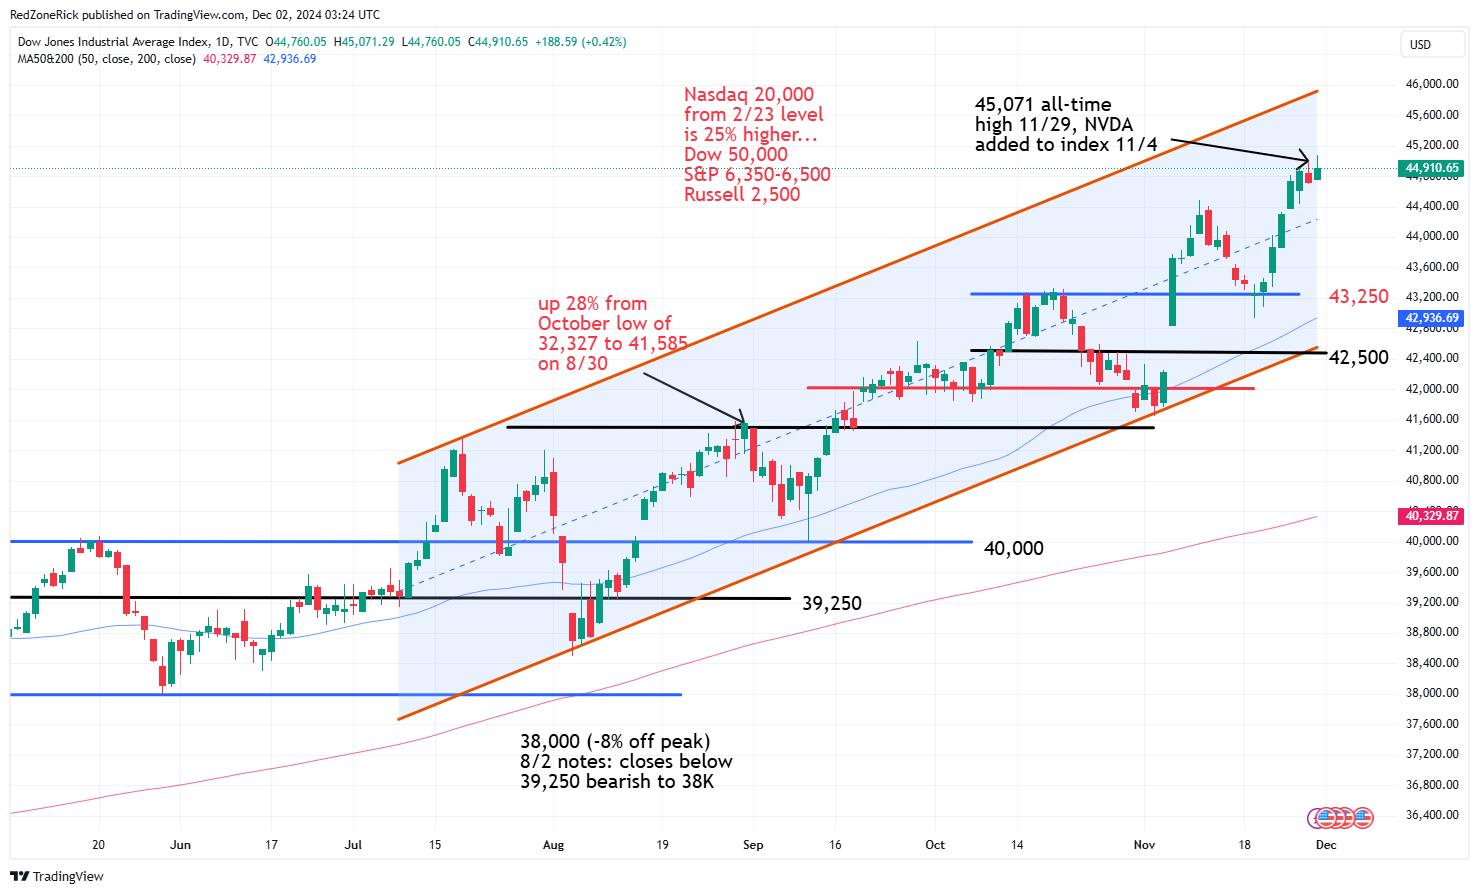
The Dow hit another record high of 45,071 while settling at 44,910 (+0.4%). Key resistance at 45,000 was topped but held. New support is at 44,750-44,500.
Earnings and Economic News
Before the open: Hub Cyber Security (HUBC), Imperial Petroleum (IMPP)
After the close: Credo Technology Group (CRDO), Zscaler (ZS)
Economic News
PMI Manufacturing Index – 9:45am
Construction Spending – 10:00am
ISM Manufacturing Index – 10:00am
Technical Outlook and Market Thoughts
We mentioned coming into last week the technical setup for the major indexes had improved dramatically after the bulls held key support levels the prior week. The Dow, S&P, and the Russell set another round of record highs on Monday and throughout the week with the Nasdaq the only index failing to join the party.
November tends to be the most bullish month in election years and last month’s results were impressive. In fact, it was the best month of the year for the major indexes. The Nasdaq rallied 6.2%; the S&P jumped 5.7%, the Dow surged 7.5%; and the Russell zoomed over 10%.
The first trading day of December is typically bullish, as well as the month in an election year. Also adding to possible bullish sentiment would be the “Santa Clause rally” and the “January Effect”.
The Santa Clause rally, if there is one, takes place the last five trading days of the year and the first two in January. The average gain has been about 1.5% since the late 1960’s. If there is a pullback in the market over this time frame, it could be a slightly bearish signal for January as history has shown.
As for the January Effect, history also has shown the small-caps typically outperforming the big caps in January. In typical bullish years, the major indexes tend to outperform the Russell until October and when they start to wake up. In more recent years, the January Effect seems to be occurring in mid-December, and when the small-caps start to rise at a faster rate into next month.
Year-end dividends, payouts, and bonuses could be a reason for the outperformance of the small-caps. In any event, the breakout to all-time highs is already underway.
For the second-straight week, the Russell (up 1.5%) outpaced the other major indexes after soaring 4% the prior week and holding key support at 2,300. The current and recently adjusted uptrend channel shows ongoing strength towards 2,475-2,500 with the latter representing our 25% higher Price Target from February 23rd with the index at 2,016. Fresh support is at 2,425-2,400 with the middle of the channel at 2,375.
|