Monday’s earnings announcements:
Before the open: None
After the close: None
Economic News
None – Bond Market Closed
Market Thoughts
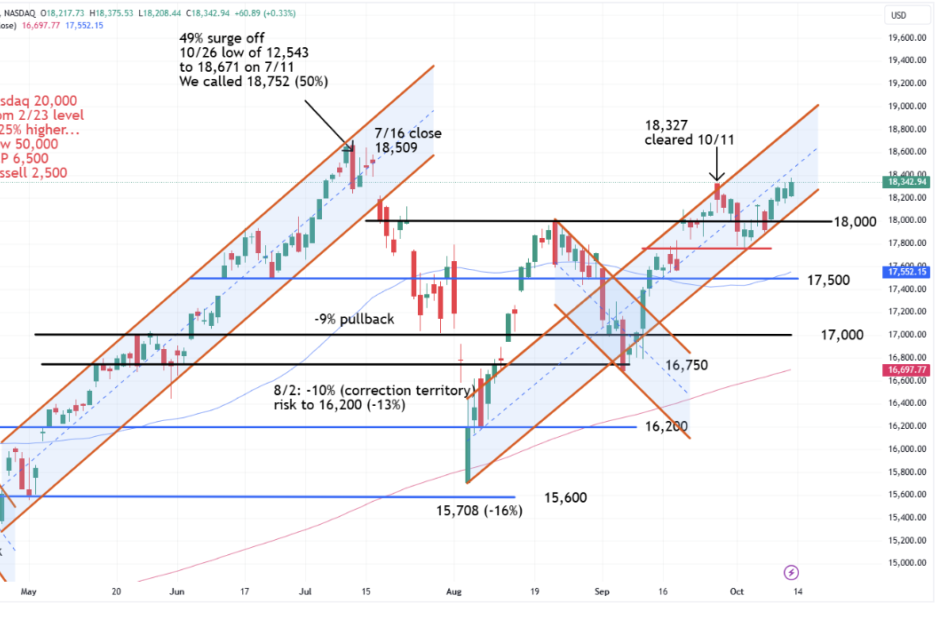
The Nasdaq is less than 2% from setting fresh record highs and we mentioned last Thursday to watch the intraday peak at 18,327 from September 26th. Friday’s close above this area was bullish but 18,500 is more important. This level represents the July 16th close at 18,509 before a 2.8% pounding the following session.
A revised uptrend channel off the August 5th low for the Nasdaq shows the potential for a run towards 19,000. While this may seem lofty, on February 23rd with the Nasdaq closing at 15,996, we forecasted Nasdaq 20,000 which represented another 25% upside at the time.
A drop below 18,000 on the Nasdaq in the coming weeks would be a slightly bearish signal with wiggle room down to 17,750. The 50-day moving average near crucial support at 17,500 is starting to curl back higher so this is also a bullish signal.
The 5,700 level on the S&P has basically been holding since September 19th, or for 17 sessions, and confirmed the triple-top breakout. More importantly, a revised uptrend channel also shows 5,700 as crucial support and the bottom of the channel off the August 5th low. Obviously, a close below 5,700 would be a warning sign of a possible near-term top for the index.
As for near-term upside, the channel is showing 5,900 and a close above this level that would automatically get 6,000 in focus as traders like nice, round numbers.
The Dow fell out of its uptrend channel on Monday but regained traction by Wednesday’s close. The current trajectory is showing momentum towards 43,750 and is just 2% away. As for support, the 42,000 level has also been holding since September 19th with wiggle room down to 41,500.
Our February 23rd our targets for the Dow and S&P were at 50,000 and 6,500, respectively, after the indexes closed at 39,131 and 5,088.
Looking at the small-caps, the Russell closed at 2,234 and back above the 2,200 level after soaring 2.1% on Friday. The index tested a low of 2,170 last Thursday after we highlighted the action between 2,175-2,225 over the previous 12 sessions.
Our possible breakout target at 2,260 is back in focus for the small-caps and resistance we have highlighted from July and September. The July 31st peak is just south of 2,300 with the all-time high at 2,444. In February, we listed a Price Target of 2,500 for the Russell, this year, or next.
As a reminder, a close back below 2,175 on the Russell would be a bearish setup with retest potential down to 2,135. This level also represents the exact breakouts from mid-July, mid-August, and mid-September.

