

Nasdaq Recovers 19,000 Level
The stock market made higher weekly highs on Friday after holding key support levels throughout the week. The technical outlook also improved as the major indexes are once again looking at making another round of fresh all-time highs.
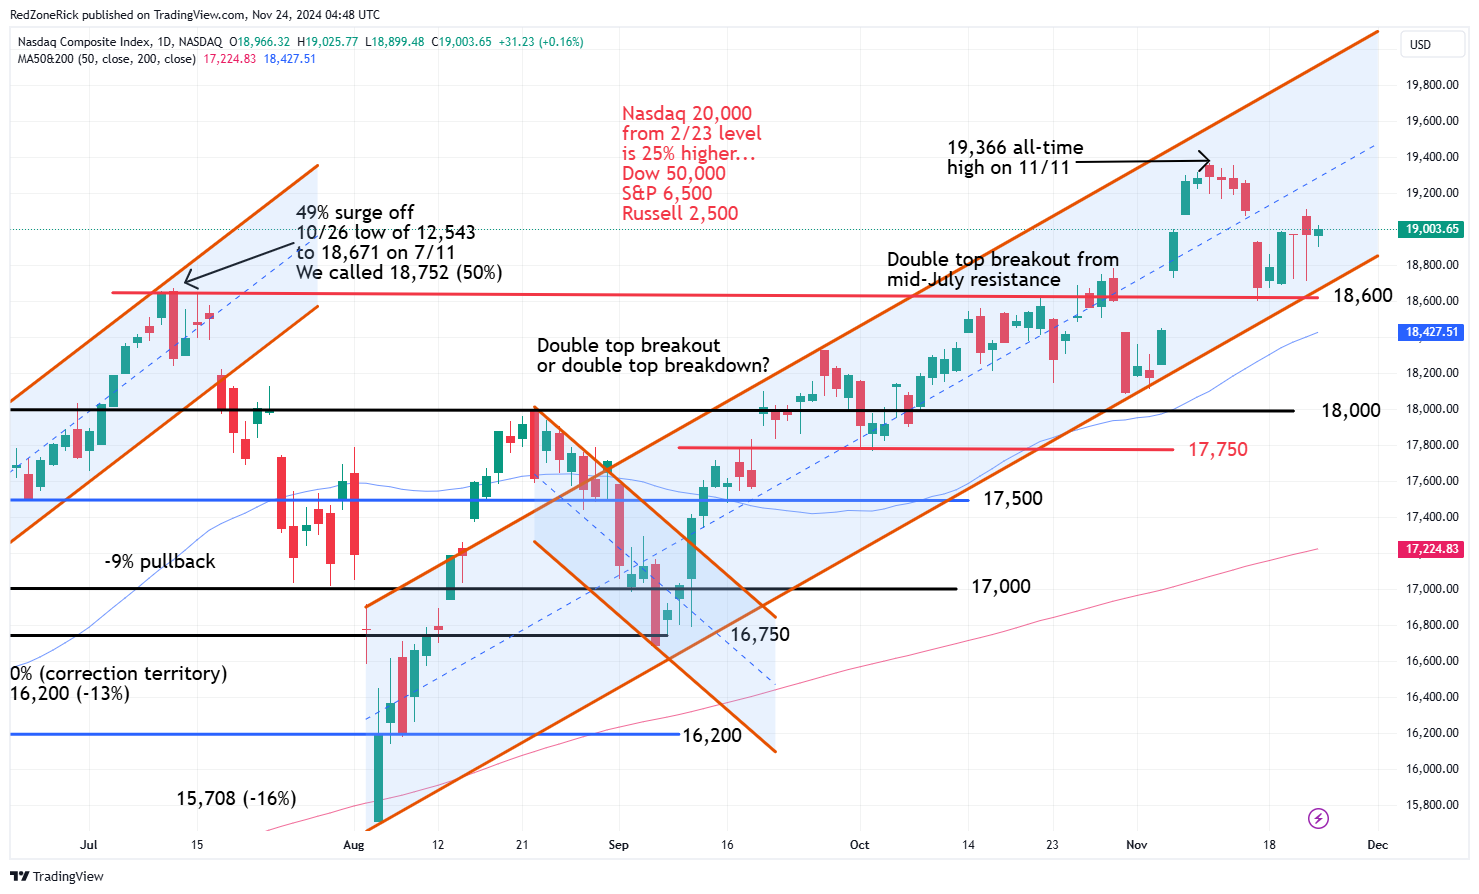
The Nasdaq ended at 19,003 (+0.2%) after tagging a late day high of 19,025. Key resistance at 19,000 was cleared and held. Rising support is at 18,750-18,600.
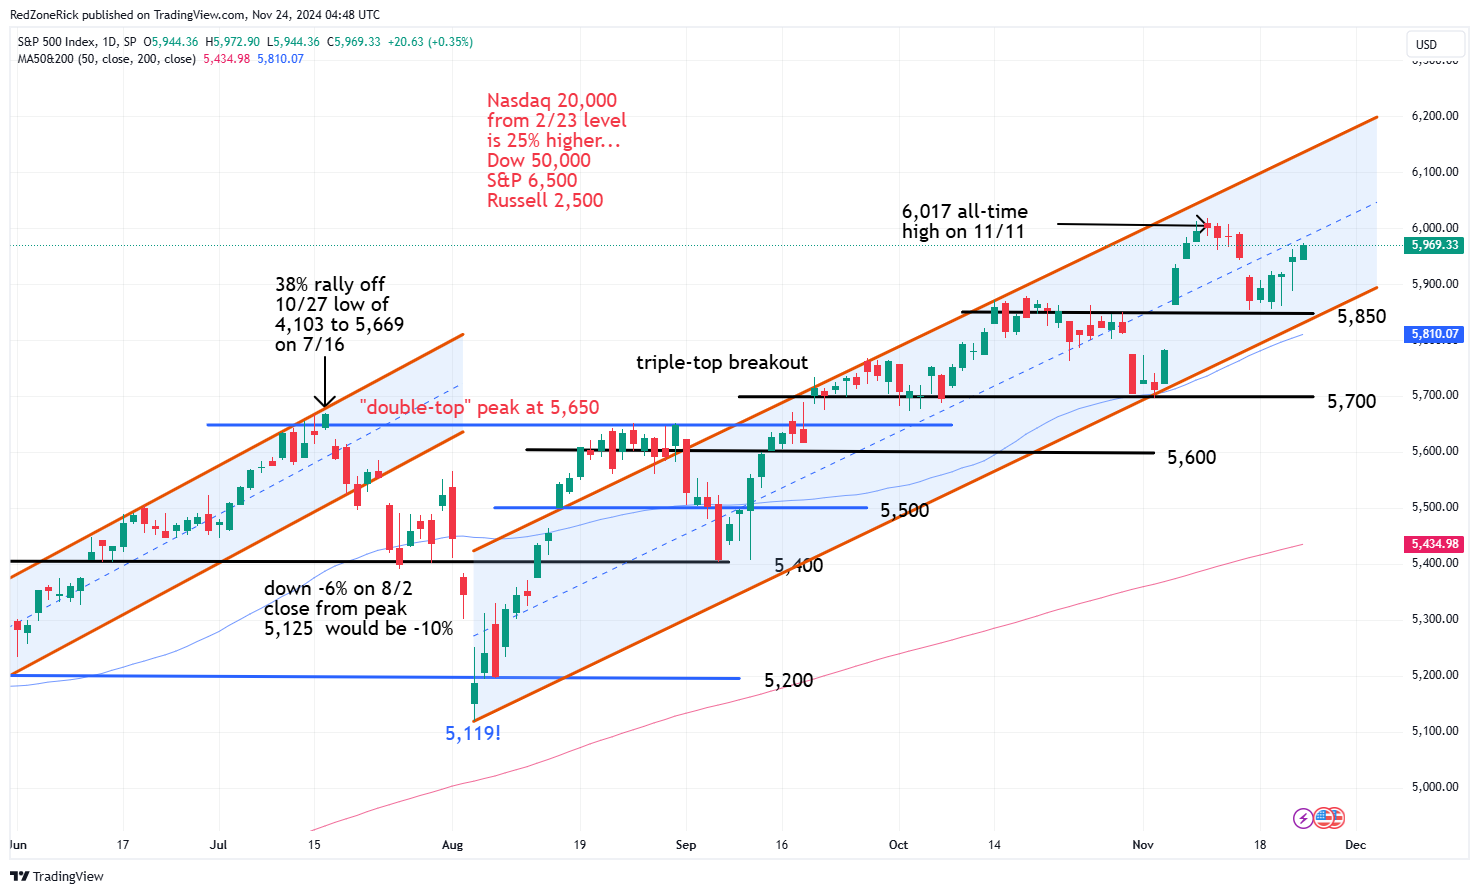
The S&P 500 traded up to 5,982 before going out at 5,969 (0.4%). Lower resistance at 5,950-6,000 was reclaimed. Support is at 5,900-5,850.
The Dow finished at 44,296 (+1%) with the afternoon peak hitting 44,323. Lower resistance at 44,250-44,500 was topped and held. Fresh support is at 44,250-44,000.
Earnings and Economic News
Before the open: Bath & Body Works (BBWI), Splash Beverage (SBEV)
After the close: Agilent Technologies (A), Blue Bird (BLBD), Semtech (SMTC), Zoom Video (ZM)
Economic News
None
Technical Outlook and Market Thoughts
The technical setup for the major improved dramatically on Thursday and Friday after the bulls held key support levels to start last week. We wanted to revise the charts off the August 5th market lows to reflect how crucial these levels are in trying to predict near-term market action.
The Nasdaq easily held key support at 18,600 following the prior Friday’s intraday low at 18,598. We mentioned this area served as double-top resistance from mid-July and late October and now represents a breakdown point from the bottom of the uptrend channel. A close below this level would likely lead to a further fade to 18,500-18,350 and the 50-day moving average.
We predicted if the Nasdaq reclaimed 19,250 it would confirm another run towards 19,350-19,500 with the recent all-time top at 19,366. The middle of the adjusted uptrend channel is now at 19,500 with the top showing potential to 20,000. On February 23rd, with the Nasdaq a shade below 16,000, we predicted another 25% surge could come this year.
The S&P held key support at 5,850 following the prior Friday’s intraday low at 5,853. Last Tuesday’s low kissed 5,855 before Thursday’s mini breakout. The adjusted uptrend channel off the August 5th lows clearly shows the bottom at 5,850. A close below this level reopens downside risk to 5,800 and the 50-day moving average. The middle of the uptrend channel is at 6,050 with the recent all-time high at 6,017. The top of the uptrend channel is at 6,200 and our February price target for yearend was penciled-in at 6,500.
The Dow notched its 44th record close of the year and jumped back into its prior uptrend channel. The newly adjusted uptrend channel now has key support in the middle at 43,250. Backup help is at 42,500 and now represents the bottom of the uptrend channel. The middle of the uptrend channel is at at 44,000 with the recent lifetime high at 44,486. The top of the channel is at 45,500.
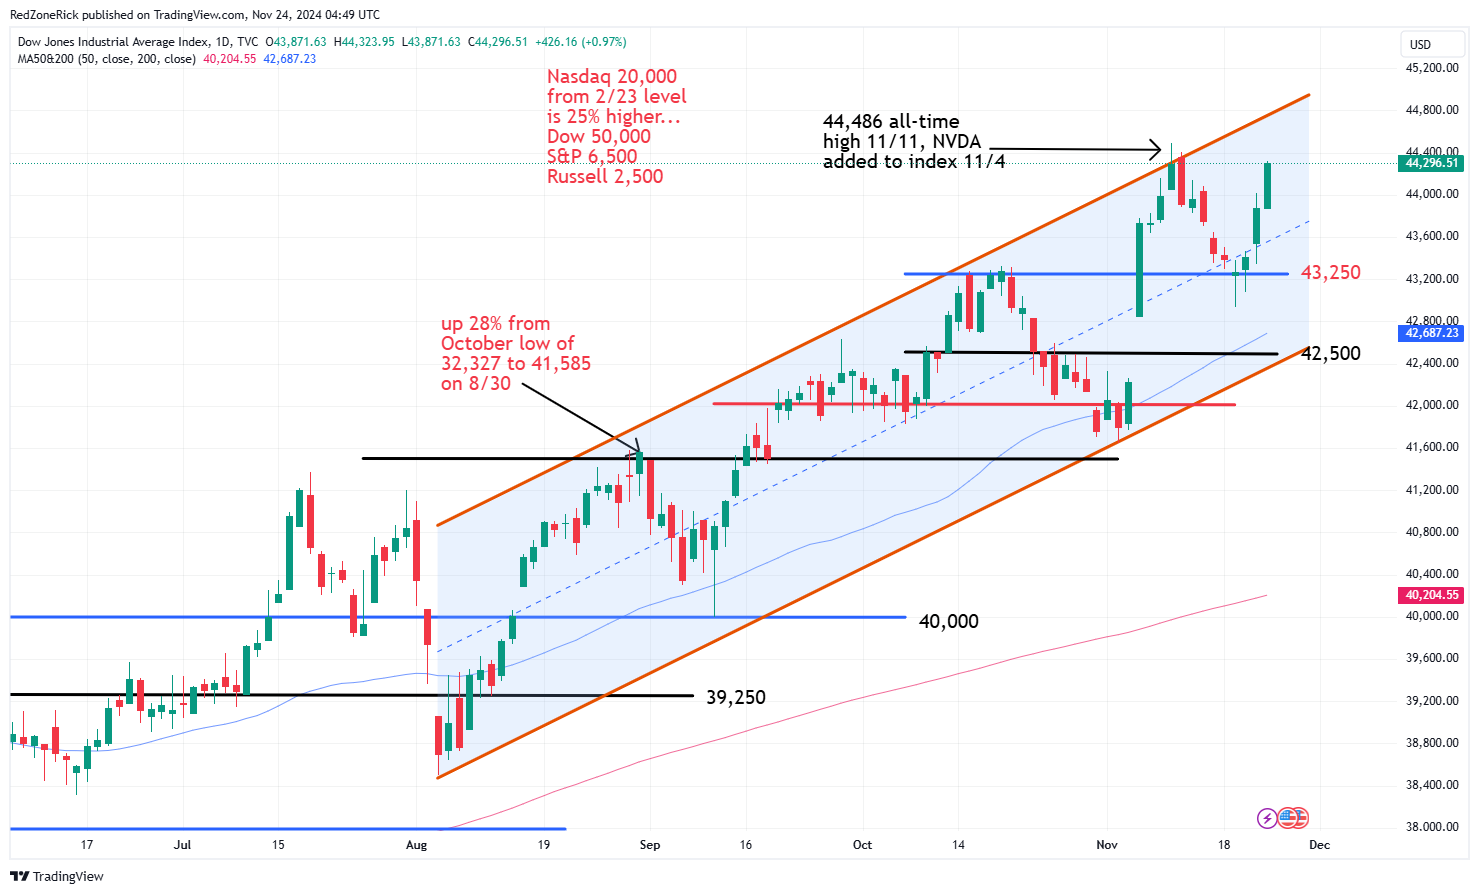
We predicted in February the Dow could make a push towards 50,000 and that likely comes next year. The good news is Nvidia (NVDA) was recently added and is the one stock that could easily get the blue-chips there next year. The company replaced Intel (INTC) to better represent the semiconductor industry along with Sherwin-Williams (SHW) which replaced Dow Company (DOW).
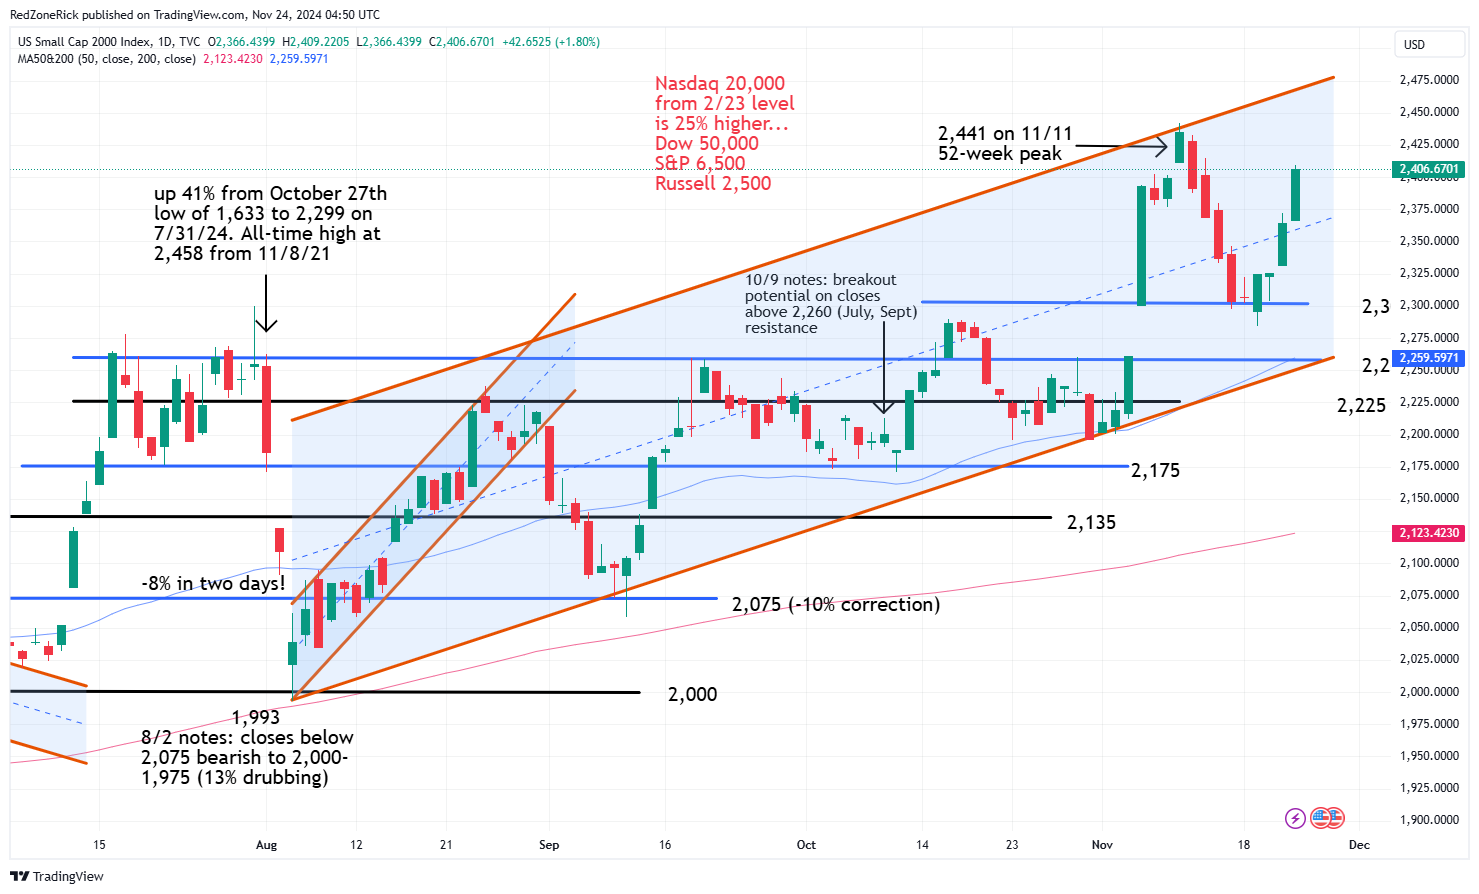
The Russell outpaced the other major indexes after soaring 4% for the week and holding key support at 2,300. We replaced the uptrend line off the August 5th lows with an uptrend channel that still shows solid support at 2,260. The middle of the uptrend channel is at 2,375 and the recent 52-week high is at 2,441. The top of the channel is at 2,500 and the all-time top is at 2,458 from November 2021. Our Price target from February was right at 2,500.
The Volatility Index (VIX) remained rangebound between 15-17.50 throughout all of last week and over the past six sessions. Another close below 15 would likely confirm higher market highs with another retest to 13.50 possible. If we go out on a limb, we think the VIX could trade down to 12.75-11.50 in January and during the first-quarter earnings season.
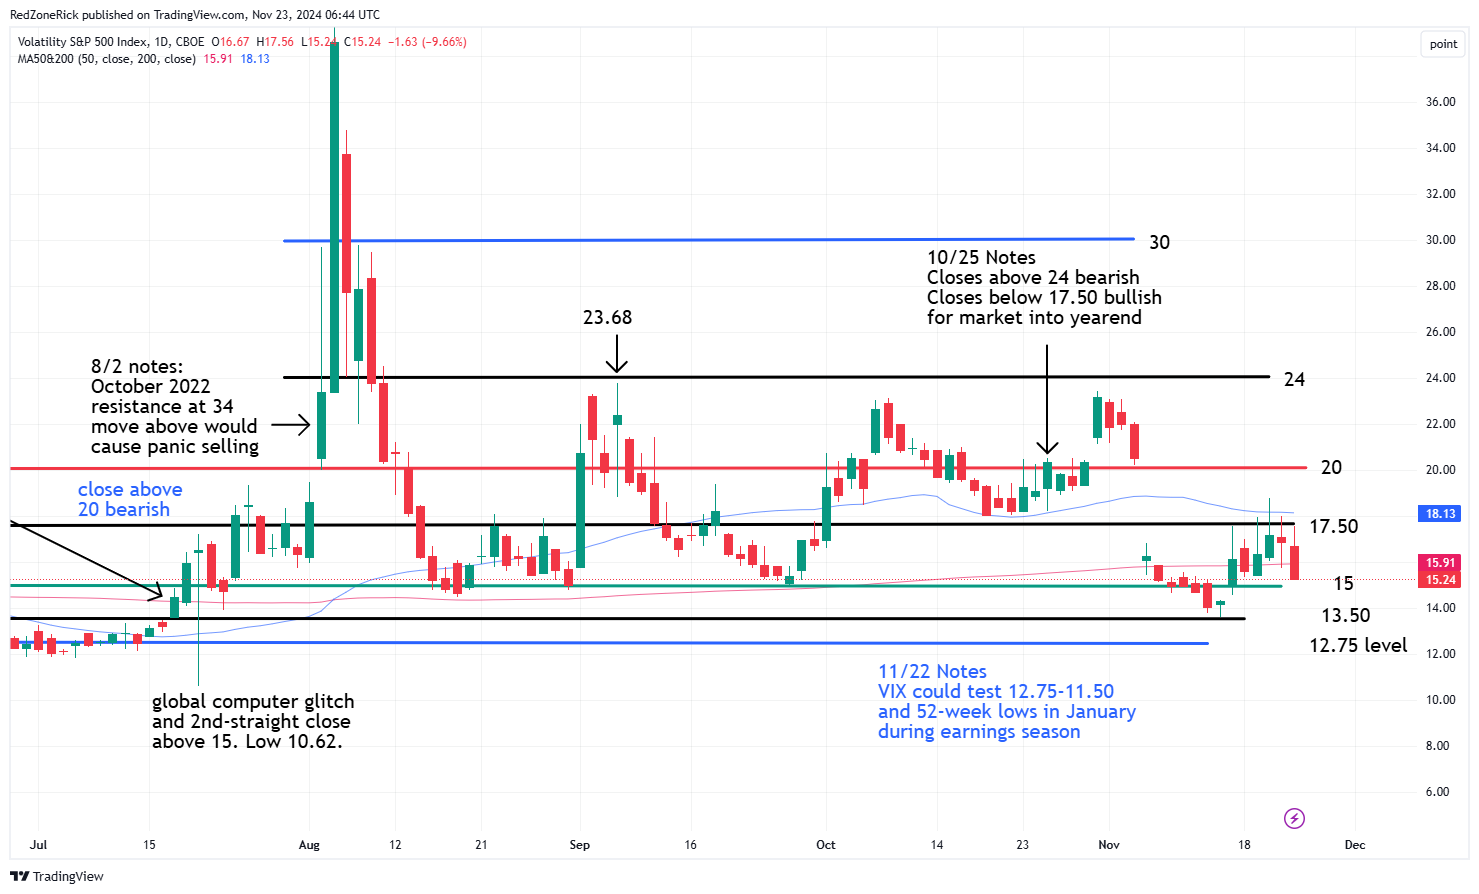
As a reminder, we said not to get “cautious” on the market until 20 is cleared and held. We would turn bearish on the market on a move above 24.
The RSI (relative strength index) levels are at reasonable levels after pushing 70 and holding 50 over the past few weeks. The former reading represents overbought levels with the latter representing a neutral outlook. The Nasdaq and the S&P closed Friday with RSI levels near 60. The Dow and Russell were in the mid-60’s.
The week of Thanksgiving is typically a bullish time period along with the month of December. All signs are pointing towards a continued bull run into early 2025 and we have key support levels clearly outlined before we would turn cautious.