
Record Highs and Overbought Conditions Remain in Focus
- For the week, the Nasdaq gained 1.5% and the S&P was up 0.6%. The Dow slipped 0.1% while the Russell added 0.3%. Year-to-date, the Nasdaq has rallied 8.2% while the S&P is higher by 7.1%. The Dow has added 4.1% and the Russell is up 10 points, or 0.4%.
- The Nasdaq and S&P 500 set another round of record highs on Friday with RSI (relative strength index) once again reaching overbought territory. Readings above 70 are typically a top for a stock or index. The Nasdaq’s RSI was at 73 on Friday’s close while the S&P’s RSI was at 69. Both of them flatlined following the overall market pullback off the opening highs.
- With our February Price Targets coming into play for the major indexes, it is important to highlight key support levels, especially with August right around the corner. They are at Nasdaq 20,500; S&P 6,200; Dow 44,000 and Russell 2,175.
The stock market tagged another round of record highs on Friday’s open but ended the session mostly lower with Tech eking out a slight gain. Some of the nervousness came after a report said the Trump administration was eyeing a minimum tariff of between 15%-20% in any deal with the European bloc.
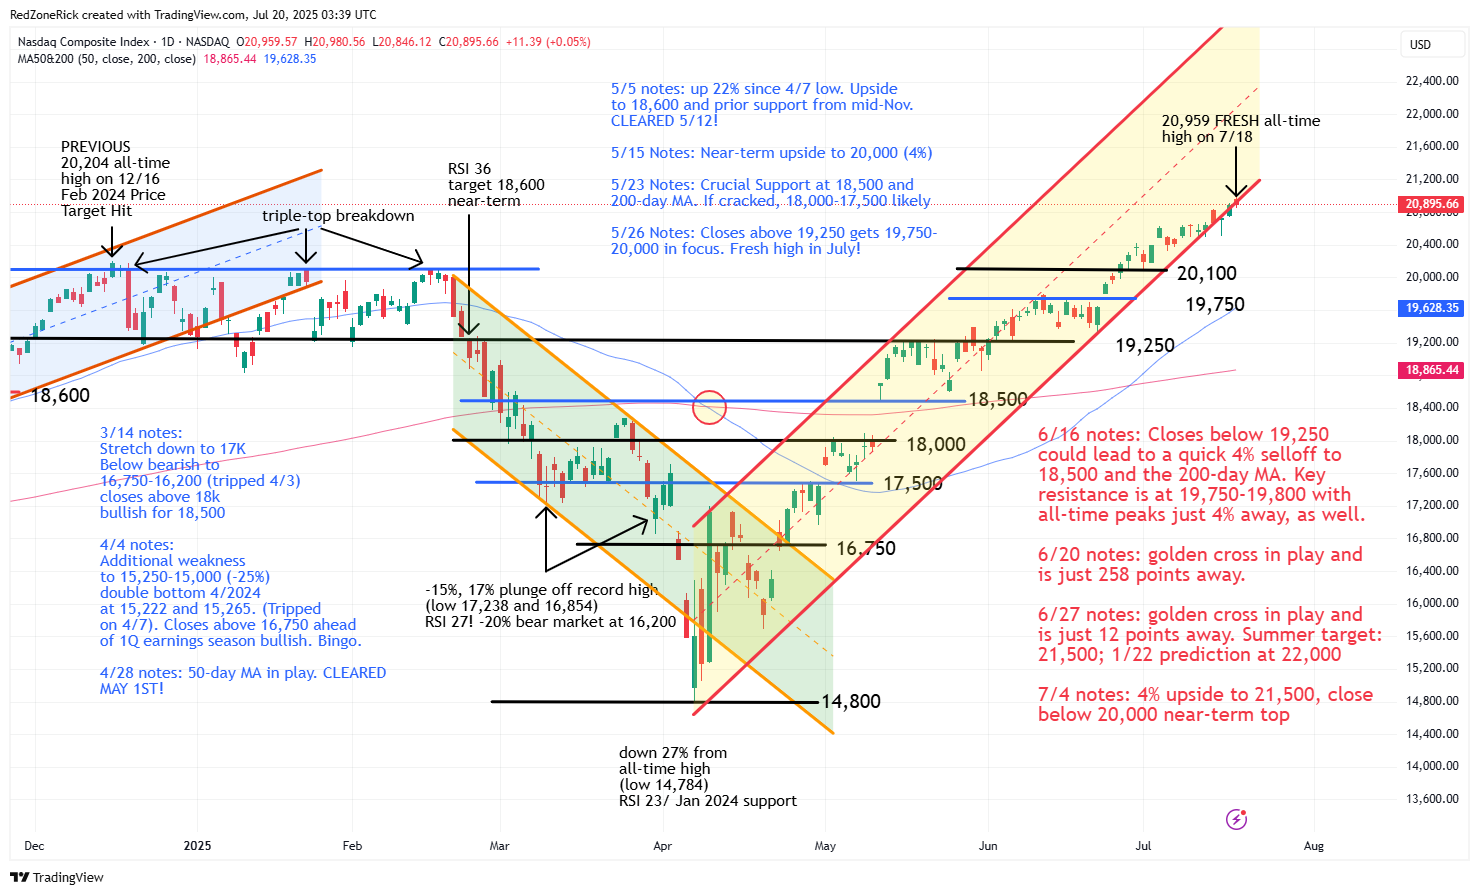
The Nasdaq tapped an all-time high of 20,980 while settling at 20,895 (+0.1%). Fresh resistance at 21,000 held. Support is at 20,500.
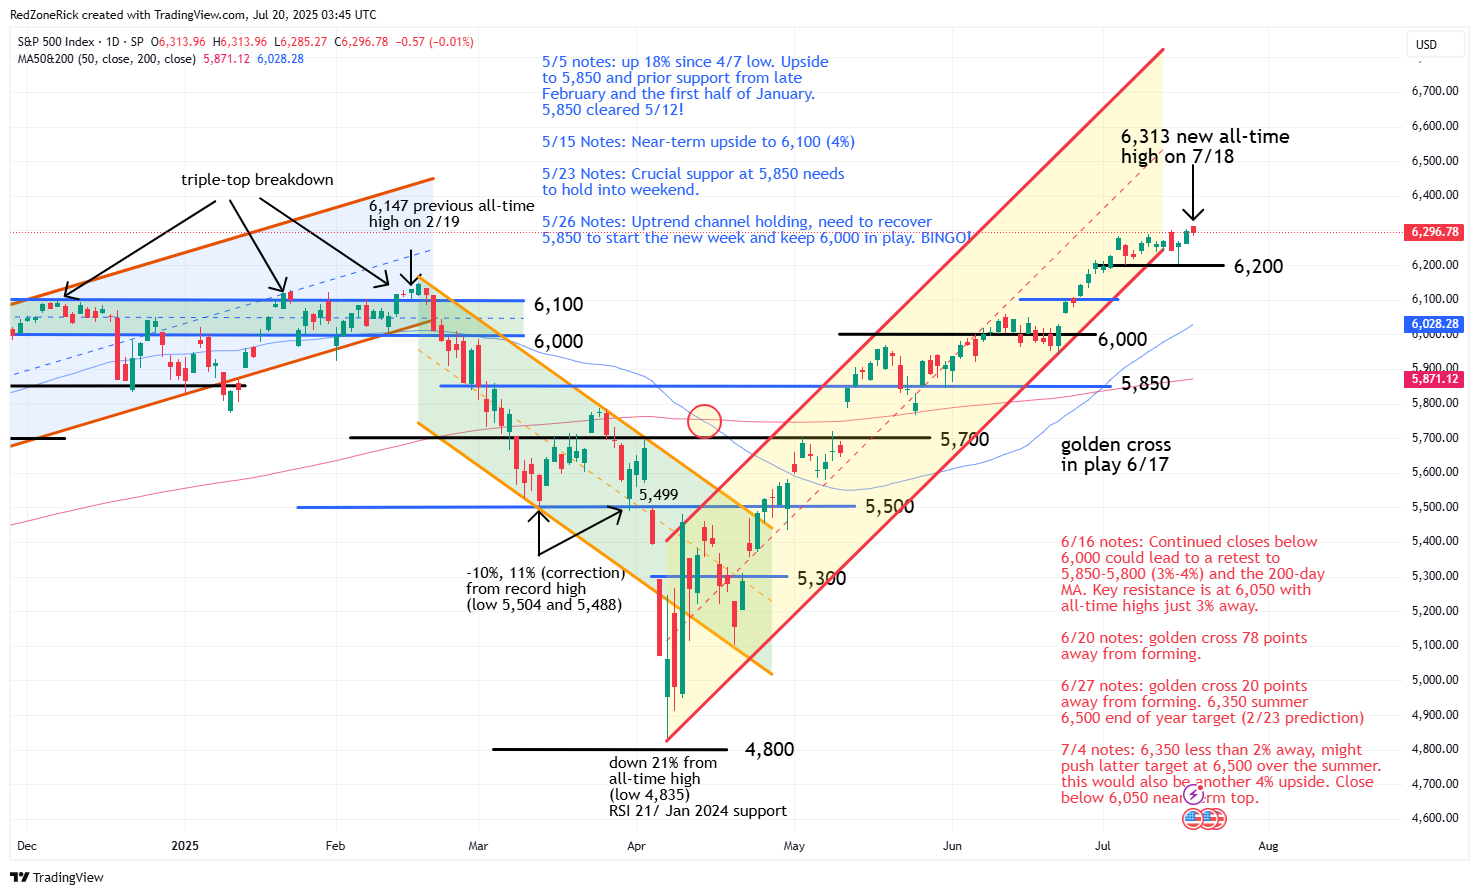
The S&P 500 went out at 6,296 (-0.01%) with the record peak at 6,313. Resistance at 6,300 was cleared but held. Key support is at 6,200.
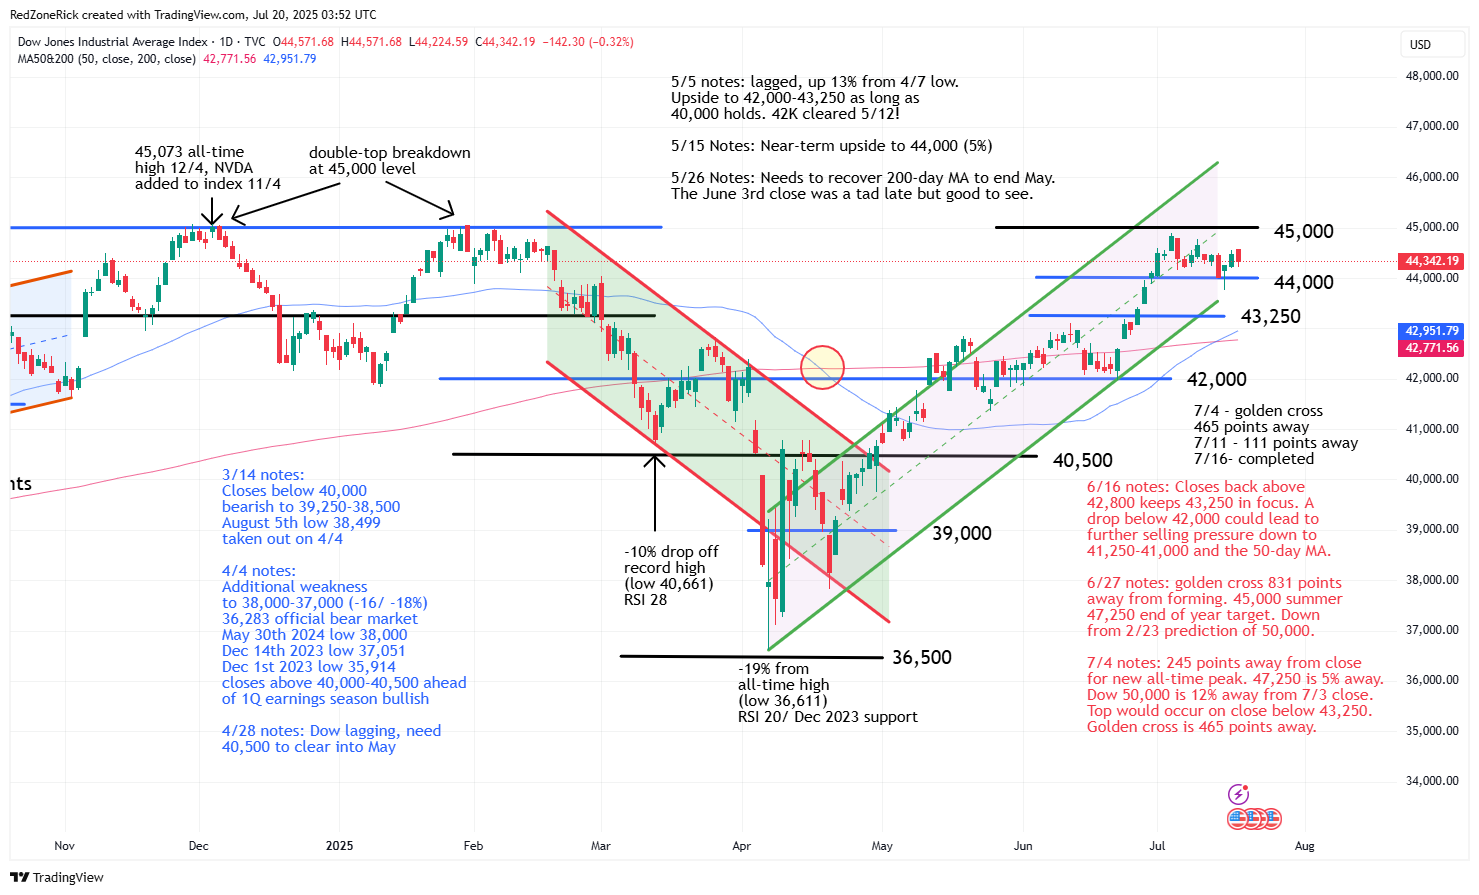
The Dow traded to a high of 44,571 before closing at 44,342 (-0.3%). Resistance at 44,500 was topped but held. Support is at 44,000.
Earnings and Economic News
Before the open: Domino’s Pizza (DPZ), Cleveland-Cliffs (CLF), Verizon Communications (VZ)
After the close: Crown Holdings (CCK), NXP Semiconductors (NXPI), Steel Dynamics (STLD)
Economic News
Leading Indicators – 10:00am
Technical Outlook and Market Thoughts
For the week, the Nasdaq gained 1.5% and the S&P was up 0.6%. The Dow slipped 0.1% while the Russell added 0.3%. Year-to-date, the Nasdaq has rallied 8.2% while the S&P is higher by 7.1%. The Dow has added 4.1% and the Russell is up 10 points, or 0.4%.
The Nasdaq and S&P 500 set another round of record highs on Friday with RSI (relative strength index) once again reaching overbought territory. Readings above 70 are typically a top for a stock or index. The Nasdaq’s RSI was at 73 on Friday’s close while the S&P’s RSI was at 69. Both of them flatlined following the overall market pullback off the opening highs.
Both the Dow and the Russell 2000 have current RSI readings of 59 and are in a downtrend after the indexes rolled over on Friday. The 50 level (neutral reading) has been holding for all of the major indexes since late April following the rebound off the bear market lows earlier that month. The 30 level indicates oversold levels on a stock or index.
The Nasdaq is currently hugging its uptrend channel after making record highs four out of the five sessions last week. Fresh and undefined resistance is at 21,000-21,250. Our near-term target is at 21,500 and is just over 2% away from tripping. Our January 22nd target prediction for the Nasdaq is at 22,000 by yearend.
Key support is 20,500 with stretch down to 20,350. A close below 20,100-20,000 would suggest a near-term top.
The S&P 500 stayed in a 112-point range last week while falling out of its uptrend channel. Our Price Targets for the index from February 23rd were at 6,350-6,500 with the former coming within 37 points from Friday’s all-time top.
A close back below 6,200 would be a slightly bearish signal with risk down to 6,100-6,000 and the 50-day moving average.
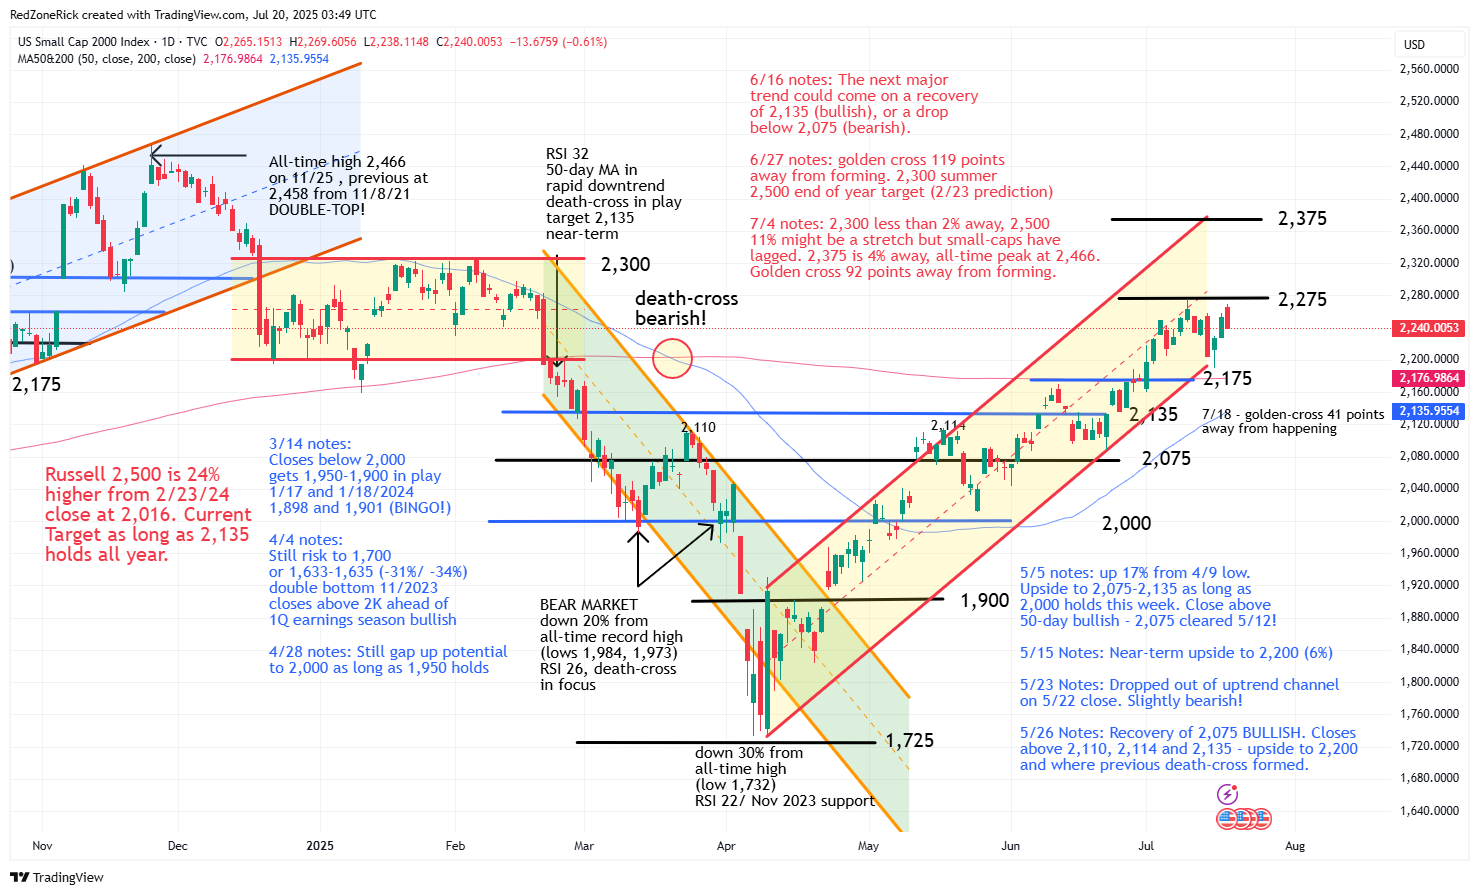
The Russell 2000 consolidated in an 80-point range and is still holding its current uptrend channel. Continued closes above 2,275 keeps our near-term target Price Target for the index at 2,375 in play and remains another 6% away.
A close below 2,200-2,175 and the 200-day moving average would be a slightly bearish signal. If all of these levels fail, backup help is at 2,135 and the 50-day moving average. A golden cross is 41 points away from forming.
The Dow stayed within a 813-point range last week which represented last Wednesday’s low at 44,160 and Friday’s high. Our near-term Price Target for the index remains at 47,250 on a breakout above 45,000. A golden cross has officially formed in the blue-chips and suggests higher highs.
The first wave of support remains at 44,000 and the bottom of the uptrend channel back. A drop below this level likely gets further weakness down to 43,500-43,250 back in the mix.
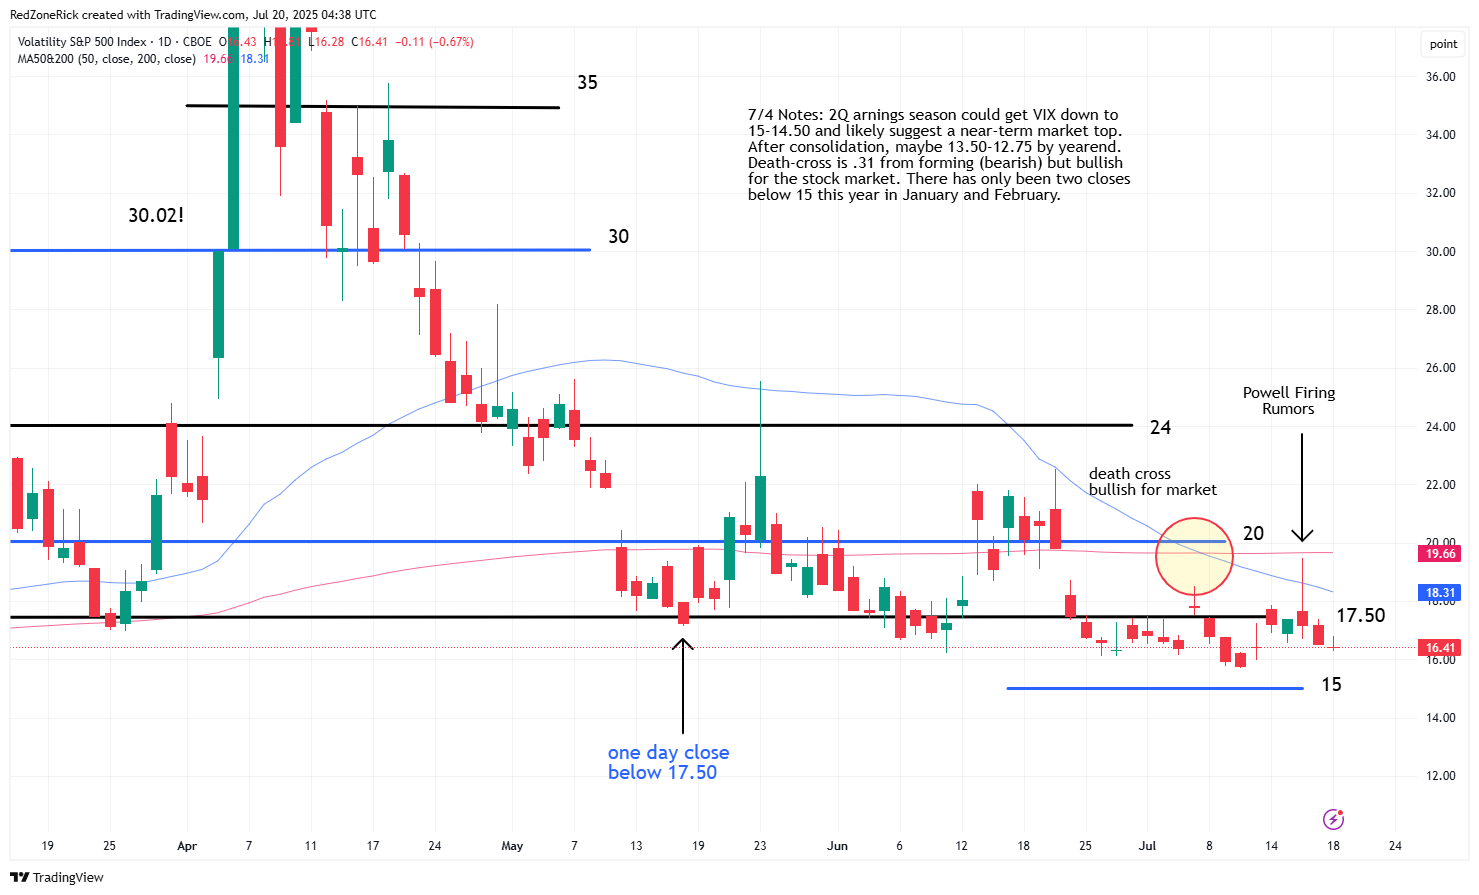
The Volatility Index (VIX) cleared 17.50 twice last week but didn’t close above this level. This level remains key resistance followed by 20 and the 200-day moving average. A close above 20 would imply a near-term market top.
Support is at 16-15.50 with this month’s low at 15.70. We are looking for weakness down to 15-14.50 during earnings season with the market peaking at some point in August.
The two-week trading range has clearly defined near-term support and resistance levels that should continue to give great clues as we get into the start of the 2Q earnings season. June was also a consolidation month before another round of higher highs and when we previously adjusted the uptrend channels.
With our February Price Targets coming into play for the major indexes, it is important to highlight key support levels, especially with August right around the corner. They are at Nasdaq 20,500; S&P 6,200; Dow 44,000 and Russell 2,175.