
Stocks Trade Lower at Start of Giant Earnings Week
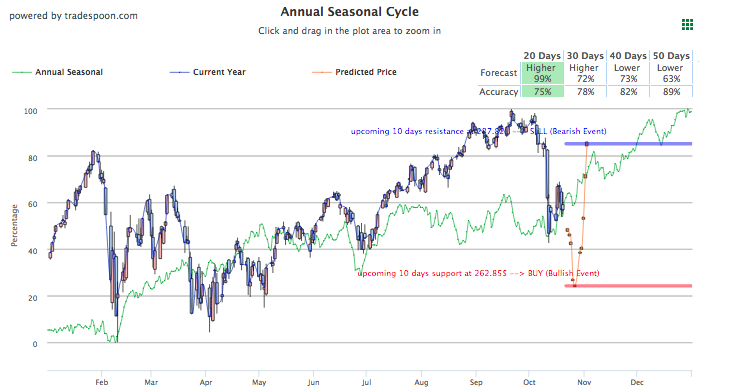
U.S. Stocks continue to look for direction with modest movement today after an up and down week for all three major U.S. indices. Utilities and consumer staples outperformed the market and indicate the late stages of a bull market that should run until the end of this year and possibly through some of first quarter 2019. Elections will continue to hold a cap on rallies despite positive earnings. SPY trades in the range of $275-280, next level of support and resistance is at $268 and $287 if these levels are violated. SPY Seasonal Chart forecast is shown below:

U.S. Stocks are modestly recovering from a volatile week that featured strong earnings and the first signs of underperforming economic reports. The S&P and Dow Jones came out of the week with modest gains while the Nasdaq suffered its third weekly loss. Big earnings-movers include PayPal, which reported above expectations pushing shares up 9%, and eBay, which reports next week but had their expectations downgraded and slide 8%. Other beneficiaries from good third quarter reporting including American Express, Morgan Stanley, Haliburton, Honeywell, and Philip Morris. Amazon, Alphabet Inc, Intel, Microsoft, Twitter, TD Ameritrade, McDonald’s, Coca-Cola, Capital One, Verizon, AT&T, and Boeing are headlining this week in big-name third-quarter reporting while another 300 companies are also set to release.
Globally, Asian markets rose for the second straight session after a turbulent string of days while European markets are slightly down for the day. Geopolitical concerns remain a topic to monitor as U.S.-China trade relations remain unresolved while tension escalates between the U.S. and Saudi Arabia after the disappearance of U.S. journalist Jamal Khashoggi. Oil continues to edge up on the heels of new Iran sanctions set to take effect on November 4th. The dollar is slightly up today while gold continues its multi-day slide. This week in economic reports will include a September new-home sales report on Wednesday, Durable goods orders for the previous month on Thursday, and third-quarter gross domestic product on Friday.
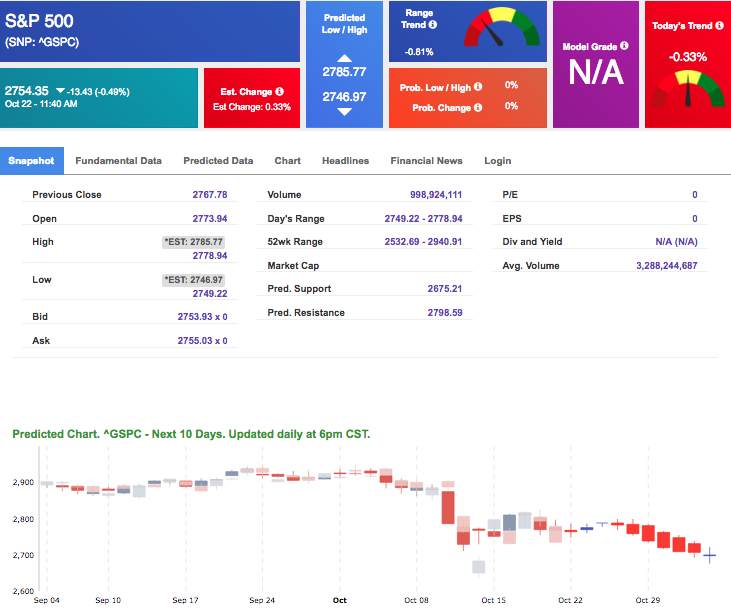
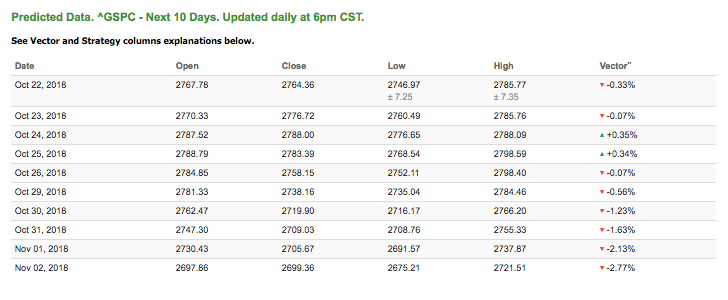
Using the “^GSPC” symbol to analyze the S&P 500, our 10-day prediction window shows negative signals. Today’s vector figure of -0.33% moves to -0.56% in five trading sessions. The predicted close for tomorrow is 2,776.72. Prediction data is uploaded after market close at 6 p.m., CST. Today’s data is based on market signals from the previous trading session.
Highlight of a Recent Winning Trade
On October 17th, our ActiveTrader service produced a bullish recommendation for The AES Corporation(AES). ActiveTrader included in all Tradespoon membership plans and is designed for intraday trading.
Trade Breakdown
AES entered the forecasted Entry 1 price range of $15.07 (± 0.06) in its SECOND hour of trading and moved through its Target price of $15.22 in its THIRD hour of trading. The Stop Loss was set at $14.92.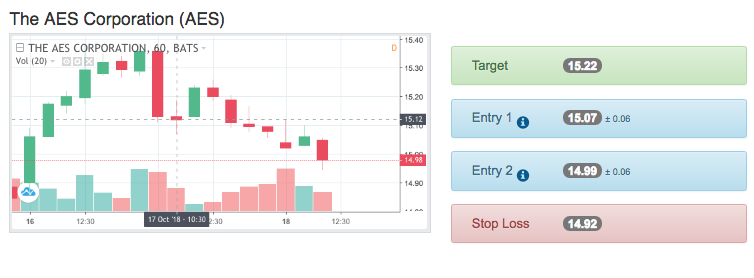
Volatility Performance
Even with increased volatility, Tradespoon technology has been able to provide strong results and accuracy in our post-selloff volatility trading. Similar selloff, to the one we’re seeing this week, in mid-August resulted in 77% winning trades, or 7 out of 9!
Trade Breakdown
On October 16th, in the midst of last week’s volatility, we recommended Netflix (Option) at $0.54 and shorted the stock at $0.10 (36.36% Net Gain!), and that’s just one of many winning trades we had during volatility!
![]()
Finance 3.0 is here! Get Ready for “The Fintech Effect!”
It’s about to disrupt the old financial order…turn IBM and Oracle on their heads… topple some of the World’s Top Traders…and help you generate consistent profits of 46 to 142 percent with 78% accuracy.
Click Here To Learn More
Tuesday Morning Featured Stock
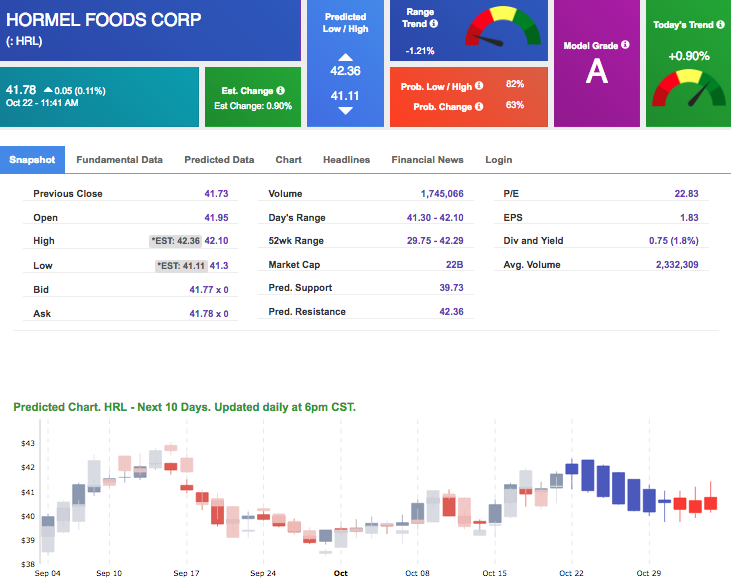
Our featured stock for Tuesday is Hormel Foods Corp (HRL). HRL is showing a confident vector trend in our Stock Forecast Toolbox’s 10-day forecast. This stock is assigned a Model Grade of (A) indicating it ranks in the top 10th percentile for accuracy for predicted support and resistance, relative to our entire data universe.
*Please note: Our featured stock is part of your free subscription service. It is not included in any paid Tradespoon subscription service. Vlad Karpel only trades his own personal money in paid subscription services. If you are a paid subscriber, please review your Premium Member Picks, ActiveTrader or ActiveInvestor recommendations. If you are interested in receiving Vlad’s personal picks, please click here.
The stock is trading at $41.78 at the time of publication, up 0.1% from the open with a +0.90% vector figure.
Prediction data is uploaded after market close at 6 p.m., CST. Today’s data is based on market signals from the previous trading session.
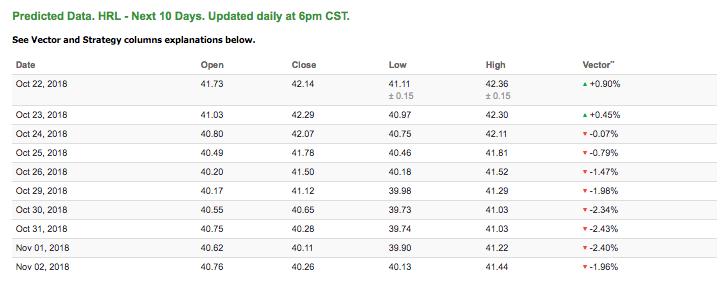
Note: The Vector column calculates the change of the Forecasted Average Price for next trading session relative to the average of actual prices for the last trading session. The column shows expected average price movement “Up or Down”, in percent. Trend traders should trade along the predicted direction of the Vector. The higher the value of the Vector the higher its momentum.
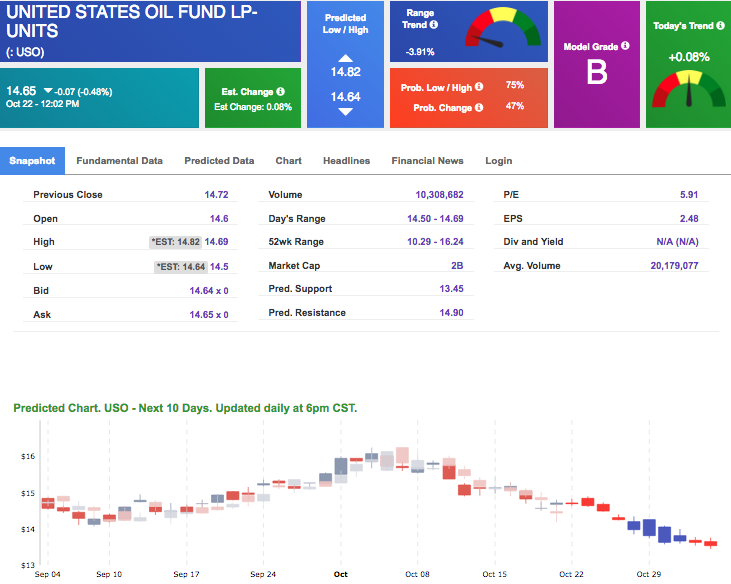
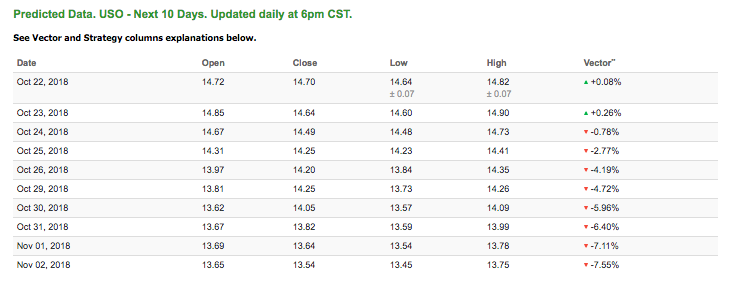
Oil
West Texas Intermediate for November delivery (CLX8) is priced at $68.78 per barrel, down 0.49% from the open, at the time of publication. Looking at USO, a crude oil tracker, our 10-day prediction model shows mixed signals. The fund is trading at $14.65 at the time of publication, down 0.48% from the open. Vector figures show +0.08% today, which turns -4.72% in five trading sessions. Prediction data is uploaded after market close at 6 p.m., CST. Today’s data is based on market signals from the previous trading session.
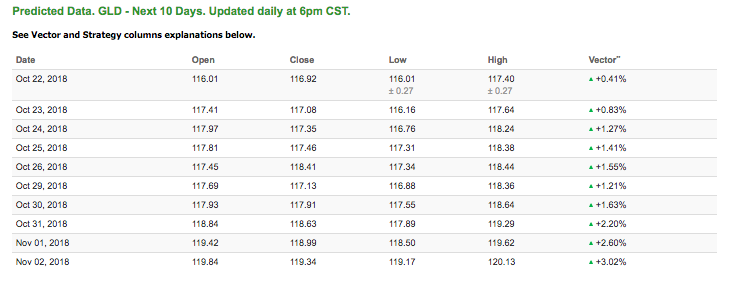
Gold
The price for December gold (GCZ8) is down 0.33% at $1,224.60 at the time of publication. Using SPDR GOLD TRUST (GLD) as a tracker in our Stock Forecast Tool, the 10-day prediction window shows positive signals. The gold proxy is trading at $115.62, down 0.34% at the time of publication. Vector signals show +0.41% for today. Prediction data is uploaded after market close at 6 p.m., CST. Today’s data is based on market signals from the previous trading session.

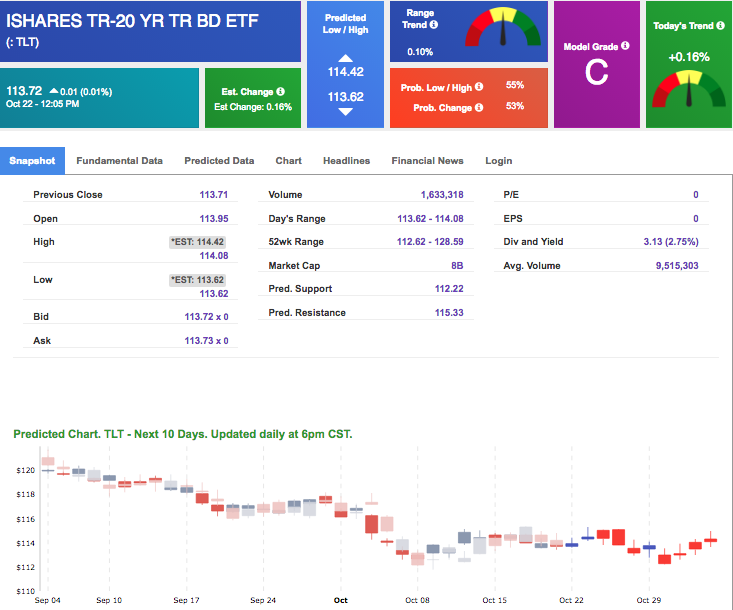
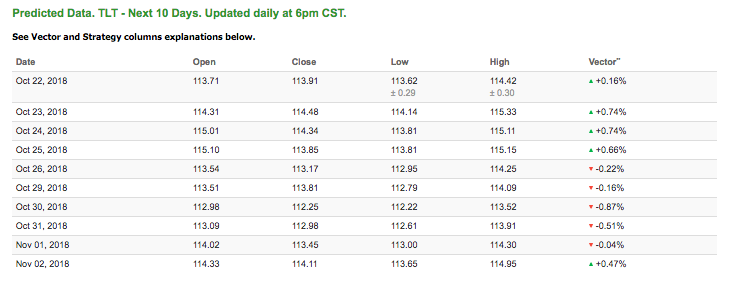
Treasuries
The yield on the 10-year Treasury note is up 0.18% at 3.18% at the time of publication. The yield on the 30-year Treasury note is up 0.38% at 3.38% at the time of publication.
Using the iShares 20+ Year Treasury Bond ETF (TLT) as a proxy for bond prices in our Stock Forecast Tool, we see mixed signals in our 10-day prediction window. Today’s vector of +0.16% moves to -0.22% in four sessions. Prediction data is uploaded after market close at 6 p.m., CST. Today’s data is based on market signals from the previous trading session.
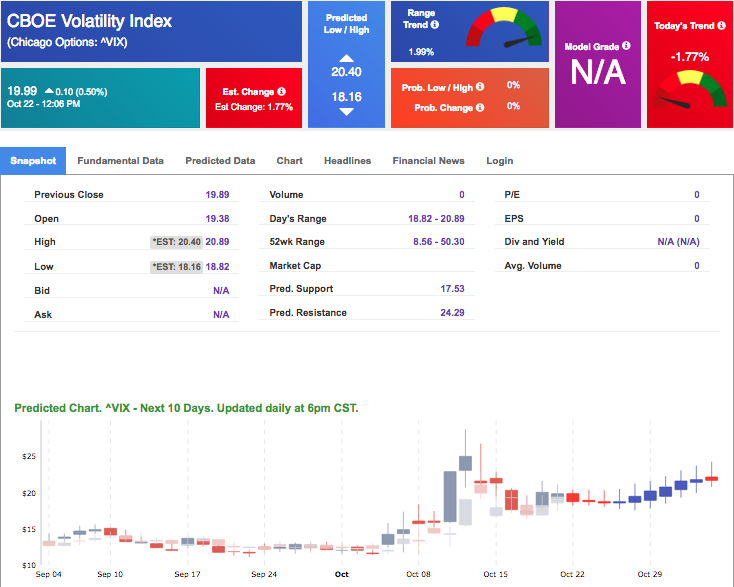
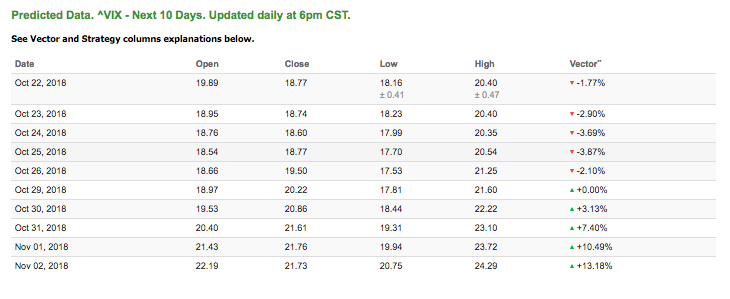
Volatility
The CBOE Volatility Index (^VIX) is up 0.50% at $19.9 at the time of publication, and our 10-day prediction window shows mixed signals. The predicted close for tomorrow is $18.74 with a vector of -2.90%. Prediction data is uploaded after market close at 6 p.m., CST. Today’s data is based on market signals from the previous trading session.
Finance 3.0 is here! Get Ready for “The Fintech Effect!”
It’s about to disrupt the old financial order…turn IBM and Oracle on their heads… topple some of the World’s Top Traders…and help you generate consistent profits of 46 to 142 percent with 78% accuracy.